All Activity
- Past hour
-
My thoughts on this, agree or disagree.... The range of strong/super El Nino snowfalls for Detroit is 20-45". They all have some subtle things in common (early snow, warm December, much colder Jan and/or Feb) but all have differences as well. If the juiced jet provides above avg precip, it can easily be an ok snow year. It works both ways. Since the beginning of record, there are ebbs and flows with snowfall. The record snow of the 2010s settled down big time in the 2020s. We were due. Now, its been 5 years since we had an above avg snow season, so were due the other way. Last years total snow number was only an inch below the longterm avg (5" below the snowier current avg, thanks to the 2000s-10s). But it had way above avg snowcover and below avg temps, so much so it was rated a severe winter on AWSSI. This is now 2 winters in a row that were "cold and white" without a surplus of snow. Theres no question this winter will be warmer than the last 2, but who says thats automatically less snow? We can easily get mild, snowy winters just as we can get cold, white and dry. The strong Nino of 2015-16 had slightly below avg snow in Detroit but above avg snow in the northern suburbs and well above avg snow towards Flint, all with mild temps. Its interesting that most models have eastern MI in the above avg precip as well, on the western shield of the east coast wetness and with a juiced jet. If that comes to fruition, kiss the "dry" el nino goodbye. Of course, it could also unfold in the nightmarish fashion of warm, wet December then colder/drier Jan/Feb. Its all speculation. All that said, I have never once predicted a good winter this year. I expect a subpar winter. But not crazy so. If i had to put a guess on snowfall, id say 30-33" for DTW.
-
87 with a dewpoint of 63 here right now. I'm looking forward to the dewpoint dropping to 50 tomorrow afternoon. It's gonna be a beautiful day.
-
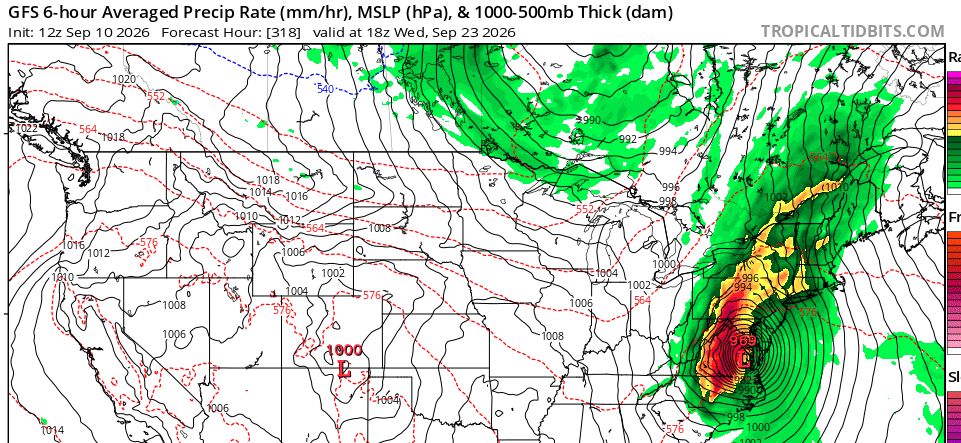
GFS has been pretty consistent about that storm in our general vicinity for quite a few runs now. I'd consider that storm to usher in the base state pattern change if it were to happen.
-

Occasional Thoughts on Climate Change
Typhoon Tip replied to donsutherland1's topic in Climate Change
the partial right amount is precisely = to the amount that is doubted -
Septorcher 2026 Discussion - Endless Summer
powderfreak replied to Damage In Tolland's topic in New England
It’s the size of the squirrel’s nutsack that I thought Jerry found a correlation back in the day… -

Septorcher 2026 Discussion - Endless Summer
forkyfork replied to Damage In Tolland's topic in New England
septorture -
when will you become suicidal? mid january?
-
Septorcher 2026 Discussion - Endless Summer
Typhoon Tip replied to Damage In Tolland's topic in New England
The Euro's dystopian for the MA in that time range. Worthy of a "wow" if it were not for the fact that neither solution will be there on the next run cycle from this range.. -
82 here-waiting for the cooler air this evening!
-
Another year and another September that feels like a continuation of August. Just call it August 41st.
-
Forecast was 87, and it got to 86.4 here. Pretty much nailed it.
-
Nino is notorious for early snow, I'll go Oct 27th
-
The last 3 strong nino/super nino have been bad for us, and its been what 5 years since we hit or went above average. at some point you just have to look at things at face value, its not good, and may very well be very bad.
-

2026 Atlantic Hurricane Season
PhiEaglesfan712 replied to Stormchaserchuck1's topic in Tropical Headquarters
September 17, 1914: A tropical storm made landfall near the Florida-Georgia state border with estimated sustained winds of 70 mph. While it may seem insignificant, this storm is notable for being the only officially-recognized Atlantic tropical cyclone of 1914. -
talk about blowing through forecasted highs. it is awful combo of hot/humid out
-

Septorcher 2026 Discussion - Endless Summer
kdxken replied to Damage In Tolland's topic in New England
My windshield got shelled today. Already have a crack and need to replace it. Maybe I'll wait until the end of the month. - Today
-
Septorcher 2026 Discussion - Endless Summer
Lava Rock replied to Damage In Tolland's topic in New England
Only got 0.20". About what I expected. -
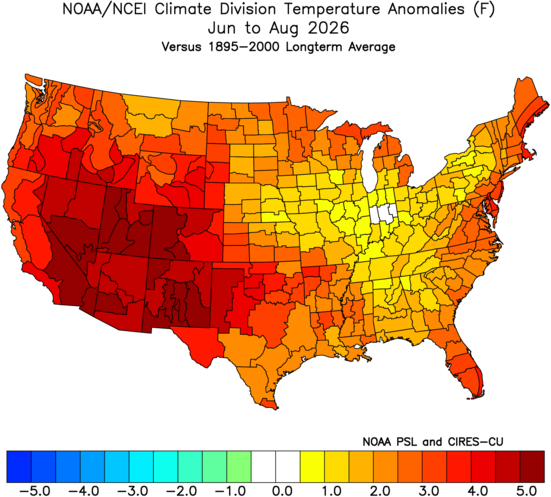
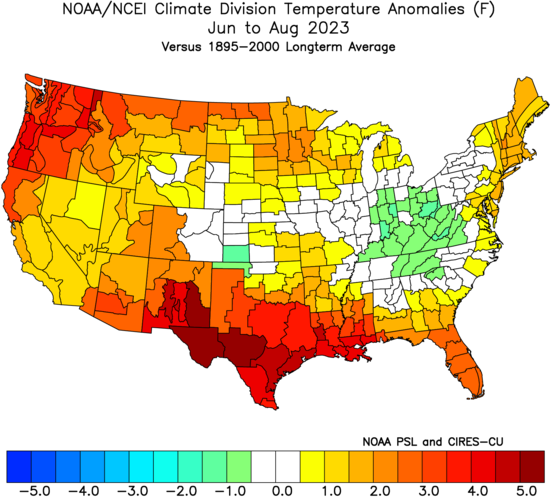
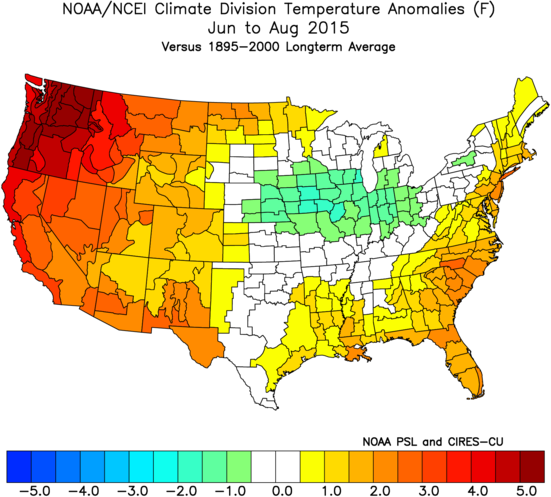
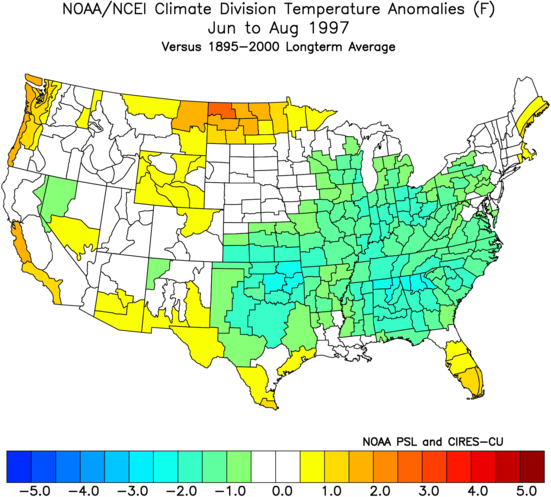
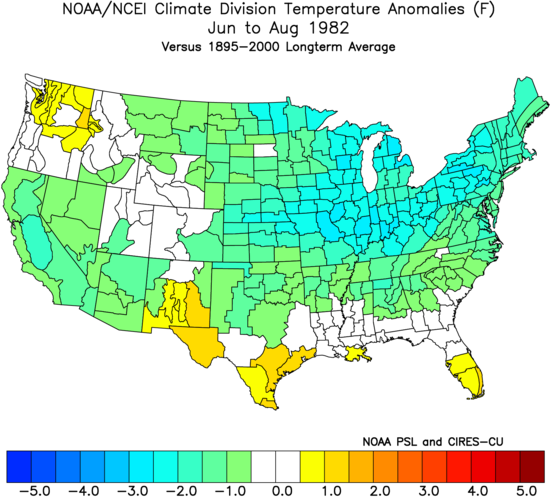
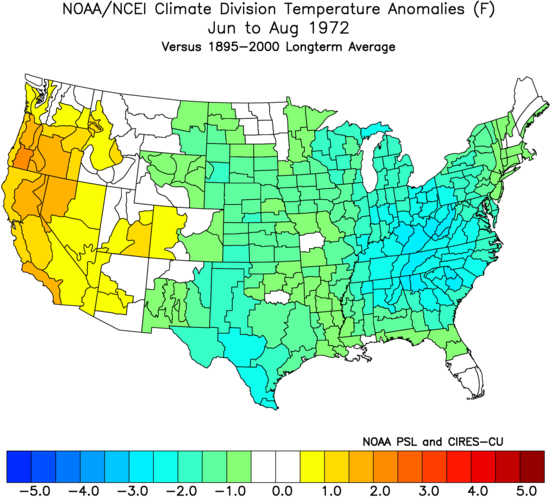
This was our warmest developing super El Niño summer relative to the long term averages. These used to be reliably cooler summers. 2015 was the first one that was warmer but not as warm as this year was.
-
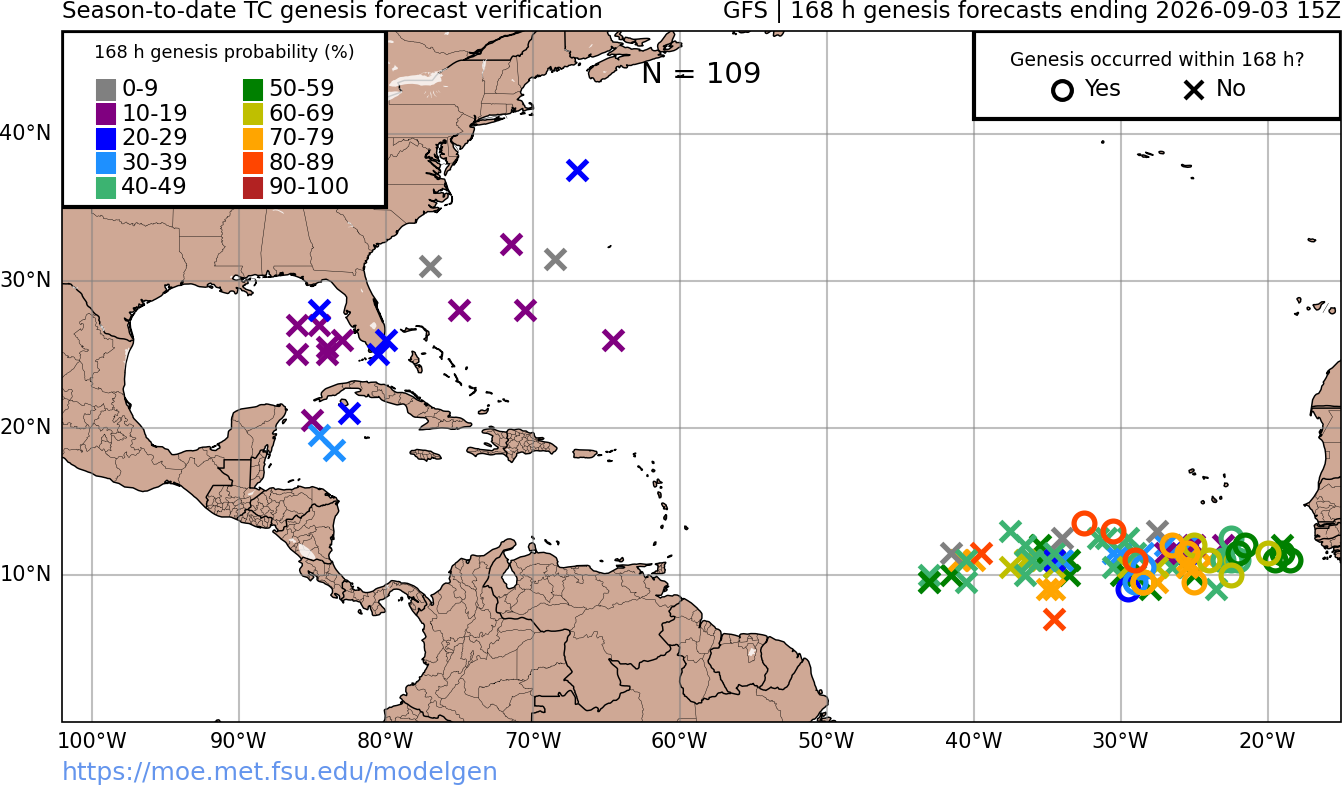
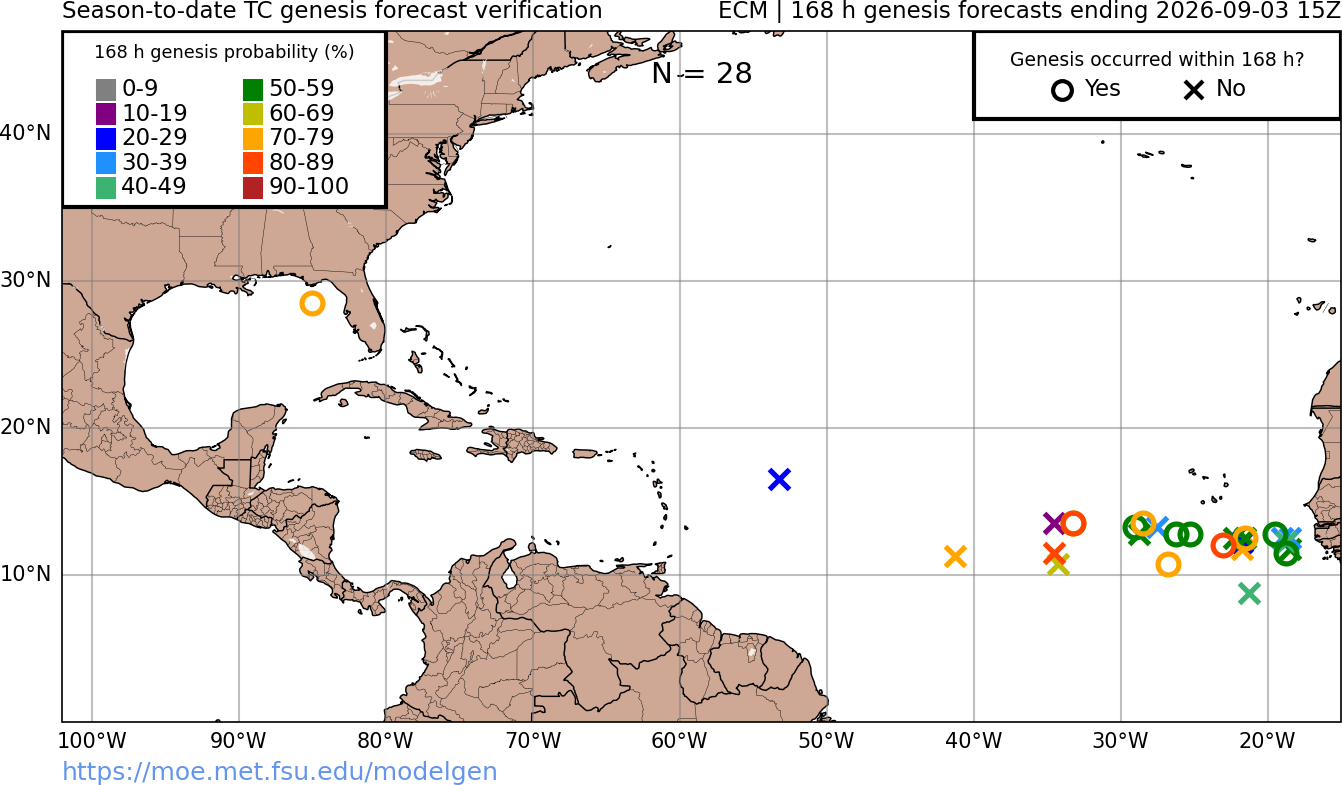
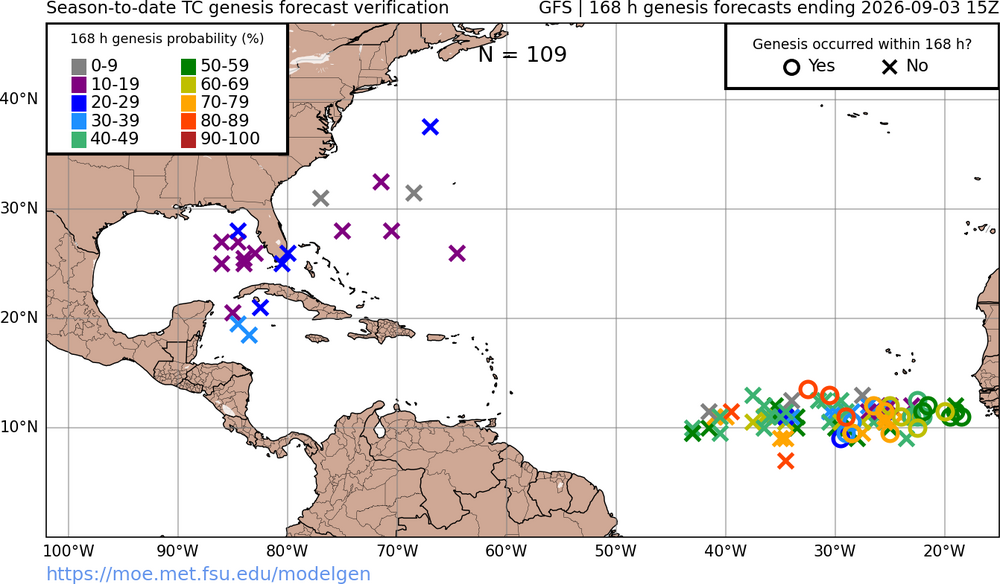
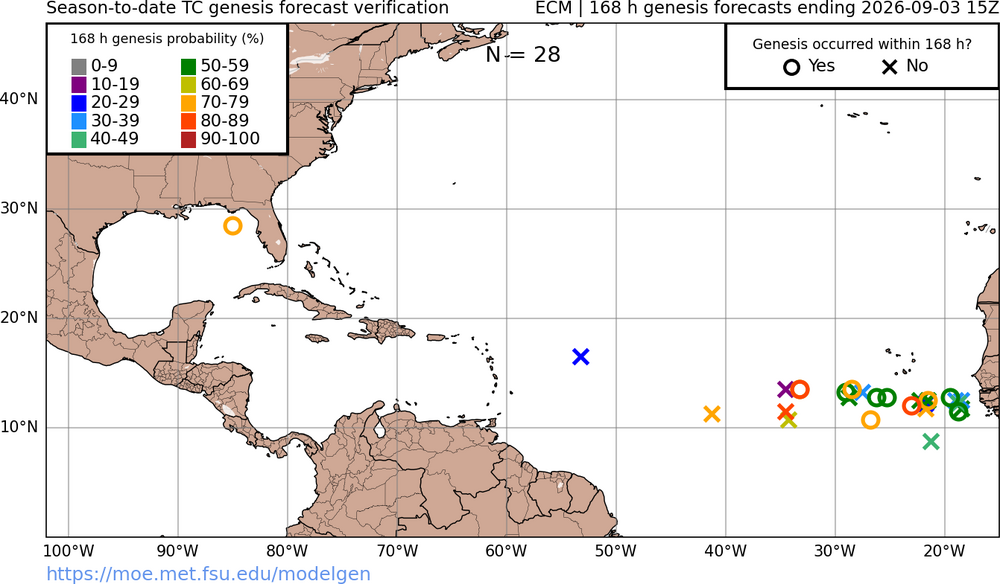
GFS showing a gyre storm developing in the SW Caribbean and blasting north the last few runs wayyy out in fantasy land. But in case you need a reminder in how the GFS has been doing this year: Just for comparison, this is the ECM for this year so far:
-

Septorcher 2026 Discussion - Endless Summer
dendrite replied to Damage In Tolland's topic in New England
CWOP site, but yeah that’s their map display. I saved the settings here for my use, but you can pan/zoom and change the variables to what you want. https://www.weather.gov/wrh/hazards?&zoom=9&scroll_zoom=false¢er=43.329173667843904,-71.68579101562501&boundaries=false,false,false,false,false,false,false,false,false,false,false,false,false&tab=observation&obs=true&obs_type=air_temp&obs_popup=false&obs_density=10&obs_provider=ALL -
of course it was lol
-
Made it to 86 so far
-
i know the nepal flood was at least partially caused by climate change because the usual crowd immediately started saying it wasn't
-
Septorcher 2026 Discussion - Endless Summer
HoarfrostHubb replied to Damage In Tolland's topic in New England
The acorn size around my area is ginourmous. Not a ton of em, but they are bigly -

Central PA Summer 2026 Discussion/Obs Thread
Cgarr737 replied to Voyager's topic in Upstate New York/Pennsylvania
12Z GFS run is interesting.