All Activity
- Past hour
-
This summer reminding me of 2018. Consistently above average temps but no extraordinary heat, no good cold fronts, lake shadow, little rain.
-
Yup. Debris in my front yard from the shit. Fireworks should be banned. If you want to see them go to the town shows. It’s ridiculous.
-
Oh sorry no I mean it moved so slow that was the rate. Lake Travis went up 10’ in 2 hours this am.
-
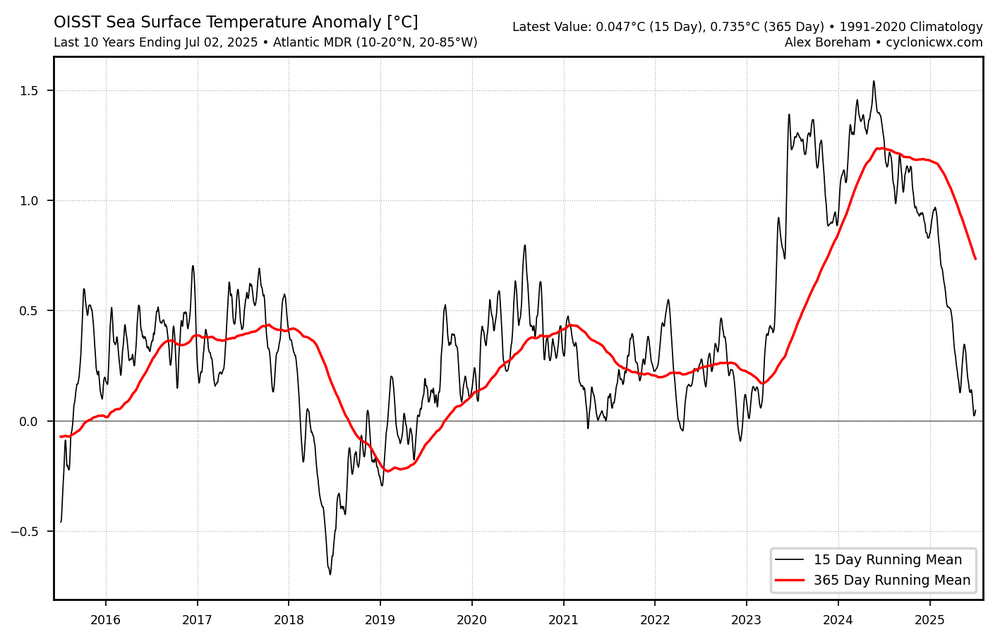
Last 10 yrs: Subtropical Pac: Subtropical ATL: ATL MDR:


-

2025-2026 ENSO
Stormchaserchuck1 replied to 40/70 Benchmark's topic in Weather Forecasting and Discussion
How did it snow 10" in Florida? How did Valentine, Nebraska hit -31F when it was almost March? I was on this board saying that the pattern wasn't good for snow last February and that it wasn't going to snow.. I would dig it up, but there were like 10-15 posts about this in the Mid Atlantic forum. The NAO was south-based positive and there was High pressure in the North Pacific over the North Pacific High position. Plus it takes some time to detox the heavy -PNA/+AO that was the time before. Not a big anomaly. The big anomalies were Dec 2022 and March 2023, but teleconnection patterns aren't 100%, and sometimes other things dominate. Doesn't mean it's always going to be like that. I think we are going back to -NAO cold in the Winter time as Jan 2024 and Jan 2025 had this. The coastal SLP correlation is 5-6x greater in -NAO/+PNA than +NAO/-PNA. I should dig up those old posts... was saying it wasn't a great H5 pattern for snow that 5-7 day models were showing. We didn't have things at our latitude that were favoring cold and snow like a 50/50 low and NE N. Pacific low pressure. bluewave by your posts I would surmise that you are saying NYC is going to average 15"/snow/yr from here on out. No matter, regardless. I don't think that's going to happen... we might have a tough few years with the flux of some things still being unfavorable, but weather patterns wax and wane.. eventually we will enter a better pattern, and the global warming isn't that advanced yet. -
peaked boomped to 50mph
-

July 2025 Discussion-OBS - seasonable summer variability
Sundog replied to wdrag's topic in New York City Metro
I'm working on an extensive post regarding the issue -

July 2025 Discussion-OBS - seasonable summer variability
bluewave replied to wdrag's topic in New York City Metro
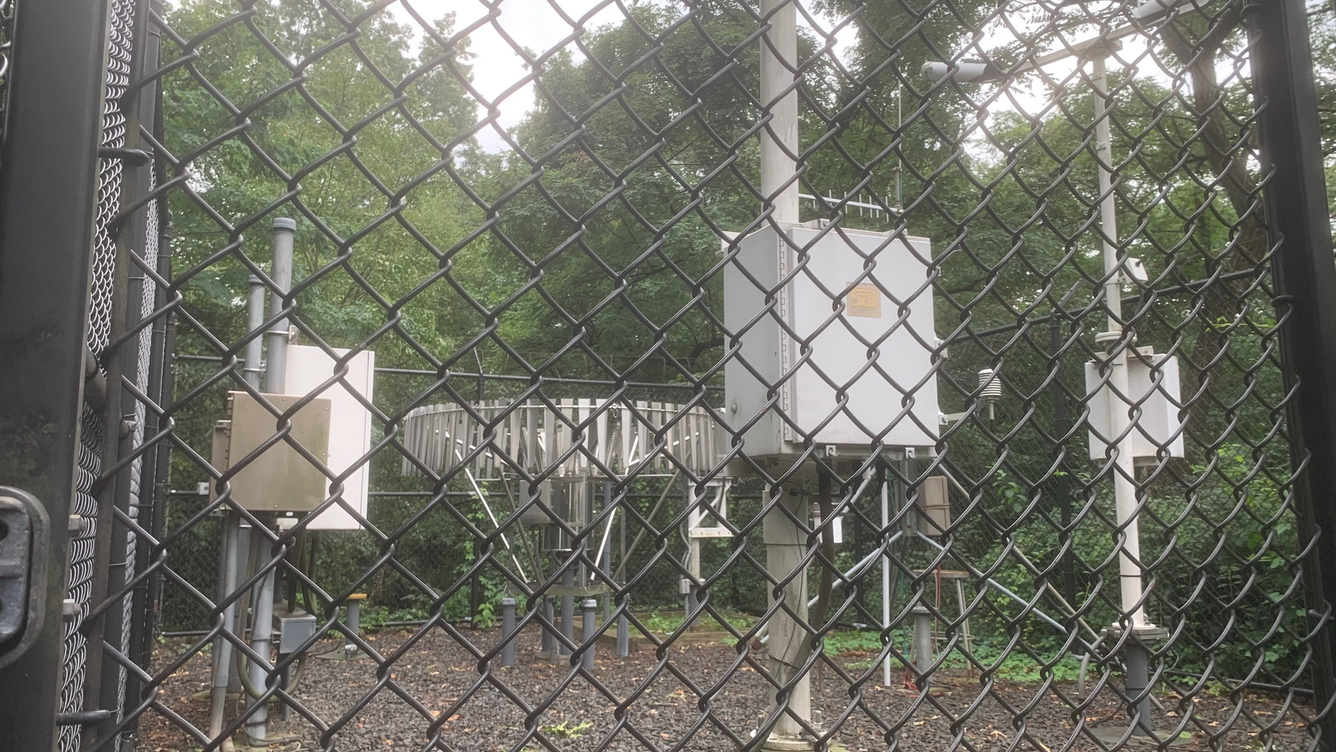
Absolutely. Just compare the old photos of the site from the recent ones. Most of those 100° readings from the 1930s into the early 1990s would have only been mid to upper 90s if the they had the same tree cover back then. The strongest wind gust is still 78 mph set back in December of 1974 when the trees were much lower. So there could have been higher gusts in the interim but the tress could be interfering like with the temperatures.

-

July 2025 Obs/Disco ... possible historic month for heat
weatherwiz replied to Typhoon Tip's topic in New England
I would but I’d be lying -
Tropical Storm Chantal Intermediate Advisory Number 4A NWS National Hurricane Center Miami FL AL032025 200 PM EDT Sat Jul 05 2025 ...CHANTAL STRENGTHENS... ...TROPICAL STORM CONDITIONS EXPECTED TO BEGIN IN THE WARNING AREA THIS EVENING... SUMMARY OF 200 PM EDT...1800 UTC...INFORMATION ---------------------------------------------- LOCATION...31.6N 78.7W ABOUT 105 MI...175 KM SE OF CHARLESTON SOUTH CAROLINA ABOUT 185 MI...300 KM SSW OF WILMINGTON NORTH CAROLINA MAXIMUM SUSTAINED WINDS...45 MPH...75 KM/H PRESENT MOVEMENT...N OR 360 DEGREES AT 3 MPH...6 KM/H MINIMUM CENTRAL PRESSURE...1006 MB...29.71 INCHES
-
As I have pointed out, you are putting way too much stock in what the teleconnections have been to the north of the subtropics. No combination of WPO, EPO, PNA, AO, or NAO is going to produce a cold and snowy outcome along the I-95 corridor in the Northeast provided that the winter subtropical ridge remains so robust. We need a weaker Southeast Ridge/ Western Atlantic Ridge along with a much slower Pacific Jet. This is why even the -WPO, -EPO, +PNA, and record -AO -NAO block last February still produced a cutter with record snows in Toronto and Montreal with a rainstorm along the coast. The -5 sigma Greenland block linked up with the Southeast Ridge when in the past there would have been a deep trough underneath and a benchmark I-95 blizzard. The issue is the fast Pacific flow and robust subtropical ridges from Japan to Western Europe. So these ridges to the south joining with the ridges associated with the -WPO, -EPO, +PNA, -AO, and -NAO don’t leave any room for cold trough development under the ridges.
- Today
-
You’re saying it averaged 10” of rain for those 8 hours? 80 inches?
-

July 2025 Discussion-OBS - seasonable summer variability
Brian5671 replied to wdrag's topic in New York City Metro
streak looks to finally end here-we've gone since 3/22 without a rainfree weekend...granted a few were .01 or .05 -

July 2025 Discussion-OBS - seasonable summer variability
FPizz replied to wdrag's topic in New York City Metro
Shocked no one has brought up the central park sensor yet on page 13 of this thread. Doh! -
Just had a 2 min period of large drop sprinkles. Top 5 event of the summer so far.
-

July 2025 Obs/Disco ... possible historic month for heat
Great Snow 1717 replied to Typhoon Tip's topic in New England
Tell me that ain't you... -
That’s crazy .
-
Afternoon update from the WPC ramps up the rainfall along the East Coast WPC snippet Showers and thunderstorms are expected to be focused in proximity to progressive cold fronts, stalled boundaries and round the upper high in the Southern Rockies. The wavy front into the eastern U.S. may be a focus for heavier rain and thunderstorms. This includes areas from the Corn Belt into the Midwest and Ohio Valley, Appalachians, Mid-Atlantic, and Northeast.
.gif.af989ef0fca2e264259ac2fc187e45fb.gif)
-

July 2025 Discussion-OBS - seasonable summer variability
Roger Smith replied to wdrag's topic in New York City Metro
In terms of when does the hottest 31 day interval occur, this is the frequency of these intervals (* symbol means interval is matched by a later one, usually the next day is its starting point but differentials are noted of up to five days for 1899 (intervals starting July 2 and 7) and six days for 2010 (June 27 and July 3 start these)). Since this list includes the cooler half of the entries, we do find a few overlapping a calendar month. (June can only be 'all in' for May 31 to June 30 or June 1 to July 1, the first of those exists in the data for 1925). dur'n hottest 31d ___ Years include May 31 - Jun 30 __ 1925 Jun 5 - Jul 5 _____ 1984 Jun 7 - Jul 7 _____ 1883 Jun 8 - Jul 8 _____ 1888, 2004 Jun 11 - Jul 11 ____ 1945 Jun 14 - Jul 14 ___ 1994 Jun 15 - Jul 15 ___ 1962, 1976 Jun 16 - Jul 16 ___ 2000 Jun 17 - Jul 17 ___ 1912 Jun 18 - Jul 18 ___ 1869, 1872, 1880, 1971 Jun 19 - Jul 19 ___ 1965* 1997 Jun 20 - Jul 20 __ 1904, 1907* 1908 1909, 1923* 1953 1964 1966 Jun 21 - Jul 21 ___ 1874, 1934*, Jun 22 - Jul 22 __ 1946, 2017 Jun 23 - Jul 23 __ 1876, 1897, 2003, 2013 Jun 24 - Jul 24 __ 1875, 1898, 1901, 1922, 1952, 1991 Jun 25 - Jul 25 __ 1900, 1906, 2014 Jun 26 - Jul 26 __ 1878, 1889 Jun 27 - Jul 27 __ 2010* 2012* 2021 Jun 28 - Jul 28 __ 1881, 1910, 2018 Jun 29 - Jul 29 __ 1948, 2023 Jun 30 - Jul 30 __ 1887, 1903, 1913 July 1-31 _________ 1919, 1950 July 2 - Aug 1 ____ 1899* 1911, 1921, 1951, 1974, 2019, 2020 July 3 - Aug 2 ___ 1886, 1999 July 4 - Aug 3 ___ 1929, 1942, 1957, 2011 July 5 - Aug 4 ___ 1936, 1937, 1986, 1993, July 6 - Aug 5 ___ 1885, 1890*, 1928, 1934, 1982 July 7 - Aug 6 ___ 1879* 1899, 1981, 1989 July 8 - Aug 7 ___ 1905, 1955, 1967, 1992, 2008 July 9 - Aug 8 ___ 1954, 1960, 1987, 2007 July 10 - Aug 9 __ 1882, 1894, 1932, 1941, 1972 July 11 - Aug 10 __ 1870, 1924, 1927, 1930, 1931, 1943, 1968* 1979, 1983, 2006 July 12 - Aug 11 __ 1873, 1892, 1902, 2022 July 13 - Aug 12 __ 1893, 1896, 1917*, 1949, 1963, 1977, 1995, 1998 July 14 - Aug 13 __ 1980 July 15 - Aug 14 __ 1877, 1918, 1940, 2005 July 16 - Aug 15 __ 1926, 1975, 1985, 1988, 2016 July 17 - Aug 16 __ 1895 July 18 - Aug 17 __ 1990 July 19 - Aug 18 __ 1920, 2015 July 20 - Aug 19 __ 2002* July 22 - Aug 21 __ 1937, 1944 July 23 - Aug 22 __ 1958, 1970 July 24 - Aug 23 __1939 July 25 - Aug 24 __1938 July 27 - Aug 26 __1947, 2009 July 29 - Aug 28 _ 1891 July 30 - Aug 29 _ 1871 July 31 - Aug 30 __2001 Aug 3 - Sep 2 ____ 1969 Aug 5 - Sep 4 ____ 1973 Aug 6 - Sep 5 ____ 1996 Aug 7 - Sep 6 ____ 1914, 1956, 1961 Aug 8 - Sep 7 ____ 1978 Aug 10 - Sep 9 ___ 1959 Aug 13 - Sep 12 __ 1884 (Aug 21 - Sep 20 1948 a secondary peak) __________________ From the above it is clear that a large cluster of years are hottest from early July to early August. In 1991 intervals starting May 3 - June 2 averaged maximum of 80.0 + (this persisted to Aug 27 to Sep 26), the second earliest start for the 80+ season was 1962 (May 11 to Jun 10) but that summer ended a lot earlier as Aug 5 to Sep 4 was the last 80+ interval. The latest interval to average 80.0 or above was Sep 9 to Oct 8 1931, followed by Sep 7 to Oct 6, 1941 tied by 2005, then Sep 5 to Oct 5 1881. and tied fifth latest 1959, 1961 Sep 3 to Oct 2, then 1921 with Sep 2 to Oct 1. .. 2017 had 79.00 as late as Sep 11 to Oct 11. 1895 began its 80+ season with May 21 to Jun 21, and ran to Aug 30-Sep 29 but there were late-summer gaps, no interval starting Aug 17 to 21 averaged 80+. . -

July 2025 Obs/Disco ... possible historic month for heat
dendrite replied to Typhoon Tip's topic in New England
OWDGW Time to blow the cobwebs out
-
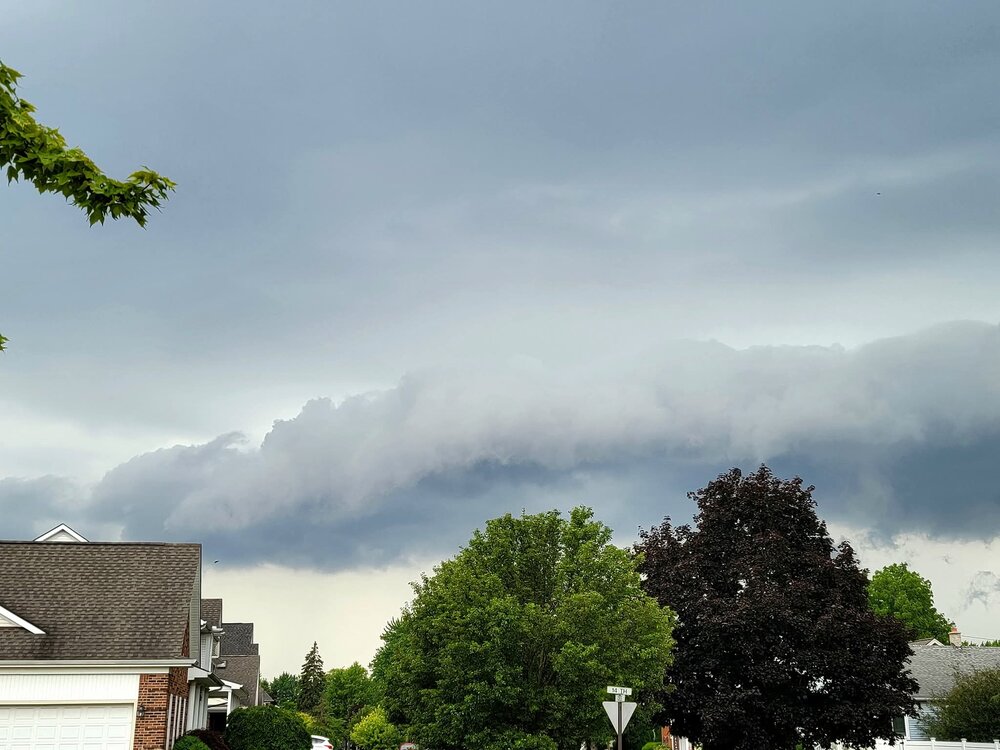
Had a rogue storm yesterday. 0.41" fell here. Forecast for the 4th was sunny all week until yesterday morning. This was a slow mover (ann Arbor to DTW corridor) but the only storm in the entire area.
-

July 2025 Discussion-OBS - seasonable summer variability
steve392 replied to wdrag's topic in New York City Metro
Outside of Friday, will this be the first Saturday AND Sunday that it hasn't rained in months??? -

2025-2026 ENSO
40/70 Benchmark replied to 40/70 Benchmark's topic in Weather Forecasting and Discussion
I wouldn't hold your breath on that with the +WPO/-PNA expectation. -

July 2025 Obs/Disco ... possible historic month for heat
mreaves replied to Typhoon Tip's topic in New England
Anti-spider kit -
You can see the rotation in the base velocity data. A buoy east of Charleston (Buoy-41066) has 33 mph gusting to 47mph from the east. (recently decreased gusts to 40mph)