All Activity
- Past hour
-
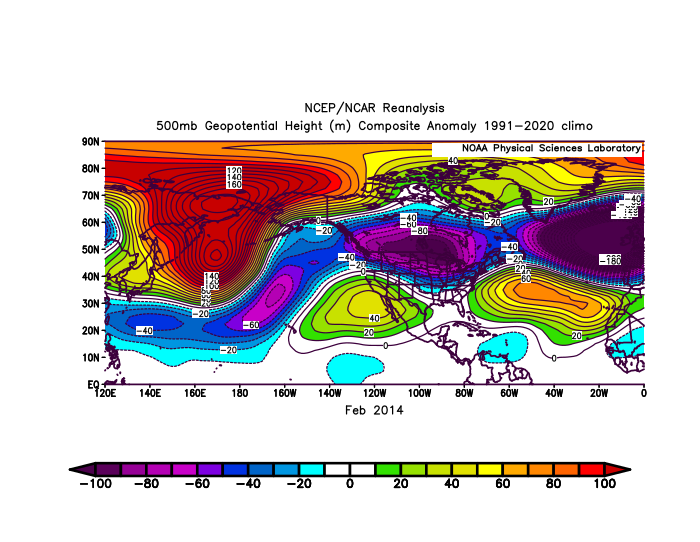
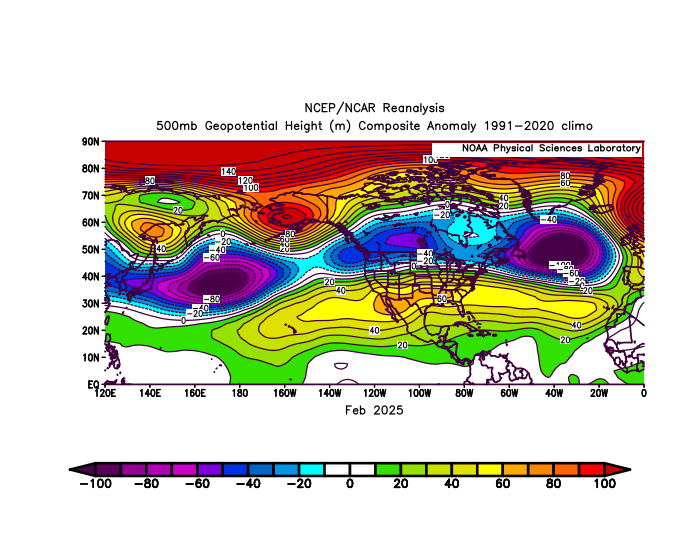
Last February would have been a much better pattern for the area around NYC if this mid-latitude ridge from Hawaii to Bermuda wasn’t so overpowering. It muted the -EPO -WPO and Greenland block influence. Back in February 2014 the -WPO-EPO and Greenland block was able to dominate so it was much snowier around NYC. This is why February 2025 had the first -5 AO and -5 SD Greenland block cutter that gave record snows to Toronto and Montreal instead of around NYC Metro.
-
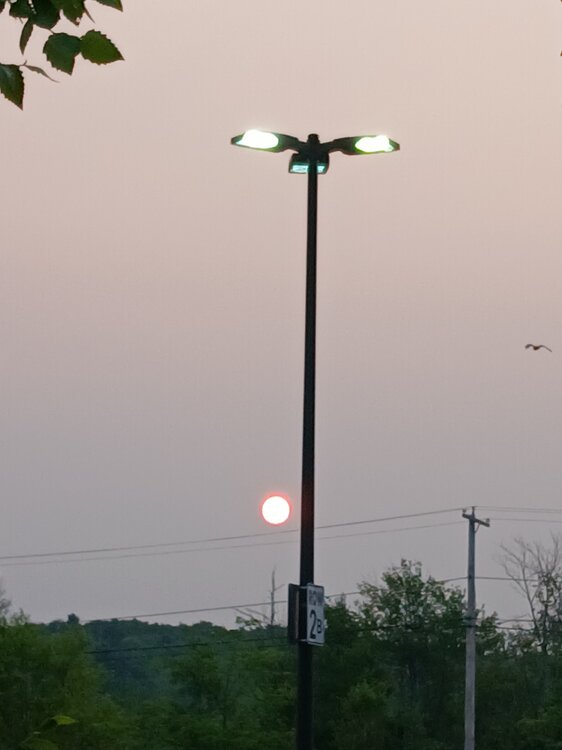
It’s a little hazy here, but most of it seems aloft right now.
-
Record high min at TRI yesterday. One thing I have noticed is that the point-and-click forecasts have been way too high all summer(at range) for MBY. I had mid-upper 90s forecast for much of last week(early and middle). If I remember correctly, 93 was as high as it got. The Apple wx app has been more accurate.
-

2025-2026 ENSO
Stormchaserchuck1 replied to 40/70 Benchmark's topic in Weather Forecasting and Discussion
A 90N ridge will create a trough most likely around 45N. Sometimes a stronger relative trough will happen at 45-50N, and on the east or west side of that there will be mid-latitude ridging. That's what happened in February. the North Atlantic trough under a 90N ridge (Atlantic trough at 45-50N) was -300dm, and for latitude/height, a greater anomaly. I get that the Pacific pattern looks more independent of the +AO, but it does correlate to -PNA -
I wouldn’t say the +AO is driving it since the ridge in the North Pacific beneath the -EPO and ridge north of Alaska is even stronger than the one we just had under the +AO in the Northeast. We have seen the ridge in the Northeast with the record -5 AO back in February. So while the higher latitude teleconnections shift around, this mid-latitude ridge has been the one constant.
-
2025-2026 ENSO
Stormchaserchuck1 replied to 40/70 Benchmark's topic in Weather Forecasting and Discussion
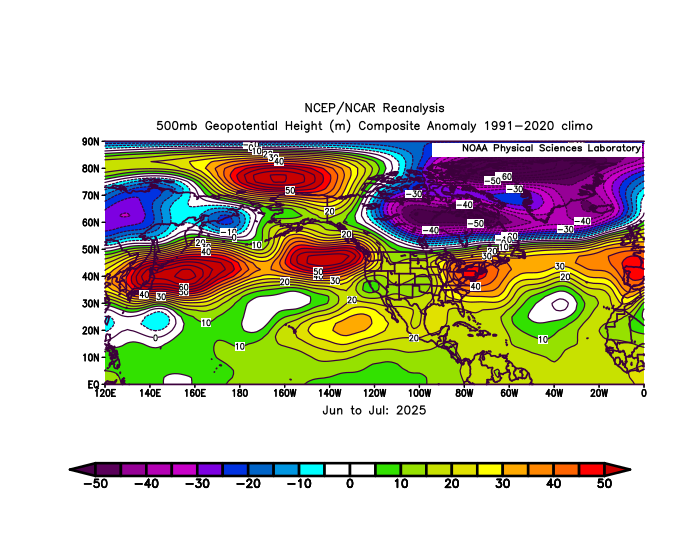
^Negative anomaly max is almost greater in that image! Why not say "The +AO is at least partially driving it"? The +AO that has appeared much more frequent after the major solar flares staring in May 2024. That's a big negative anomaly on your map, bluewave. Relatively though the ridge near Japan is probably 1.4x greater. -
59/56
-
I got a golf tournament Tuesday-Thursday in Keene. Will I even be able to see my golf ball?
-
Low of 57. Beautiful sunrise.
-
Boston -7.1F for the 3 days. That ain't going to last.
-
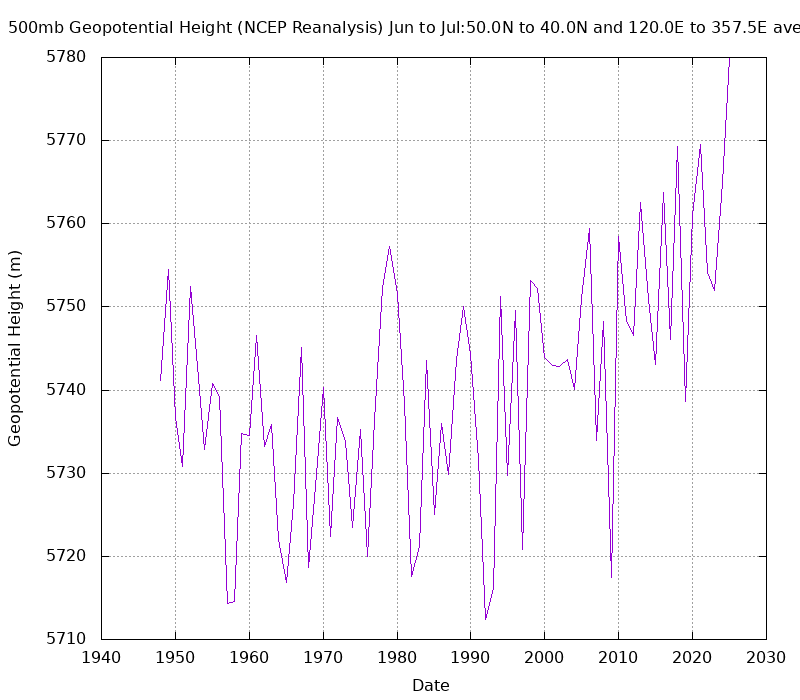
Whatever we decide to call it, this June and July featured the strongest continuous 40N mid-latitude ridge from Japan across the U.S. and North Atlantic to Europe that we have seen before. It’s what’s ultimately driving these record -PDO values and record warmth around the Northeast this summer. This ridge has been much stronger than we have ever seen from past La Ninas or -PDO patterns.
- Today
-
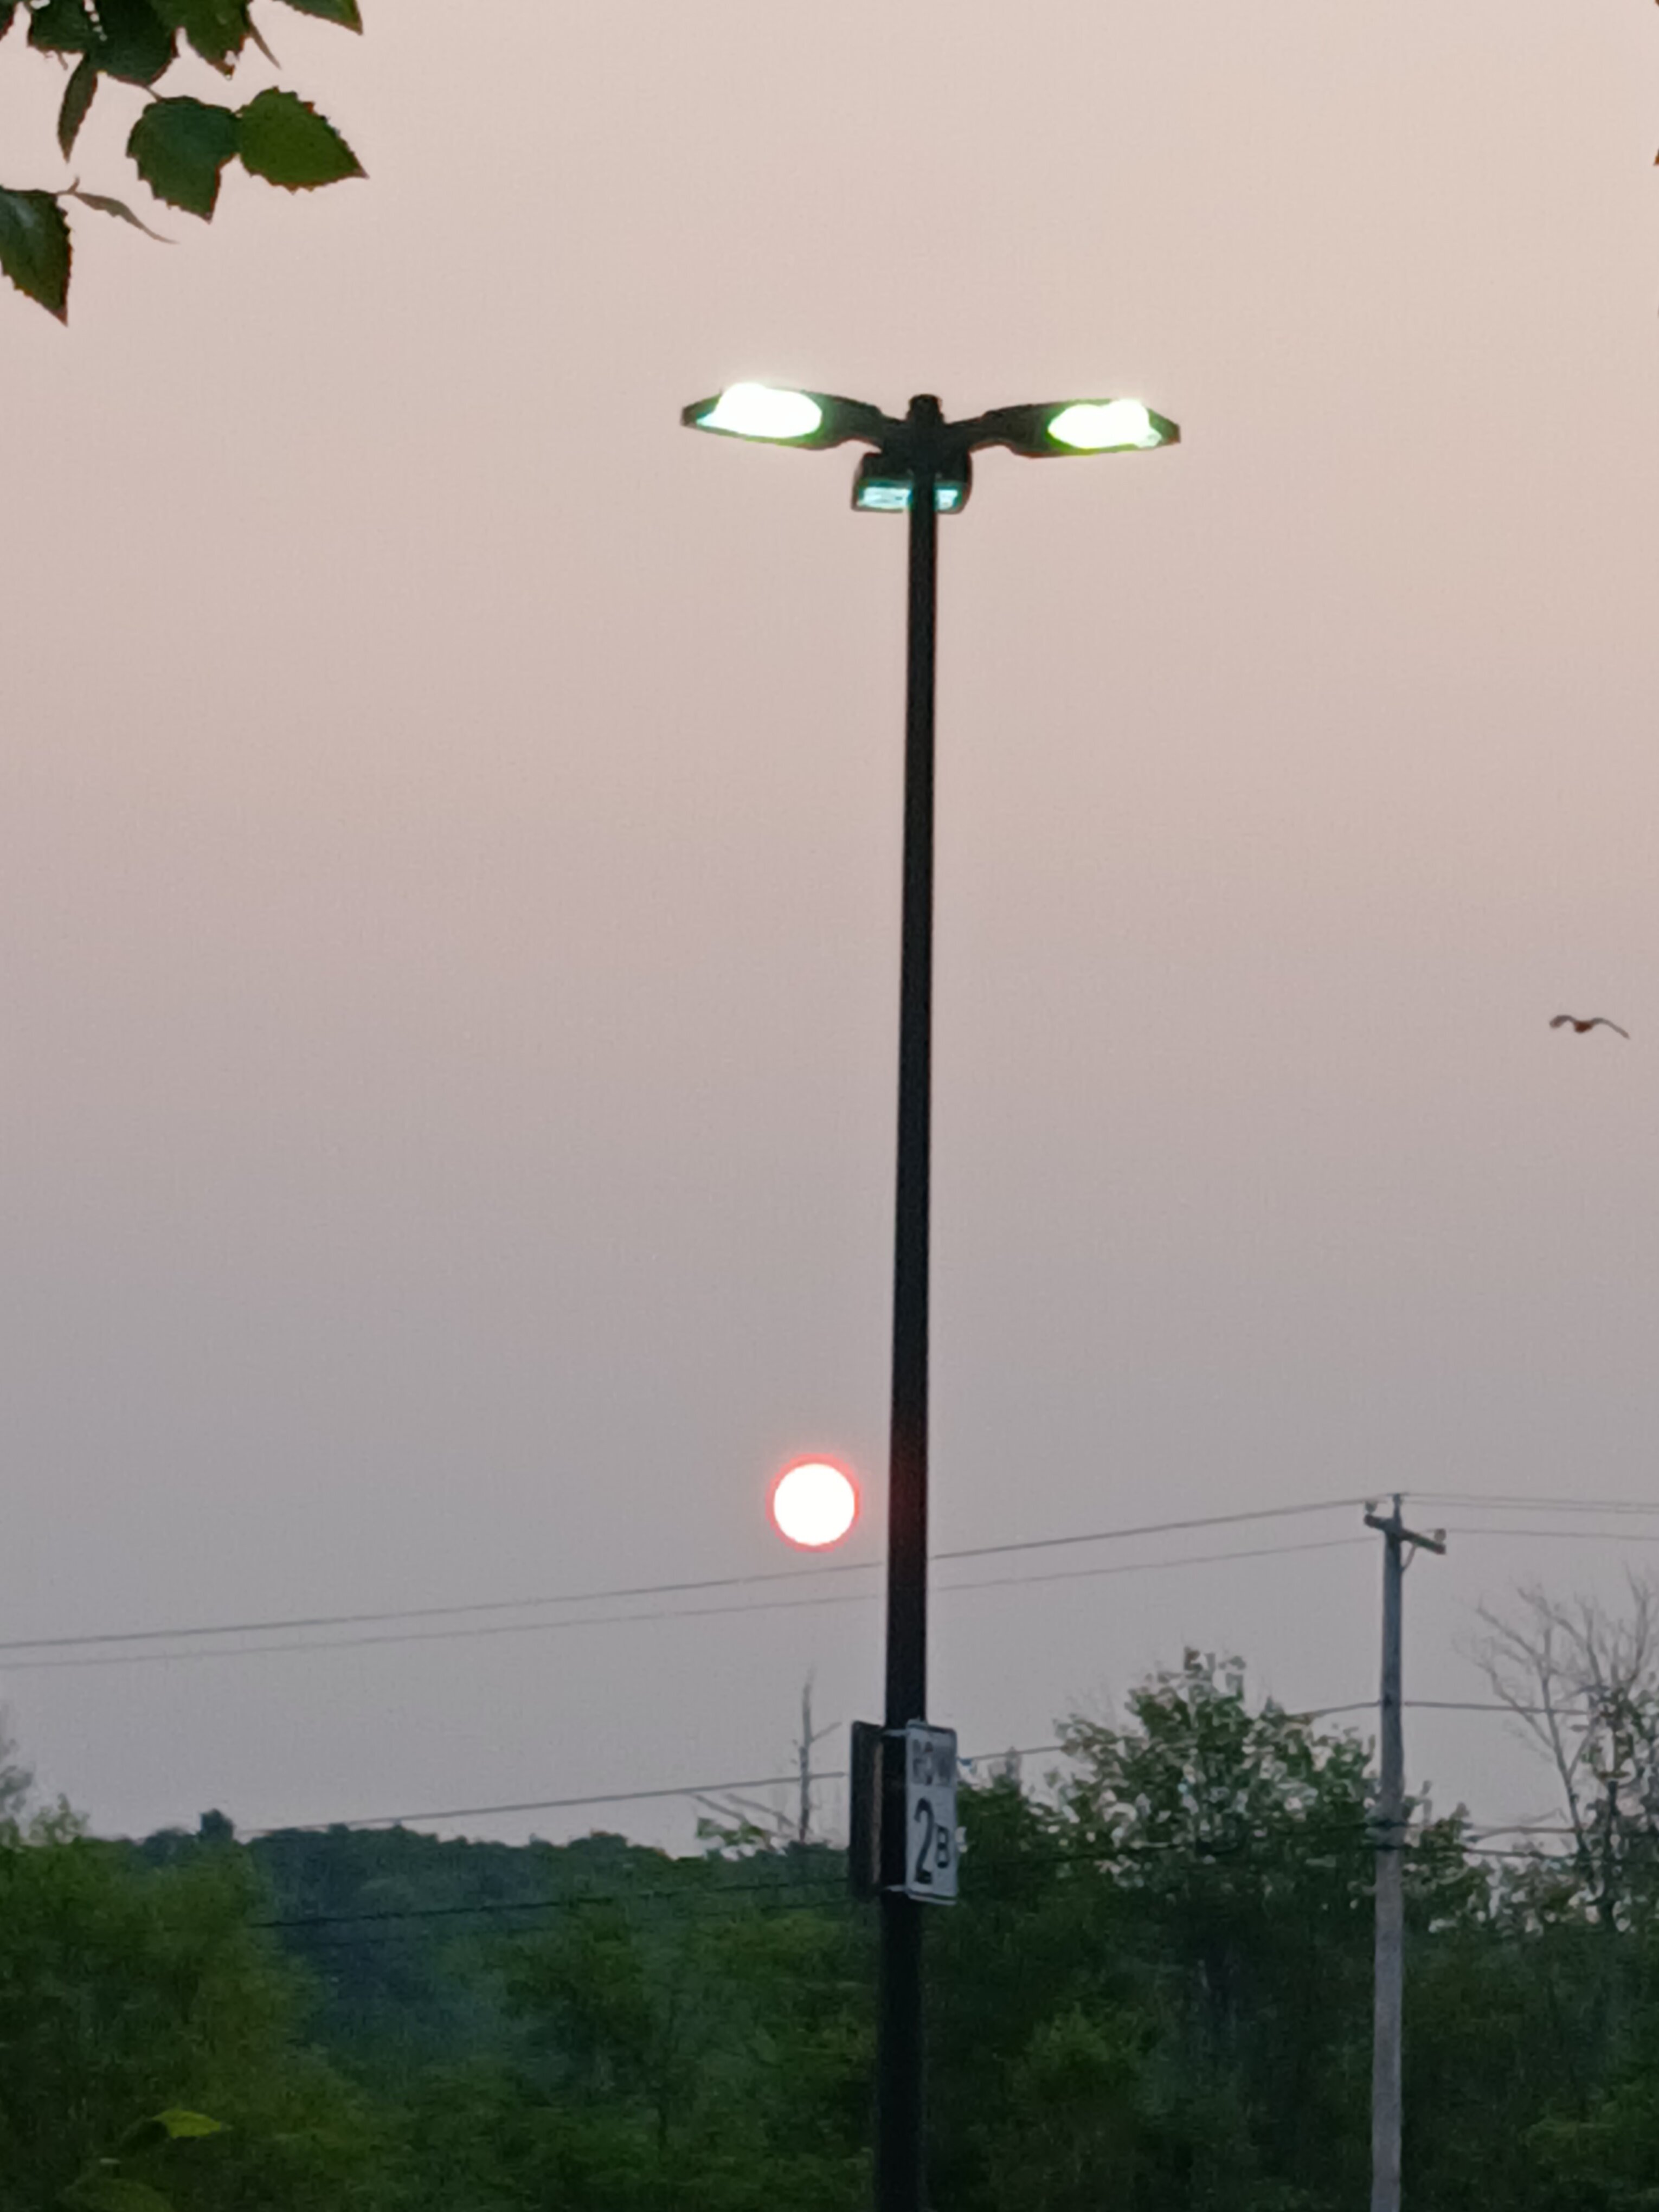
Just pulled in a parking lit to take a quick pic.. lots of smoke again today!
-
I think 2 things are blatantly obvious at this point…1) We are going to have a -ENSO winter, very likely weak La Niña regardless of what the “official” ONI number says 2) We are going to have a solidly (very possibly strong) -PDO winter….
-
Just wait till you see the sun this morning.
-
 It was only the 2nd 80° behind 2010. But it felt warmer this time around since the dewpoints were so much higher. The average max finished just behind 2010. Time Series Summary for JFK INTERNATIONAL AIRPORT, NY June 21st through July 31th AVG Temp Click column heading to sort ascending, click again to sort descending. 1 2010-07-31 80.7 0 2 2025-07-31 80.0 0 3 2020-07-31 78.5 0 4 2013-07-31 78.4 0 - 2011-07-31 78.4 0 5 2012-07-31 78.2 0 6 2019-07-31 78.1 0 - 1949-07-31 78.1 0 7 2016-07-31 78.0 0 8 2024-07-31 77.6 0 - 2015-07-31 77.6 0 - 2002-07-31 77.6 0 9 1993-07-31 77.5 0 10 2022-07-31 77.4 0 - 1999-07-31 77.4 0 - 1983-07-31 77.4 Time Series Summary for JFK INTERNATIONAL AIRPORT, NY June 21st Through July 31st Max AVG Temp Click column heading to sort ascending, click again to sort descending. 1 2010-07-31 89.2 0 2 2025-07-31 87.6 0 3 2011-07-31 86.5 0 4 2019-07-31 86.3 0 - 1966-07-31 86.3 0 5 2012-07-31 86.1 0 - 1963-07-31 86.1 0 - 1949-07-31 86.1 0 6 2020-07-31 86.0 0 7 2002-07-31 85.9 0 8 2013-07-31 85.6 0 9 1993-07-31 85.5 0 10 2016-07-31 85.3 0 - 1983-07-31 85.3 0
 -
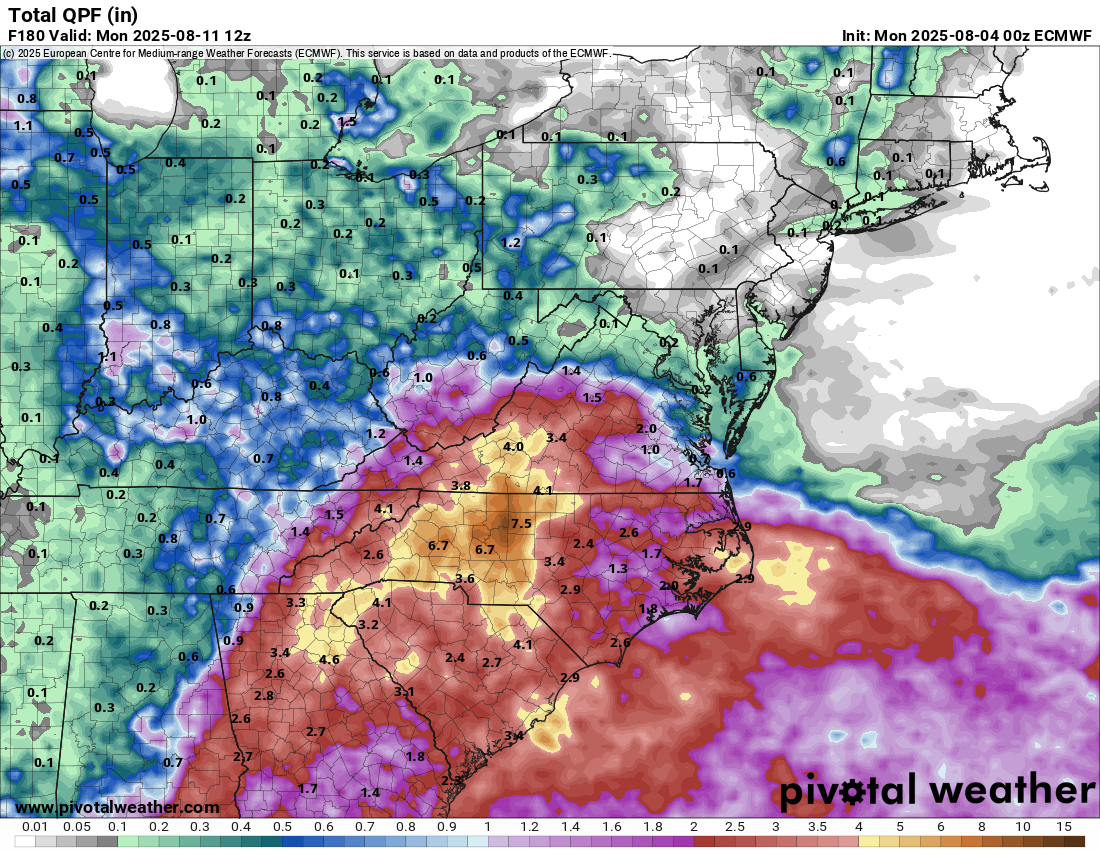
The next week looks wet, quite a big of variability on just how wet
.thumb.png.0d009d29cbe71b026fa103e6fe928533.png)

-
Sizzler

-
Currently 59 imby. 37 at Canaan NWR.
-
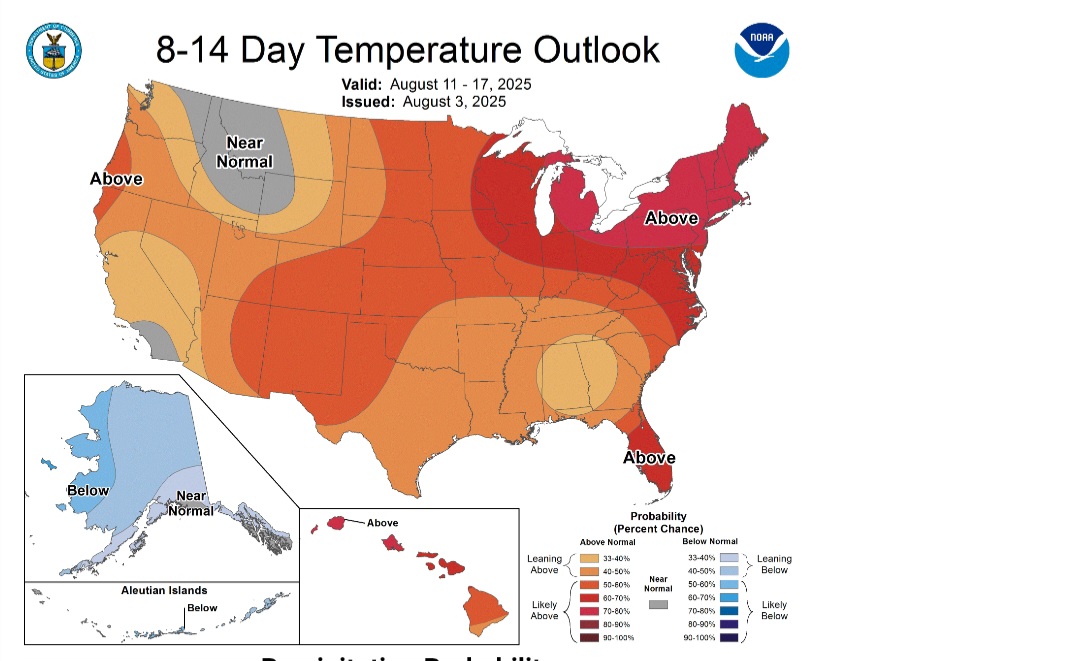
after this week it looks like we get hot for 8 to 10 days or so..
-

SE Area of Interest--0% two day, 30% five day odds
GaWx replied to WxWatcher007's topic in Tropical Headquarters
Upped from 20% to 30%: 2. Off the Southeastern United States: A broad area of low pressure is forecast to form in a couple of days a few hundred miles off the coast of the southeastern United States. Some gradual development of this system is possible during the middle or latter part of the week as the system drifts to the west or northwest. * Formation chance through 48 hours...low...near 0 percent. * Formation chance through 7 days...low...30 percent. -
Upped from 40% to 50%: Tropical Weather Outlook NWS National Hurricane Center Miami FL 200 AM EDT Mon Aug 4 2025 For the North Atlantic...Caribbean Sea and the Gulf of America: Active Systems: The National Hurricane Center is issuing advisories on newly formed Tropical Storm Dexter, located over the western Atlantic Ocean. 1. Central Tropical Atlantic: A tropical wave is forecast to move off the west coast of Africa later today. Thereafter, some gradual development of the wave is possible, and a tropical depression could form late this week while it moves generally west-northwestward across the central tropical Atlantic. * Formation chance through 48 hours...low...near 0 percent. * Formation chance through 7 days...medium...50 percent.
-
We’re getting pretty heavy rains at 1AM (8/4) from an area moving only slowly NW. Hopefully, the heavy doesn’t last too long. Edit: It’s not yet letting up at almost 1:30. And this was released at 1AM, a repeat of Saturday: Z.000000T0000Z.000000T0000Z.OO/ CHATHAM GA- 101 AM EDT MON AUG 4 2025 ..FLOOD ADVISORY IN EFFECT UNTIL 3 AM EDT EARLY THIS MORNING * WHAT...FLOODING CAUSED BY EXCESSIVE RAINFALL IS EXPECTED. * WHERE...A PORTION OF SOUTHEAST GEORGIA, INCLUDING THE FOLLOWING COUNTY, CHATHAM. * WHEN...UNTIL 300 AM EDT. * IMPACTS...MINOR FLOODING IN LOW-LYING AND POOR DRAINAGE AREAS. WATER OVER ROADWAYS. OVERFLOWING POOR DRAINAGE AREAS. PONDING OF WATER IN URBAN OR OTHER AREAS IS OCCURRING OR IS IMMINENT. * ADDITIONAL DETAILS... - AT 100 AM EDT, DOPPLER RADAR INDICATED HEAVY RAIN EXTENDING FROM SILK HOPE AND HUNTER ARMY AIRFIELD TO RIO VISTA. A QUICK 1 TO 2.5 INCHES OF RAIN COULD FALL THROUGH 3 AM, RESULTING IN URBAN FLOODING. - SOME LOCATIONS THAT WILL EXPERIENCE FLOODING INCLUDE... POOLER, MIDTOWN SAVANNAH, WINDSOR FOREST, HUNTER ARMY AIRFIELD, COFFEE BLUFF, DOWNTOWN SAVANNAH, HUTCHINSON ISLAND, WILMINGTON ISLAND, I-16/I-95 INTERCHANGE AND MONTGOMERY.
-
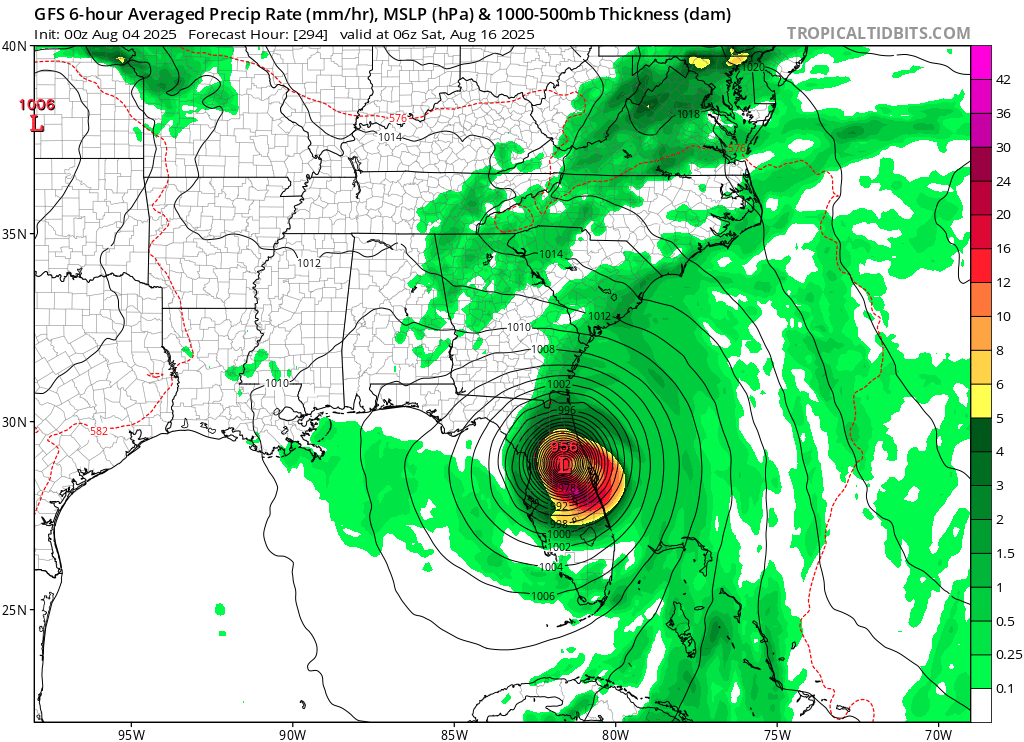
Another Florida hit on gfs

-
 Plenty of people who don’t fish use their boats. Coming from someone at the marina every week…also no sailboaters fish and they are out a lot as well. what keeps people from using their boats is kids sports and bad weather. That’s about it
 -
71 for the high today with around .39 inches of rain. The rest of the week looks pretty good too.


.png.e6ab1b6c28862b9171fe97821b1488e9.png)