All Activity
- Past hour
-
Hello there stranger, I thought you quit the board.
-
E PA/NJ/DE Summer 2025 Obs/Discussion
JTA66 replied to Hurricane Agnes's topic in Philadelphia Region
The street is wet. Don't know if it's from a passing shower or if it's sweating from the 77F DP. -

July 2025 Discussion-OBS - seasonable summer variability
uofmiami replied to wdrag's topic in New York City Metro
You should have been in Paris & Corsica with the heat wave over there. Paris was oven last Monday & Tuesday with their version of A/C when I was there. At least in Corsica you were able to cool off in the water. -
Closing in on 2" on Cambridge mesonet site.
-
22-23 was a little lower for snowfall around NYC than 01-02. But 01-02 remains a little warmer. If the 01-02 snowfall and temperature departures occurred again in this much warmer climate, then NYC would probably finish up with only around 1” or less of snow and a winter average temperature close to 43.0°. Time Series Summary for NY CITY CENTRAL PARK, NY - Oct through Sep Top 10 lowest snowfall seasons Click column heading to sort ascending, click again to sort descending. 1 2022-2023 2.3 0 2 1972-1973 2.8 0 3 2001-2002 3.5 0 4 1918-1919 3.8 0 5 2019-2020 4.8 0 6 1931-1932 5.3 0 7 1997-1998 5.5 0 8 2011-2012 7.4 0 9 2023-2024 7.5 0 10 1988-1989 8.1 0 - 1877-1878 8.1 0 Time Series Summary for NY CITY CENTRAL PARK, NY Top 10 Warmest Winters Click column heading to sort ascending, click again to sort descending. 1 2001-2002 41.5 0 2 2022-2023 41.0 0 - 2015-2016 41.0 0 3 2023-2024 40.6 0 4 2011-2012 40.5 0 5 1931-1932 40.1 0 6 1997-1998 39.6 0 7 2016-2017 39.3 0 8 2019-2020 39.2 0 9 1990-1991 39.1 0 10 1998-1999 38.6 0
-

July 2025 Discussion-OBS - seasonable summer variability
Brian5671 replied to wdrag's topic in New York City Metro
I'm assuming you can go for cheap this time of year-has to be a bit of the offseason there? -

E PA/NJ/DE Summer 2025 Obs/Discussion
RedSky replied to Hurricane Agnes's topic in Philadelphia Region
.10" from a morning shower Looks like we can expect somewhere between .10" to 3" today -

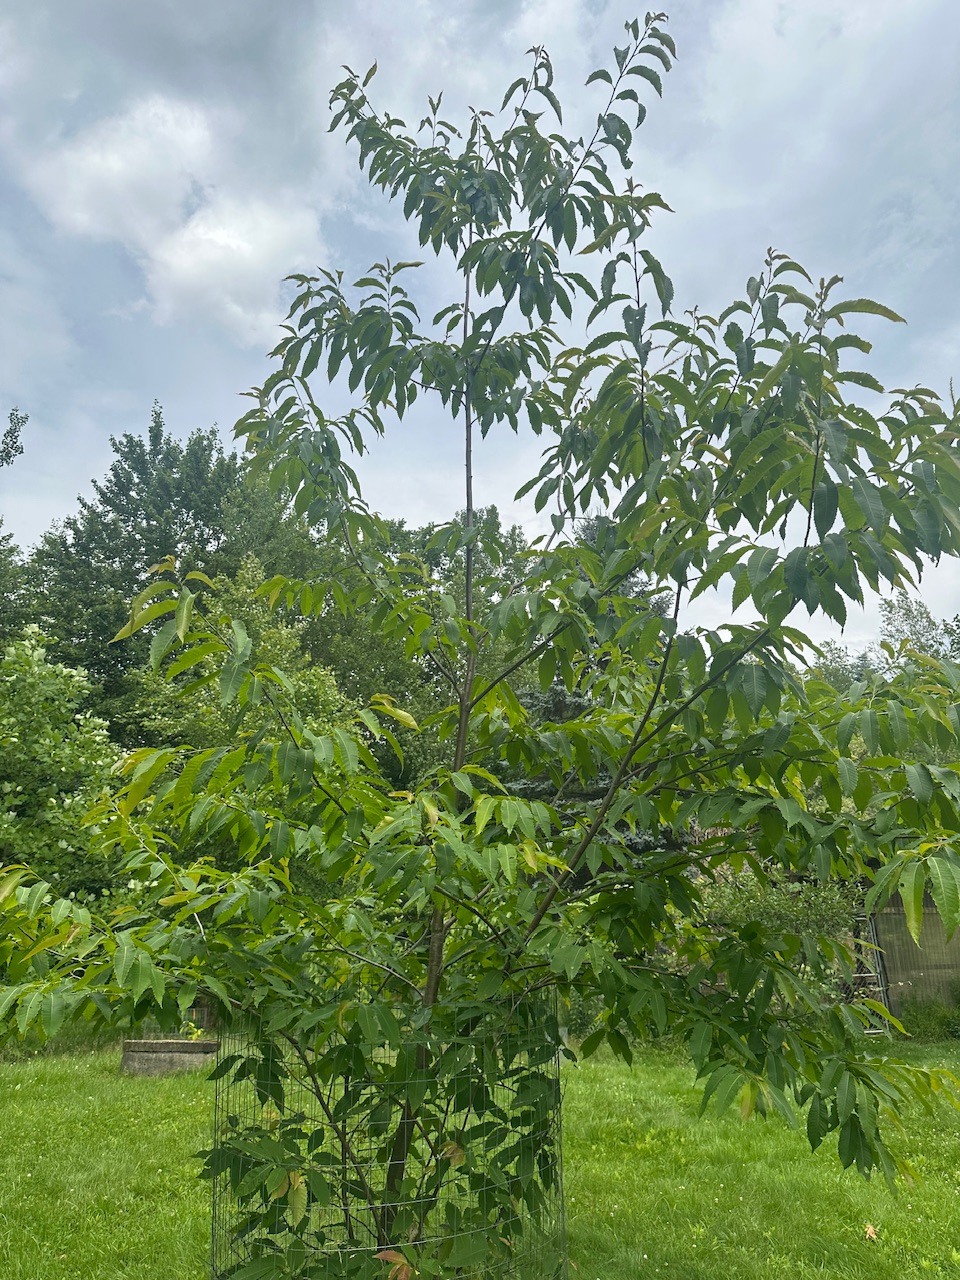
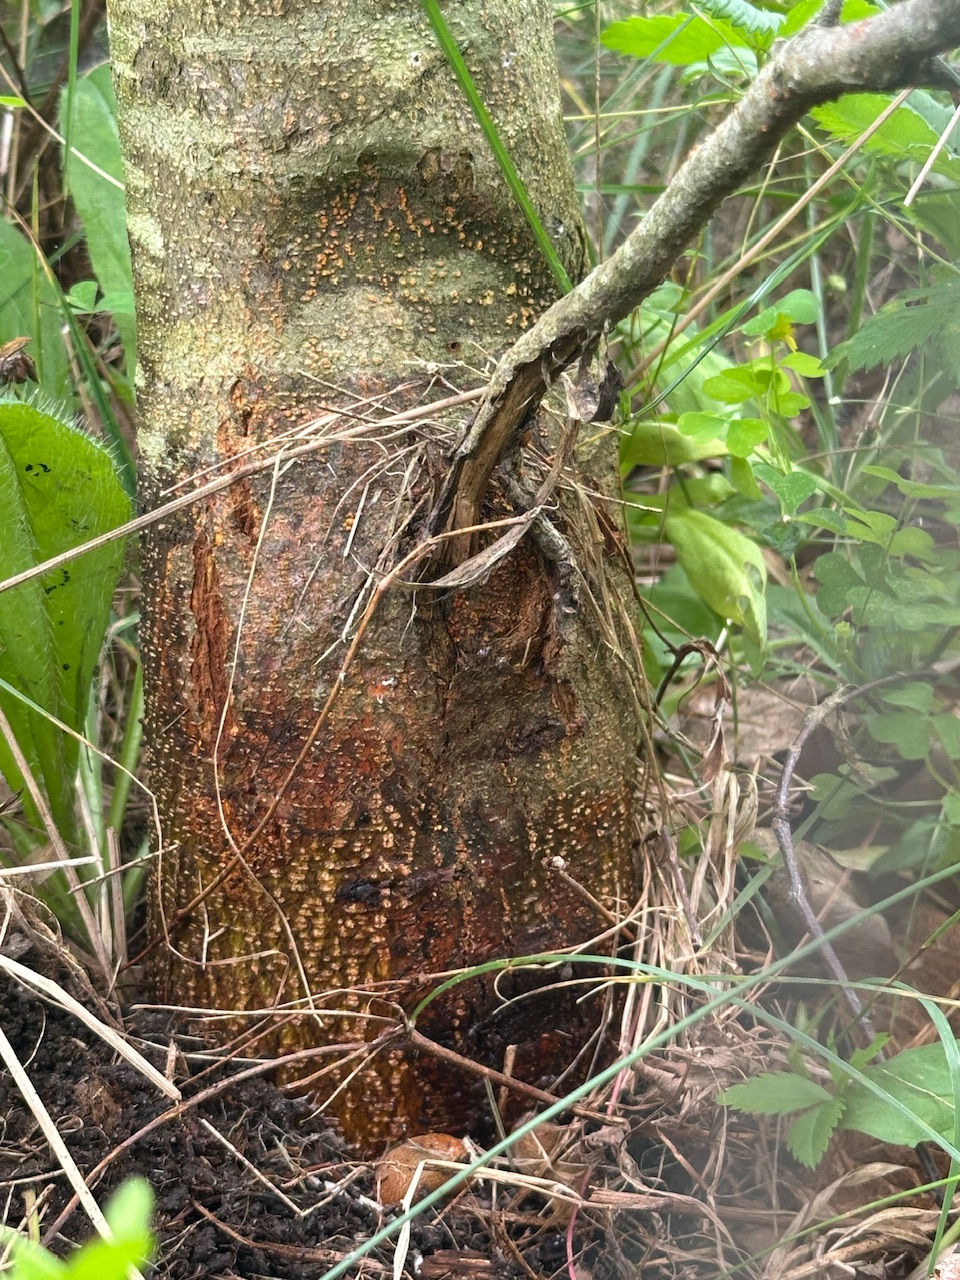
2025 Lawns & Gardens Thread. Making Lawns Great Again
dendrite replied to Damage In Tolland's topic in New England
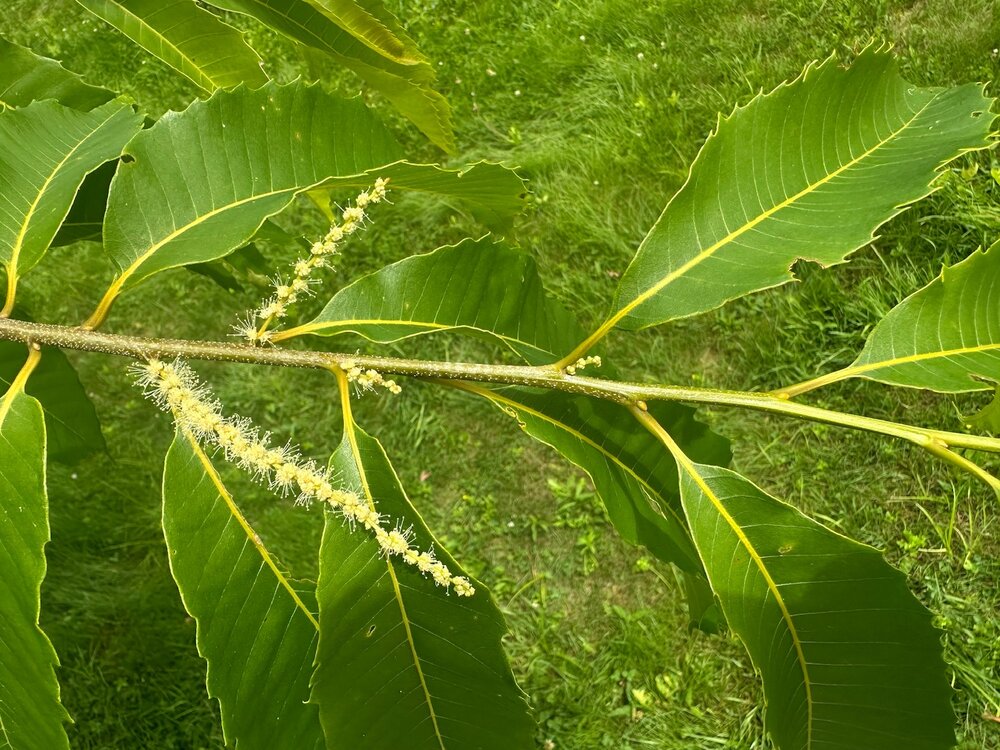
Bad news on the chestnut front. This tree is finally flowering really well, but I looked at the base of the trunk and the blight is starting to strike way down near the ground. I guess I could mud pack it, but that’s not a good sign long term for the genetics with that tree…at least on my property.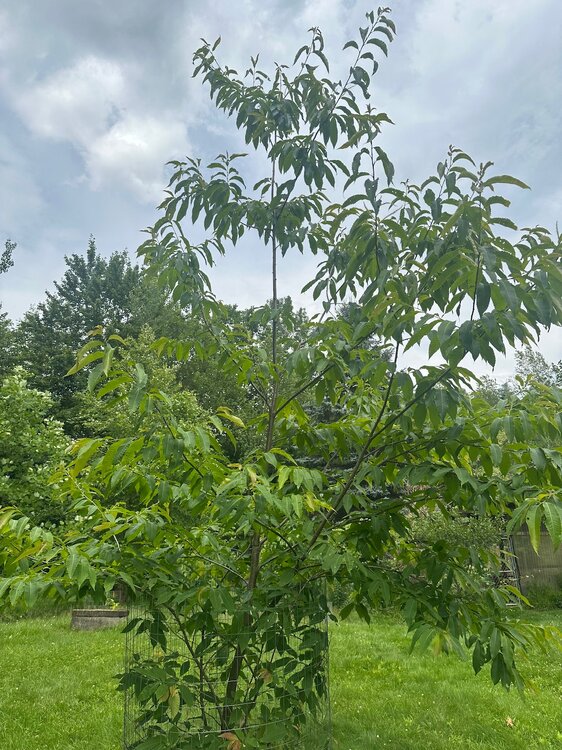

-
E PA/NJ/DE Summer 2025 Obs/Discussion
BBasile replied to Hurricane Agnes's topic in Philadelphia Region
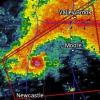
Seems the local radars have been down a lot lately. At least KPHL is back up, just in case... -

July 2025 Discussion-OBS - seasonable summer variability
FPizz replied to wdrag's topic in New York City Metro
It was pretty intense. Several mornings were a bit cloudy so that helped. -
July 2025 Discussion-OBS - seasonable summer variability
Brian5671 replied to wdrag's topic in New York City Metro
The sun has to be intense there this time of year... -
100% agree. As bad as some of the past several winters were here for certain years, that one still takes the cake as the #1 worst. 4" here total
-
Bawlmore summer is like the Carolinas these days.
-
Now the sun has come out. No humidity out there at all...
-
Don’t throw in the wet towel just yet.

-
Why are Wikipedia users refusing to acknowledge that Barry was responsible for all those deaths in texas
-
Just waves of tropical downpours for 10 minutes or so each time, and then stops, and then returns all morning into the early afternoon downtown Baltimore. Like being in Charleston, SC in August...
-
July 2025 Discussion-OBS - seasonable summer variability
FPizz replied to wdrag's topic in New York City Metro
Just was in Aruba for a week, that was enough of that, lol -
I am okay with this. I have 12U tryouts tonight at 6PM
-
 So I have finally completed the analysis of the Ghost Data stations and compared their inputs vs. the actual averages across the County. NOAA has employed techniques like interpolation to estimate temperatures in what they normally would say are data-sparse regions and in other cases this data may be resampled from another grid. Of note there are seven (7) ghost stations employed across Chester County PA with this estimated temperature data in the period of record from 1895 through 2013. All of these were during the ghost years reporting only precipitation data. Some eventually did begin actual temperature reporting after the ghost years. The Ghost Stations and years of estimated data are Phoenixville (1895-1914) / West Grove (1928-1962) / Coatesville (1948-1955) / Glenmoore (1957-2005) / Honey Brook (1957-2013) / West Chester 2W (1979-1981) and Devault (1988-2004). Overall there are 189 years of ghosted data used to "fill in data gaps". Of note this ghost data was warmer than the actual county records in 101 of the 106 years of ghosted data between 1895 and the "shuttering "of the last remaining ghost station at Honey Brook in 2013.. The largest warming adjustments were unsurprisingly made during the coldest decades of the 1960's and 1970's. Below is an analysis of the impact on average temperature trend lines between the actual raw data and ghost data in the years these adjustments were applied. Some more analysis on this data will follow.
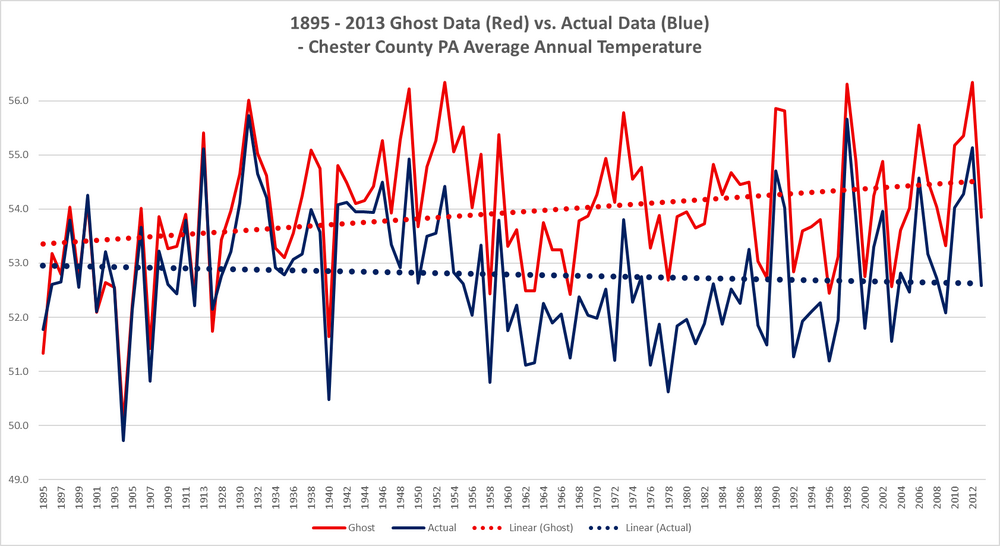
-
July 2025 Obs/Disco ... possible historic month for heat
Brian5671 replied to Typhoon Tip's topic in New England
83 here with some breaks of sun-very humid -
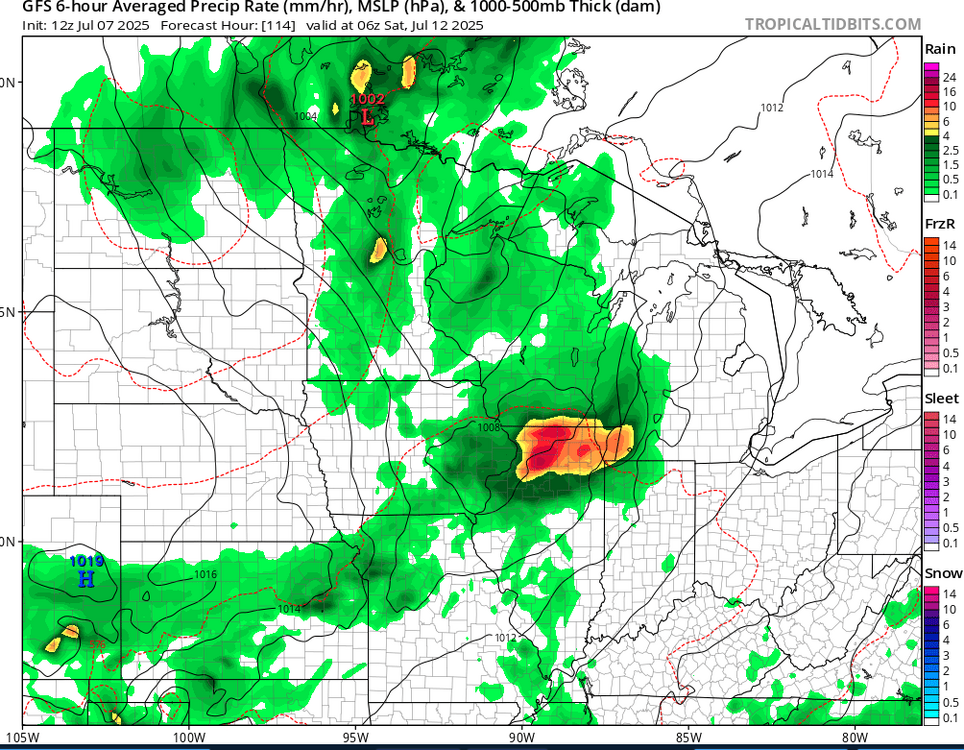
would be one of our trademark just enough and just in time drought busters needs to verify
-

July 2025 Discussion-OBS - seasonable summer variability
jm1220 replied to wdrag's topic in New York City Metro
Feels like a bath. Literally. -

July 2025 Discussion-OBS - seasonable summer variability
steve392 replied to wdrag's topic in New York City Metro
Walked outside and you can just feel the weight of the humidity. Just heavy feeling. Getting very dark to my west. -
E PA/NJ/DE Summer 2025 Obs/Discussion
RedSky replied to Hurricane Agnes's topic in Philadelphia Region
That radar is down again today