All Activity
- Past hour
-
Jan 24-26 Weekend Snow and Sleetfest Model Thread Part Tres
TSSN+ replied to H2O's topic in Mid Atlantic
I'm worried about the low water advisory the most. -

Central PA Winter 25/26 Discussion and Obs
pasnownut replied to MAG5035's topic in Upstate New York/Pennsylvania
yall can debbie all you want, but so far 0z mesos look just fine to me. minimal taint and front end poundtown. -

Jan 24-26 Weekend Snow and Sleetfest Model Thread Part Tres
wxlvr replied to H2O's topic in Mid Atlantic
Amazing! Thank you so much for helping me understand the dynamics of this storm! (not banter). -

Central PA Winter 25/26 Discussion and Obs
Jns2183 replied to MAG5035's topic in Upstate New York/Pennsylvania
The model outputs a couple days ago started for the south and Missouri valley started Twitter arguments between metrologist so intense it ended up all over the news. I think a prudent thing to do is look who was right tomorrow morning Sent from my SM-S731U using Tapatalk -

Possible Record Breaking Cold + Snow Sunday 1/25 - Tuesday 1/27
greenmtnwx replied to TriPol's topic in New York City Metro
how much does 2” per hour at 10:1 add up in 3 hours? -

Jan 24-26 Weekend Snow and Sleetfest Model Thread Part Tres
Chris78 replied to H2O's topic in Mid Atlantic
100%. Very subtle changes but as you said a shift of a few hours could make a difference with heavy rates prior to the changeover. The Nam does worry me. It seems off on its on but I've seen it win sometimes in these set ups. Hopefully not this time lol -

Possible Record Breaking Cold + Snow Sunday 1/25 - Tuesday 1/27
Blizzardo replied to TriPol's topic in New York City Metro
That at 10:1 ratio... It's gonna be 15:1 atleast when this gets going. But how long that lasts is anyone's guess.. -
Pittsburgh/Western PA WINTER ‘25/‘26
Rd9108 replied to Burghblizz's topic in Upstate New York/Pennsylvania
-

Jan 24-26 Weekend Snow and Sleetfest Model Thread Part Tres
Rvarookie replied to H2O's topic in Mid Atlantic
Take it to banter man. Don’t ruin the obs / discussion -

Possible Record Breaking Cold + Snow Sunday 1/25 - Tuesday 1/27
JonClaw replied to TriPol's topic in New York City Metro
I don't know how useful SREF plumes are, but they have a wide range for snow at LGA: 4" to 22" with a 12.4" mean. -
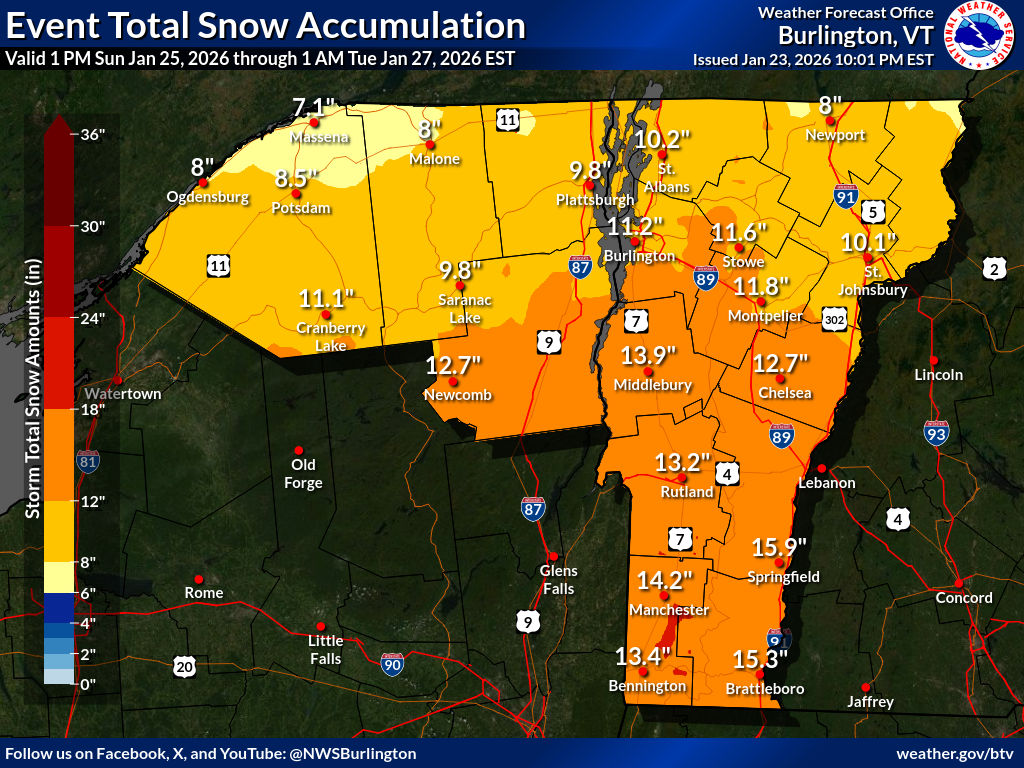
BTV stayed the course too.

-
gotta be the coldest night of the year because of the wind, i'm sure next week temps wise it'll get colder but it won't be as windy
-

Possible Record Breaking Cold + Snow Sunday 1/25 - Tuesday 1/27
Stormlover74 replied to TriPol's topic in New York City Metro
This is what falls as snow on the rrfs. Then it flips and we get a ton of sleet.thumb.png.be81c21f4ae2e37601265a5b71d3106b.png)
-

Central PA Winter 25/26 Discussion and Obs
canderson replied to MAG5035's topic in Upstate New York/Pennsylvania
It wasn’t over when the Germans bombed Pearl Har … wait what? -

Jan 24-26 Weekend Snow and Sleetfest Model Thread Part Tres
nj2va replied to H2O's topic in Mid Atlantic
It’s been a long time since the whole area has been under a WSW -

Possible Record Breaking Cold + Snow Sunday 1/25 - Tuesday 1/27
jm1220 replied to TriPol's topic in New York City Metro
It gets sleet from a line from Port Jervis to just south of Boston. If sleet really gets that far north it's hard to see how the immediate NYC area and coast do well. -

Possible Record Breaking Cold + Snow Sunday 1/25 - Tuesday 1/27
Snowlover11 replied to TriPol's topic in New York City Metro
So far the NAM is the warmest model, while others have inched better. Lets see how the GFS,UKMET and EURO do here. -
 Agree I think upton is being too aggressive and Mount Holly even more aggressive. They are probably being cautious to alert the public and will back down a little tomorrow if current modeling holds.
 -

Jan 24-26 Weekend Snow and Sleetfest Model Thread Part Tres
BTRWx's Thanks Giving replied to H2O's topic in Mid Atlantic
Red line is temperature. Green line is dew point. The solid black line that rises to the top right indicates the freezing level from the ground upward. Precipitation falls when the temperature and dew point line are touching at the bottom of the chart (the ground). Snow falls when the temperature and dew point lines stay to the left of the solid black freezing line. When you see the temperature line make a triangular shape bulge to the right of the freezing line, this indicates melting in that layer. If the raindrop continues to fall and the temperature line moves back to the left of the freezing line, the raindrop will refreeze. If the warm layer is high enough above the ground, the precipitation will be sleet, but if the triangular bulge happens near the ground, then rain will re-freeze as freezing rain. -

January 24-26: Miracle or Mirage JV/Banter Thread!
Yeoman replied to SnowenOutThere's topic in Mid Atlantic
No need for your BF to DoorDash a yardstick -
Possible Record Breaking Cold + Snow Sunday 1/25 - Tuesday 1/27
Blizzardo replied to TriPol's topic in New York City Metro
This is it exactly... 2" per hour at 15:1 adds up real quick... -

Possible Record Breaking Cold + Snow Sunday 1/25 - Tuesday 1/27
psv88 replied to TriPol's topic in New York City Metro
I’m comparing the ICON to the ICON. Its algorithms didn’t change from 18z to 0z. -
Jan 24-26 Weekend Snow and Sleetfest Model Thread Part Tres
midatlanticweather replied to H2O's topic in Mid Atlantic
17.1 with DP of 2. WC of 6 Brrrrr -

Jan 24-26 Weekend Snow and Sleetfest Model Thread Part Tres
Solution Man replied to H2O's topic in Mid Atlantic
Banter -
 24 here but dropping fast

.png.6dc1e0ca37aec477895dbfd316b12d66.png)

