All Activity
- Past hour
-
Who knows, maybe it’s on a heater and it’s amp o’clock in the atmosphere
-
Clipper Fires In Wednesday Feb 25 Disco/ Obs
DavisStraight replied to Damage In Tolland's topic in New England
We have seasons with much more but this year feels just as good as many of them. -

Feb 22nd/23rd "There's no way..." Obs Thread
North Balti Zen replied to Maestrobjwa's topic in Mid Atlantic
Providence, RI ended up with 37.9"...that's bonkers. Easily a record for them. -

2/26 - Follow-up Hopium Battlezone Storm
stormtracker replied to DDweatherman's topic in Mid Atlantic
GFS just won't give up -

Clipper Fires In Wednesday Feb 25 Disco/ Obs
40/70 Benchmark replied to Damage In Tolland's topic in New England
Ok, weathergeek -
can we retire icon while we are at it. It is a pointless model. Nam at least could handle the warm nose detection, i guess the only thing icon may be decent is surface temps. Can you guys check im not technologically advanced as some of us are in here and see what icon has for high temp for central park today and than compare it to the actual result?
-
What is your YTD over there?
-
Dude give it a rest. My comment over a year ago was that it would be challenging for NYC Central Park to measure 50” on the season and not the surrounding locations which are naturally snowier like ISP and EWR. You will notice that I never use the term impossible just degrees of how likely or challenging a pattern is. I am very happy how this winter turned out since it was one of my scenarios which included a rebound off the recent year snowfall lows. It’s funny how you jumped on my post in December which mentioned getting over 4-6” in December is a good sign for winter stating that I didn’t know what I was talking about. My other observation and outlook issued several years ago is still doing well that it would be a challenge to rival snowfall during 1993-1994 in PA, 1995-1996 in our area, 2009-2010 in DC to Philly, 2013-2014 around Detroit and the Midwest, and 2014-2015 around Boston. That was based on the temperature jump following the 2015-2016 super El Niño and smaller areas of cold relative to the past. You will notice that this winter across the CONUS was one of the warmest ones. So the fact that the cold was compressed into the East much more than usual was illustrating the smaller Northern Hemisphere cold pool The legacy snowfall winters from 1994 to 2015 had a larger area of cold to work with allowing all-time seasonal snowfall highs. I actually hope that NYC can measure 50” before the season ends. But NYC, LGA, and JFK sit in the heat island and also end up between the best banding during KU events over NNJ and across Long Island. So it’s more challenging for 50” measurements relative to other areas.
-

Clipper Fires In Wednesday Feb 25 Disco/ Obs
Ginx snewx replied to Damage In Tolland's topic in New England
67.5 -
Winter cancelled/uncancelled banter 25/26
Volcanic Winter replied to Rjay's topic in New York City Metro
I’m at about 44-45 (about an inch overnight, so call it 45) on the season. I’m Toms River but at the Manchester border to the west, the east part by the river / Barnegat Bay may have different totals. This area can have fairly significant differences between Seaside , TR by the bay, and over to me. -

February 2026 OBS & Discussion
hudsonvalley21 replied to Stormlover74's topic in New York City Metro
.5 here. -
.5 here.
-

Clipper Fires In Wednesday Feb 25 Disco/ Obs
Damage In Tolland replied to Damage In Tolland's topic in New England
68.7” YTD here -

Clipper Fires In Wednesday Feb 25 Disco/ Obs
Sey-Mour Snow replied to Damage In Tolland's topic in New England
How much on season -
Btw, had another 3” with the system today, bringing season total to 71.5
-
Actually no, I don’t typically report in. There is one person/trained spotter in New Fairfield who I often see on the roundups, however, not me (I believe they are more on the northeast part of town). I think the Sherman one is separate, yes. There’s also a good personal weather site, shermanctweather.org, though further north in Sherman, that has lots of data. Finally, I follow Western CT Weather (Jack Drake) on FB and he posts lots of data as well. Quite a few weather weenies in this area. The hills/elevation in the area support good snow. Thanks for all the work and time you put in to collecting data, it’s really amazing and appreciated.
-
Clipper Fires In Wednesday Feb 25 Disco/ Obs
Ginx snewx replied to Damage In Tolland's topic in New England

-
February 2026 OBS & Discussion
WeatherGeek2025 replied to Stormlover74's topic in New York City Metro
how much u got today? -
No model is King anymore - its just that "Every Dog has its day" and the GFS just had its day.
-
Nice, only .6" for me this morning and 8" at the stake.
-
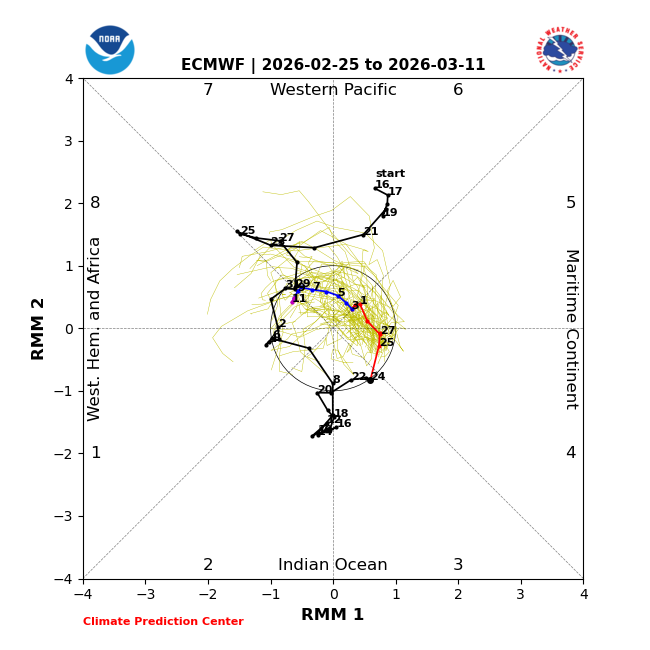
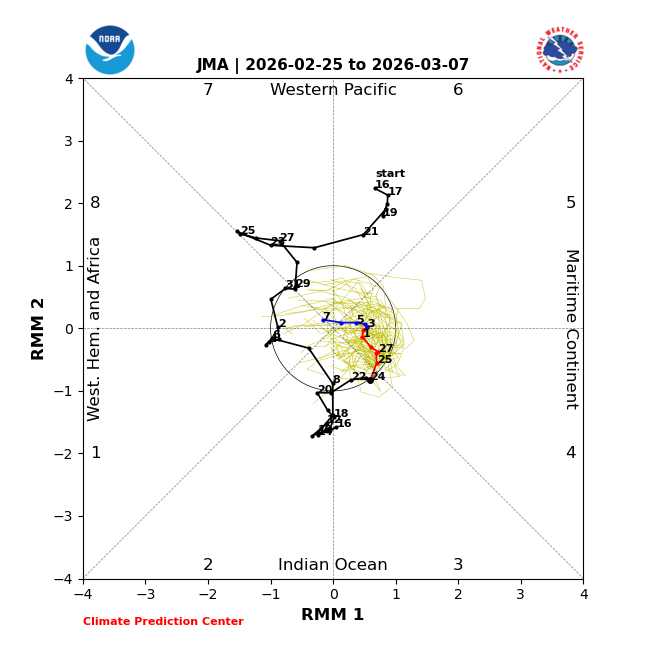
GEFS still has huge disagreement with EPS! Also, JMA is much closer to EPS fwiw and is actually even further from GEFS! EPS JMA
-
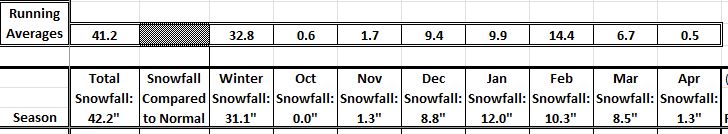
Yeah, that data has more holes in it than @BxEngines socks but I digress. Here is a screenshot from one of my spreadsheets that shows my running averages at the top and what I did find for KMGJ listed in the box with the month, if interested. Some of the numbers will be slightly off because winter isn't over yet but you'll get the idea.
-
I haven't been keep track (probably the first time since 1967), but my measurements are usually lower than the surrounding area reports this year...
-

Clipper Fires In Wednesday Feb 25 Disco/ Obs
CoastalWx replied to Damage In Tolland's topic in New England
Sun coming out with snow lol -

"Don’t do it" 2026 Blizzard obs, updates and pictures.
wxsniss replied to Ginx snewx's topic in New England
No idea either… you might want to DM the original tweet by @weathernut27 Would be amazing to archive a searchable library of storms in this way (and something I’ve long wanted to do but never have time: archive how all the main models performed for each storm)