All Activity
- Past hour
-

Augdewst 2026: Summer's Last Stand
dendrite replied to Prismshine Productions's topic in New England
-
Taylor Ward to the Mariners, Red Sox talking to O's about Rutschman per ESPN.
-

Augdewst 2026: Summer's Last Stand
Damage In Tolland replied to Prismshine Productions's topic in New England
Same here. Had rains but never crushed. Not once -
1.2” yesterday and ground was squishy for first time in a long time
-

Augdewst 2026: Summer's Last Stand
WinterWolf replied to Prismshine Productions's topic in New England
Ya we’re gonna go 4” here easily. -
Augdewst 2026: Summer's Last Stand
WinterWolf replied to Prismshine Productions's topic in New England
Ya dam Don….I’d gladly give you some..we have enough. -

Augdewst 2026: Summer's Last Stand
Sey-Mour Snow replied to Prismshine Productions's topic in New England
70% of southern New England will see 2-4” today, pretty solid, most widespread heavy rain event of the summer. -
Augdewst 2026: Summer's Last Stand
WinterWolf replied to Prismshine Productions's topic in New England
Just absolutely pouring here…dam what a deluge. -

2026-2027 Super El Nino
40/70 Benchmark replied to Stormchaserchuck1's topic in Weather Forecasting and Discussion
Yea, basically a -PDO negatively interferes with every element of El Nino that is favorable from the perspective of an east coast winter enthusiast. -
A second straight day with a dousing on the way? It just started at 12:30PM and is picking up in intensity as radar confirms.
-

Augdewst 2026: Summer's Last Stand
HoarfrostHubb replied to Prismshine Productions's topic in New England
Some spots in Leominster over 5”. Reports of 5” per hour rates. around 3” here. Blah -
Augdewst 2026: Summer's Last Stand
WxWatcher007 replied to Prismshine Productions's topic in New England
Rough summer of misses here. Just how it goes. -
Augdewst 2026: Summer's Last Stand
WinterWolf replied to Prismshine Productions's topic in New England
Well over 3” here and pouring…all lawns are like Augusta National at the height of summer this year. -
Sudden downpour in Fairfax City
-
2026-2027 Super El Nino
40/70 Benchmark replied to Stormchaserchuck1's topic in Weather Forecasting and Discussion
I think the 12-rack you consumed for breakfast deconstructively interfered with your thought process. -

Augdewst 2026: Summer's Last Stand
CoastalWx replied to Prismshine Productions's topic in New England
No flood watch but this will be more prolific than last week. -
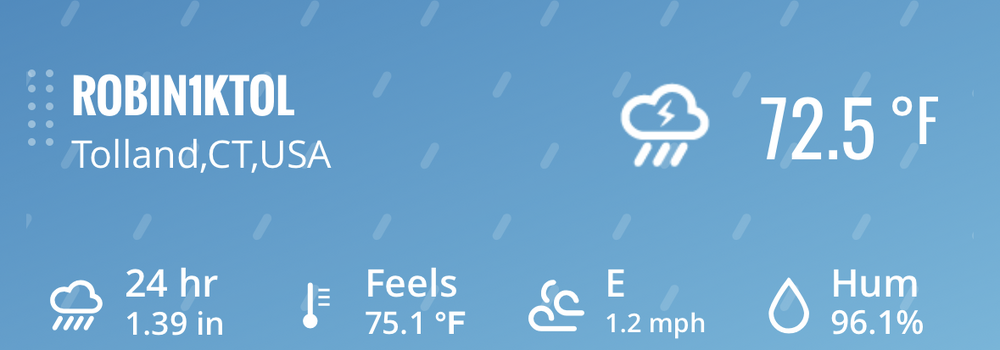
Up to 4.0 inches at my station
-
It is absolute ass outside. DP 74° but it feels like it’s 125% humidity. Just cut grass and it crushed me.
-
77F/75 DP 93% RH with sun out now. It feels awful.
-

E PA/NJ/DE Summer 2026 Obs/Discussion
Hurricane Agnes replied to PhiEaglesfan712's topic in Philadelphia Region
Round 3 here in NW Philly with another thin but potent band coming through with > 2"/ hr rates. Now at 1.79" at post time Temp 76/dp 74.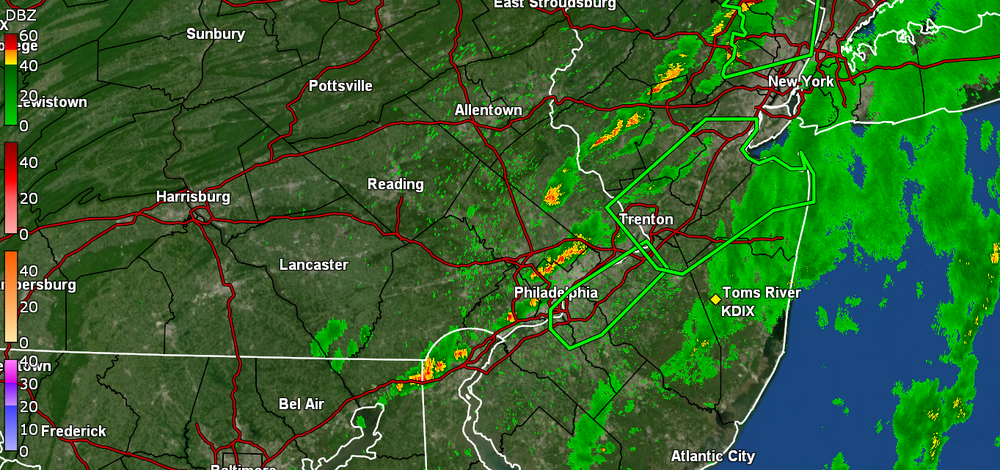
-
Up to 2.04" for this event. 11.84" since July 1. Just about a foot of rain.
-
Augdewst 2026: Summer's Last Stand
CoastalWx replied to Prismshine Productions's topic in New England
Almost half inch -
.thumb.jpg.aec747d13df1d95d5fed34574f74d4fd.jpg)
Augdewst 2026: Summer's Last Stand
Vinny Findley replied to Prismshine Productions's topic in New England
2.2 in Cranston 1/4 mile east of 295 and South on route 14 -
Augdewst 2026: Summer's Last Stand
Damage In Tolland replied to Prismshine Productions's topic in New England
The rain over PVD is yours -
Augdewst 2026: Summer's Last Stand
CoastalWx replied to Prismshine Productions's topic in New England
Not this Wey