All Activity
- Past hour
-

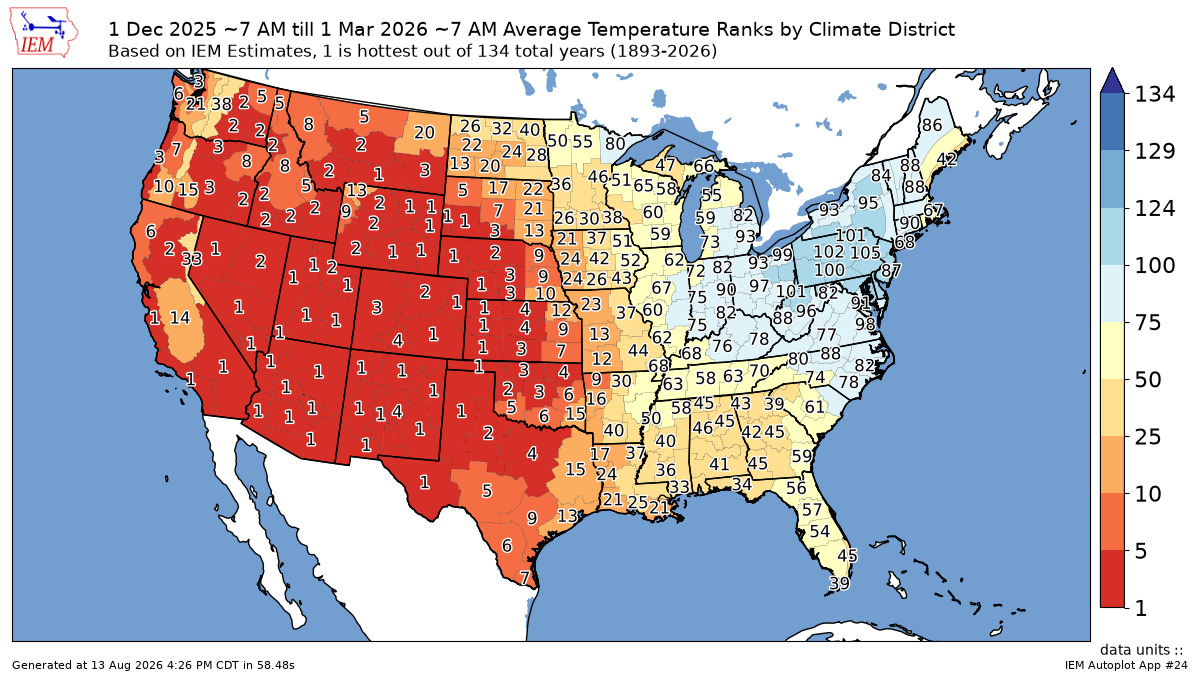
2026-2027 Record-breaking El Nino
michsnowfreak replied to Stormchaserchuck1's topic in Weather Forecasting and Discussion
I hate that too. I hate heat but if its going to be hot id much rather see a good heatwave challenge some daytime high records rather than a swampy 88-92 with warm tropical low temps bringing up the departure. -
Appreciate the reports from a real head, glad you're all good
-
I hope this rain is done for awhile, we can't take anymore. I am very familiar with the creeks and rivers around here as I do a lot of fishing, canoeing and kayaking especially East of State Road 9. I took a ride around Madison, Delaware and Hancock counties today and there are places I've never seen the water that high ever (in 15 years anyway). They are saying record levels on the White River from around Muncie to Anderson. There is a big gravel pit, about 100 acres, to my SE on St Rd 13 that the gravel tower that loads the trucks is halfway under water from the table rising in the 3 pits its already dug. That thing is 75ft tall. Bridges along Pipe creek and White river are like 12 inches from going under on major roads and highways. These are fairly large spans (for us in the stix lol) of over 100ft. Tons of roads closed and EMS trucks and cars everywhere. Believe it or not I forgot my phone lol. I'm gonna go back around tomorrow as the rivers are supposed to crest then and get some pics. Its pretty bad. I know the New Castle and Cambridge areas got hammered too but thats a bit of a stretch for me just farting around lol. That was a ton of rain in such a short time for about an 8 county area.
-
2026-2027 Record-breaking El Nino
40/70 Benchmark replied to Stormchaserchuck1's topic in Weather Forecasting and Discussion
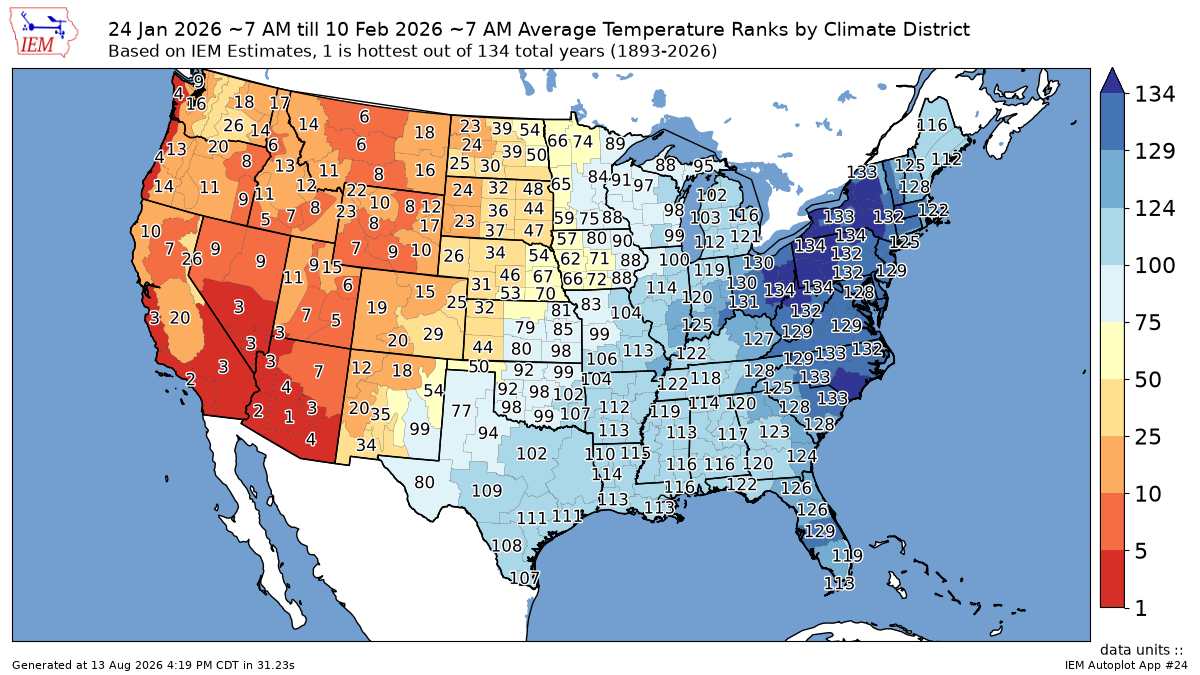
I expected a bitter stretch in latter January into early February in association with that +TNH pattern, but it was cold more consistently than I expected. -
Its possible, but the least likely outcome as psuhoffman says. It happened in 23-24 when that nino didn’t fully couple. This time it’s going to be even stronger and the PDO is rising, should be a well coupled event.
-
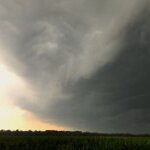
Hail and urban flooding for some areas around Denver
-
Maybe something in the middle is possible? With a bit of luck and timing, why not a couple light to moderate events and a big coastal storm? I don't think it has to be binary. We are in uncharted waters to an extent, so who really knows? (no one)
-
That was in the list for 2009-10. The one I am referring to is missing. https://www.raymondcmartinjr.com/weather/
-
There’ll be two camps. Some will go warm and snowless, and others will call for at least one HECS event. Toss up, but I may go the former and then later root against my own forecast.
-
Afraid to jinx this, but in addition to fewer cicadas this year, I feel I can confidently say fewer laternflies as well. Especially at work in Greenbelt. Last year they just covered the front of the building on warm days. Only even seen a couple this year there.
-
Augdewst 2026: Summer's Last Stand
Ginx snewx replied to Prismshine Productions's topic in New England
Getting crushed in Danielson -
Jan 30th 2010. 5-8" storm with some locally higher amounts- more east/south including SNJ(Ray's area). Important because we hadn't had any snow since the pre Xmas Dec blizzard, Ji was was about to have a grand mal meltdown; it was a cold powder smoke job with temps in the teens; it looked like a miss south a couple days prior, and it set the stage for what was to become probably the most epic 10 day period of snow we have seen in our lifetimes. https://www.weather.gov/media/phi/StormReports/January302010.pdf
-
(002).thumb.png.6e3d9d46bca5fe41aab7a74871dd8af8.png) What remains genuinely open regarding Coatesville 1SW remains the magnitudes have never been independently checked. A documented 0.3-mile move does not actually tell us the offset should be +0.86 °C. That number comes from neighbor comparison, not from the site. Nobody in this thread has tested whether the applied steps match what the physical changes would produce. Also of note about a third of the adjustment trend attaches to no listed changepoint at all. +0.123 reconstructed against +0.184 actual. No station history can validate a component that no documented event is claimed to explain, and NCEI hasn't yet answered that from my earlier email. Lastly, and what can't be overlooked is that the raw cooling doesn't behave the way the artifact explanation predicts. Fitting the breaks actually deepens it rather than dissolving it!!
What remains genuinely open regarding Coatesville 1SW remains the magnitudes have never been independently checked. A documented 0.3-mile move does not actually tell us the offset should be +0.86 °C. That number comes from neighbor comparison, not from the site. Nobody in this thread has tested whether the applied steps match what the physical changes would produce. Also of note about a third of the adjustment trend attaches to no listed changepoint at all. +0.123 reconstructed against +0.184 actual. No station history can validate a component that no documented event is claimed to explain, and NCEI hasn't yet answered that from my earlier email. Lastly, and what can't be overlooked is that the raw cooling doesn't behave the way the artifact explanation predicts. Fitting the breaks actually deepens it rather than dissolving it!! -

2026-2027 Record-breaking El Nino
roardog replied to Stormchaserchuck1's topic in Weather Forecasting and Discussion
The media will have you believe that every heatwave is a “heat dome” that will melt your entire body and you’ll end up in the city sewer system. Meanwhile every cold snap is the polar vortex coming south instantly freezing every human or animal outside in place. In reality, sometimes it’s just really cold in winter and really hot in summer. -

2026-2027 Record-breaking El Nino
bluewave replied to Stormchaserchuck1's topic in Weather Forecasting and Discussion
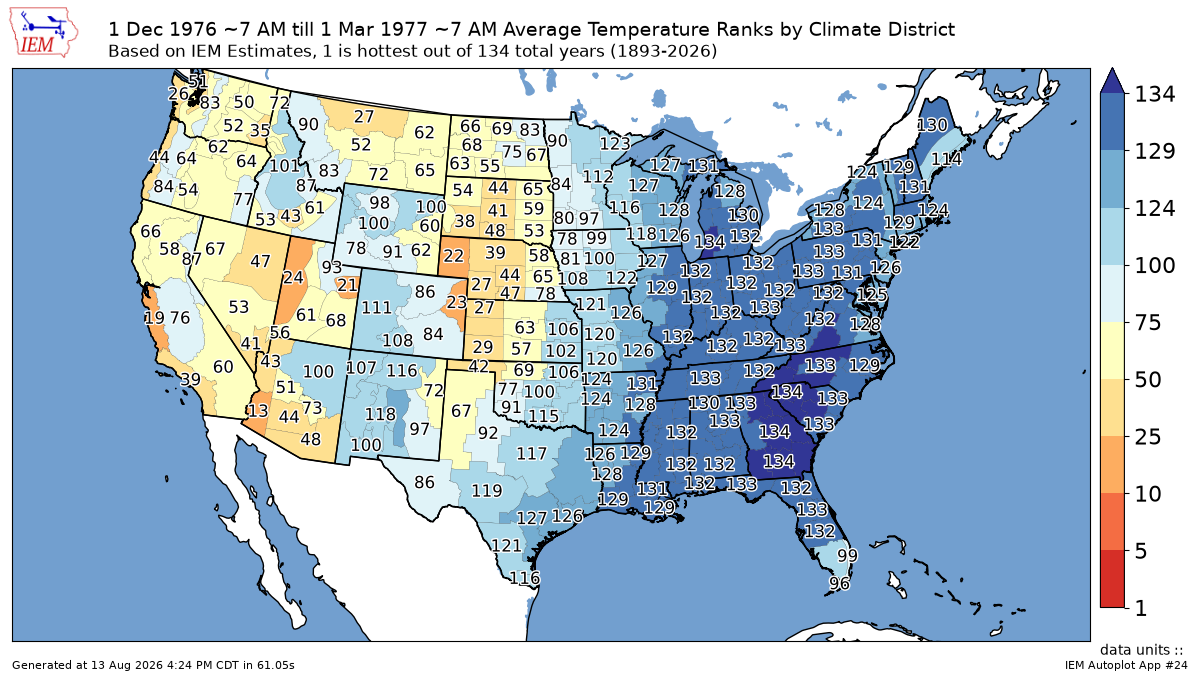
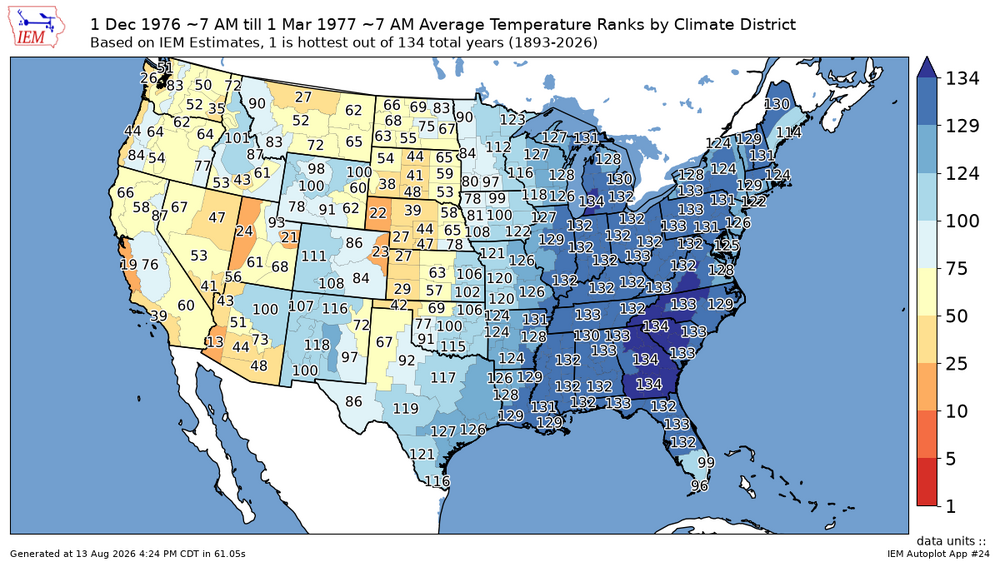
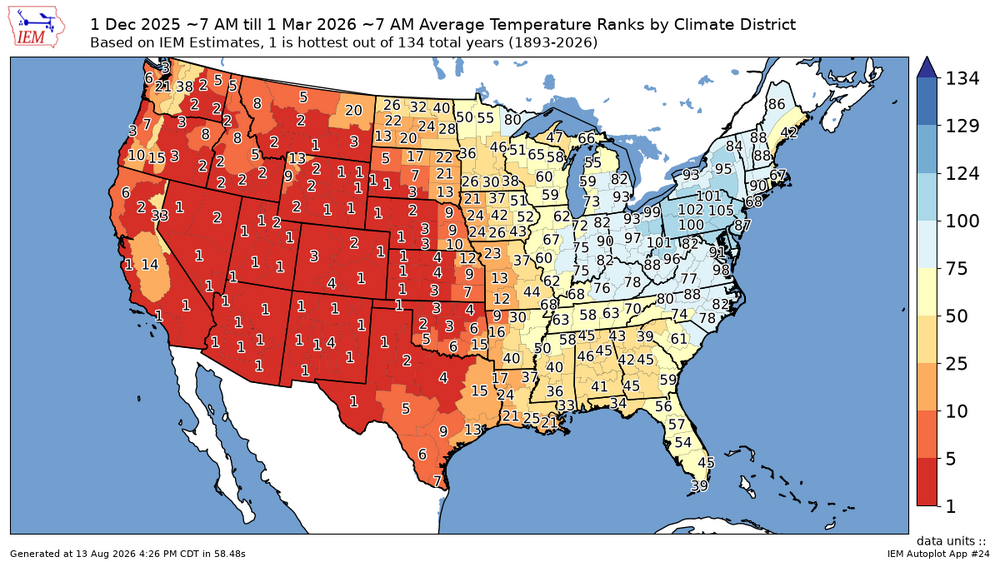
We got that impressive 16 day run of cold from late January into early February. But since the rest of the U.S and the Northern Hemisphere was so warm last winter, the duration of the noteworthy cold was limited. Back in the late 1970s when the world was much colder, there was ample cold supply across the Northern Hemisphere for the entire winter to rank as cold as the 16 day period did last winter. So the Northeast had to wait 11 years to finally get a colder winter than the long term average.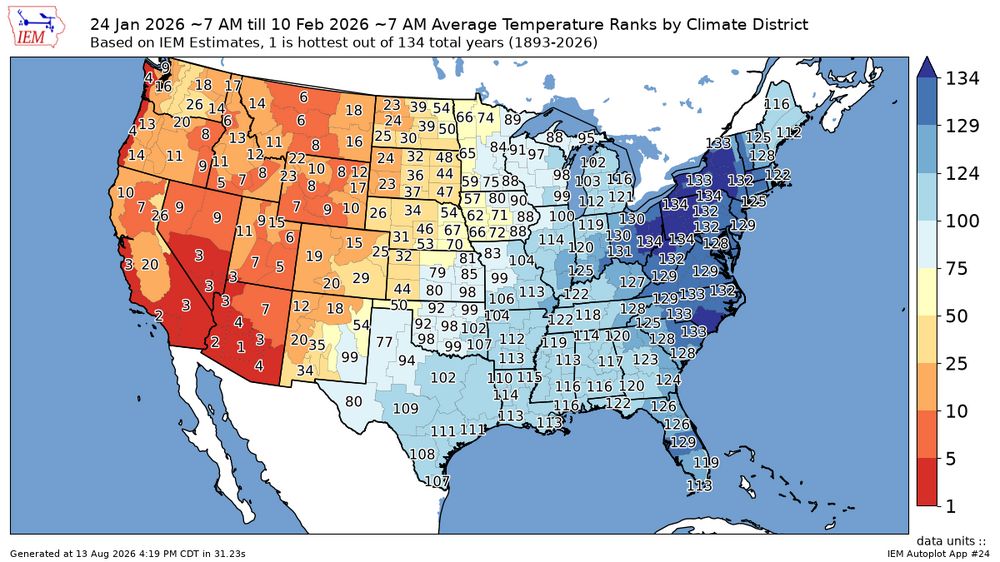
-
3rd straight 88° high temp. Been a warm month so far with a +3.2° departure.
-
Whats with the constant smoke every day? Is the new normal?
- Today
-
Could be December 2009. That was a big one that got overshadowed by February 2010.
-
Not so fast Mike!! We are not close yet to what think is being answered! The deep dive above clearly has not yet answer these two questions for Coatesville! First the refit I promised with some very important findings!! and then where I think you and I are answering different questions. At the end I will address your Phoenixville box above. I said I wouldn't quote that 1952-82 trend until I'd refit it against the full break set, because if there are several real discontinuities in the window then a single-step model is under-specified and the number is worthless. I've now done it, and the result is quite surprising!! The mechanism first, because it's the interesting part. A step term and a trend term compete for the same variance in a regression. If Coatesville's apparent cooling were really just the station stepping down at a few dates, fitting those steps should soak up the drop and leave the residual slope flattened toward zero. That is exactly the test. But what actually happened is the complete reverse. Every fitted step comes out positive - the model wants the later years lifted, not lowered - and lifting the later years forces the underlying line to fall more steeply to still pass through the data. Coatesville 1952-1982, annual, trend and steps estimated jointly in one model rather than subtracting steps first: no steps -0.594 F/decade p = 0.0001 1973 only (my attributed break) -0.735 F/decade p = 0.0048 NOAA's two (1959, 1971) -0.959 F/decade p = 0.0272 Berkeley's five (1959/68/71/73/76) -1.657 F/decade p = 0.0188 Significant in all four. Fitted steps +0.45, +0.46, +0.89, +0.91, +0.81 F, every one positive. So the more of your documented breaks I grant, the more raw cooling is left over needing some other explanation. The weaknesses, because I'd rather flag them myself. Not one of those steps is individually significant - best p is 0.17, standard errors 0.6 to 0.7 F against steps of 0.45 to 0.91. So this isn't proof the steps are positive. It's that the data, asked where steps would sit if they exist, puts them in the direction that deepens the cooling. Suggestive, not conclusive, and it neither confirms nor refutes your documentation, because at annual resolution this series can't resolve steps that size. AIC prefers the no-steps model over every step set, though with those SEs that's weak too. And the five-break fit is badly under-powered: seven parameters on 31 values at 0.75 F residual SD detects a genuinely present trend only about 14% of the time in simulation. It found one anyway, which is why I'm reporting it rather than quietly setting it aside - it's the most favourable number to me and the one I trust least. So what I'll stand behind is a range: -0.59 to -1.66 F/decade over 1952-1982 depending on the break set assumed, significant in all four specifications. Now, on validity and necessity. I think we're answering different questions. Your work establishes that events occurred at those dates, and I've conceded that without reservation. Validity is a further step: it requires the magnitude applied at each date to be right. The PHA sizes each step from neighbour comparison, not from the site. A 0.3 mile move is a documented fact. The +0.86 C attached to it is an estimate. Nothing in the 530-1s, the deeds or the aerials tests that estimate, and that's the question I keep coming back to - it isn't answered by more documentation, however good the documentation is. Necessity is different again. If the raw cooling at Coatesville were an artifact of the station changes, fitting those changes should dissolve it. It doesn't. It deepens it!!!!. Whatever else that shows, it isn't what "the adjustment is essential to get the right answer" predicts. And about a third of Coatesville's adjustment trend isn't attached to any listed changepoint at all. NCEI's twelve cumulate to +0.123 C/decade against an actual adjusted-minus-raw trend of +0.184. Station history can't validate a component that no documented event is claimed to explain. I've asked NCEI what accounts for it rather than guessing, and I'll post their answer either way. On Phoenixville I'd want to look at your figure properly before saying much, and I'll say up front that my own analysis can't support a claim about that station in either direction. When I tested its 1952-82 trend against a step placed at every possible date, 14 of 21 rendered it non-significant. That series is too short and too noisy to separate a step from a trend, so I'm not going to argue it either way. I'd also note that if the microsite is changing continuously - your reading of the aerials is roughly every ten years from 1927 forward - then the disturbance is gradual, and a step function is an odd model for gradual drift. On the two hours: fair enough, and I've said as much. Though the changepoint list I've been working from came from NCEI directly on request, and isn't online anywhere. The offer stands on your 530-1 and deed compilation. Your dates are better than the ones I read off your figure, and the magnitude question needs them. Now regarding the last Phoenixville block - that block does not say what your post said. Your comment claims the adjustments are "valid and absolutely necessary," but the header states ten breaks now carry a documented physical cause and seven smaller breaks remain unexplained, plus one marked UNRESOLVED at 1966 and a merged box labelled "UNDOCUMENTED — 7 BREAKS." That's 10 of 18, not a resounding yes!!!! Thanks for posting it — it's a more careful figure than the summary suggests. What strikes me most is that the two sources diverge here in a way they don't at Coatesville. At 1940 — the largest documented move in the record, 2.1 miles — BEST flags +0.75 F and NOAA flags nothing at all. At 1942 it's the reverse. At 1985 you note the NOAA break is a single-station calibration artifact. If two implementations of neighbour-based detection disagree about whether the biggest documented move in the record produced a break, that seems worth more attention than either of us has given it. The 1920 entry is the strongest piece of documentary work in either of your figures, incidentally — coords changing then reverting a year later while the offset doesn't is a real finding and I'd not have got there. My own analysis cannot support the claim that Phoenixville cools — which matters because Phoenixville has been used as a comparator throughout this thread. Charlie dismissed my Coatesville–Phoenixville comparison over a 1948 break, and I cited Phoenixville's raw trend earlier in the exchange. Testing its 1952-82 trend against a step at every possible date, 14 of 21 rendered it non-significant. Too short and too noisy to separate a step from a trend, so to date we cannot find total support for these NCEI adjustments to Coatesville 1SW Paul
-
Hmm, can I call a friend...assuming I can find someone to call a friend? Seriously, can't think of what you're referring to???
-

Augdewst 2026: Summer's Last Stand
Damage In Tolland replied to Prismshine Productions's topic in New England
Big wind damage in Wilbraham -
 http://mexisaferx.com/# mexico pharmacies
 -
2026-2027 Record-breaking El Nino
EasternLI replied to Stormchaserchuck1's topic in Weather Forecasting and Discussion
Well, maybe there are... then again maybe there aren't lol, but if we can get something like the 12z AIFS-ENS below. It would probably keep going the right direction. Start seeing this kind of GOA low on a regular basis would do wonders for the eastern portion of it. Do that plus get some tropical cyclones to take a bite out of that north Pacific warmth that has pooled there from the persistent ridging in that area. Combined, that would go a long way towards transforming that index. As a side note, that's part of the reason I would like to see a couple recurving typhoons through that region. Some guidance is hinting at maybe there finally being some potential for that too as we close out the month. I'm keeping an eye on that. Could have a shot there for one. -

Augdewst 2026: Summer's Last Stand
dendrite replied to Prismshine Productions's topic in New England
The last frozen for winter 26-27? -
E PA/NJ/DE Summer 2026 Obs/Discussion
ChescoWx replied to PhiEaglesfan712's topic in Philadelphia Region
Kevin I can't wait for less humidity I am over it while not our hottest summer It sure feels like one of our most humid!!