All Activity
- Past hour
-
Approaching 80. July in April.
-
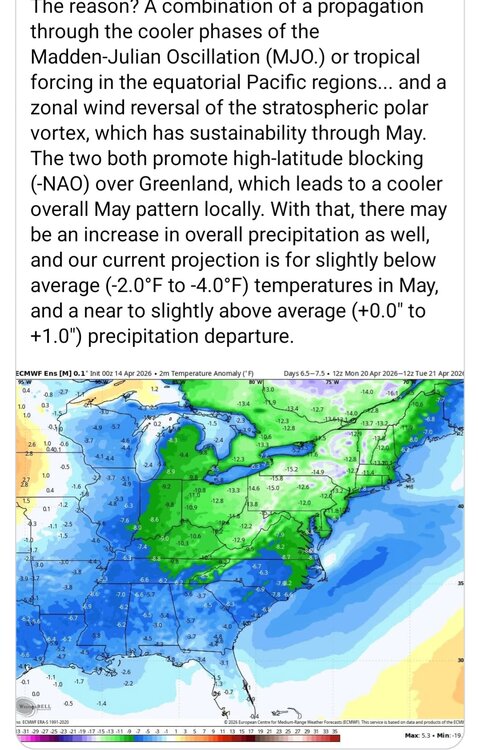
EPAWA weather outlook for May
-
* All time April record at MSP was broken in 2018 with 15.8” during the 4/13-16 blizzard. Brilliant blue skis and bright sun also appeared the next morning.

-
Just too nervous about getting Steined to drop the fert. Certainly can see how it may storm this week, but can easily be total Stein too . Wringing of hands
-
This is more for Wednesday but wild differences between guidance at BOS for tomorrow 6z MAV: 65 0z MET: 57 9z high then dropping 7z NBM: 69 I was actually expecting the 13z NBM to tame down at BOS but nope...came in at 71 . Been that seems wayyyy too high. Highest 3hr value anyways is 64 which still might be a bit high...though BOS might have a chance to climb before the E winds kick in
-
Morning rain is dying off fast, has a feeling it's gonna be one of those days
-
Yeah I doubt much makes it into that green shaded area
-

2026-2027 El Nino
roardog replied to Stormchaserchuck1's topic in Weather Forecasting and Discussion
I feel like a cool summer and fall would be an indication that this Nino could be more Nino like. A warm summer and or fall to me indicates there’s still some Nina/-PDO influence. -
Me either. Guessing it will be very isolated
-
 The Mariana islands gets just about as many high end typhoons as anywhere else I nthe world. Saipan took a direct hit from a cat 5 back in 2018. I am guessing that Saipan didn't get much above cat 2 winds from this, with maybe some higher gusts. Good timing with the ERC.
 -
Interesting, didn't know we were expecting much today.
-
-
Absolutely wild the differences in guidance in how convection develops/evolves tomorrow. the 3km NAM highlights exactly what I was thinking yesterday in terms of potential/evolution but it doesn't have much support. But then again, not one model has support from another. Ahh the fun of convective forecasting
-
Lot of convective rains too.... Could be thundery warmth
-
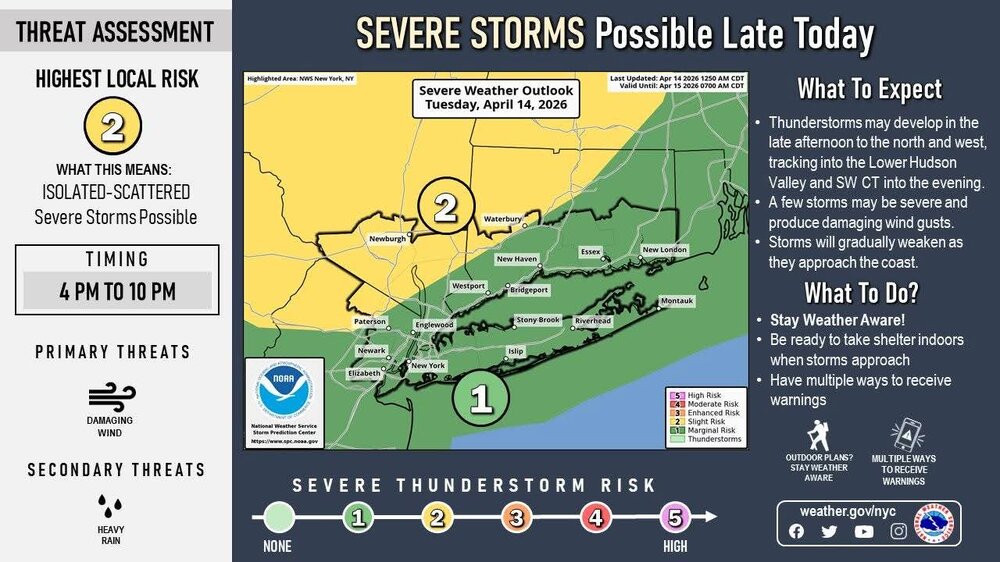
They should. The ENH also needs to be greatly expanded as well, as that secondary zone of interest further south ( C IL) is gaining steam.
-
Summer!
-
Look at the ass hammerin' abuse the NAM afflicts Boston with on this 12z grid for Thur, compared to Albany and New York City... The highlight are the T1 temperature... actual SFC is typically 3 or so warmer than these. Luckily for warm enthusiasts, the wind field at Logan on Thursday is only 8kts so it's not likely moving west of the city... but jeez! OUTPUT FROM NAM 12Z APR 14 26 TTPTTR1R2R3 VVVLI PSDDFF HHT1T3T5 TTPTTR1R2R3 VVVLI PSDDFF HHT1T3T5 ALB//864549 -1800 162203 59151207 BTV//944846 00505 160304 55090706 06000576954 -2996 091917 63241608 06000798766 11400 071510 60161307 12013654356 03797 082814 64231607 12025944631 00999 073110 61151205 18000853022 -3003 122912 62161509 18002973223 -3006 143307 56050708 24000974357 01701 142402 61131509 24000964160 00006 141504 57061207 30001798361 -0196 112111 64201610 30022989263 15800 111708 59111207 36005749067 -2697 102108 66221609 36008959169 03800 102011 60161306 42119999367 03199 090701 65181509 42002997344 -0103 093304 60131007 48052926953 -1701 103106 64161409 48000986339 -1703 110103 59090907 54000717153 -0899 091502 65211408 54000907850 -1004 101503 60131006 60000627337 15997 042119 67241809 60018989567 27599 041111 63151307 BOS//742946 -0203 152811 60171308 LGA//774047 00700 163104 62191709 06000616339 -2501 121410 61211508 06000545045 -1698 132011 64241710 12000725866 02597 082123 66191811 12000535544 -1696 112418 67251911 18005762735 -3499 092718 64191510 18000716556 -0398 122911 65221811 24000802325 -2206 133607 62151610 24000764830 -1297 142408 65201710 30000727561 -2002 141211 63141408 30000596752 -2796 131910 67251811 36002897366 -3098 121612 65131710 36000505148 -3697 112216 70262013 42031989070 24698 091002 66111810 42000685853 04497 102316 69222113 48058989169 -1099 123508 64071410 48000685952 00200 112615 68211713 54001897248 -0402 120408 64081310 54000523744 -1799 092210 70261814 60000985249 03998 111008 65051611 60000422654 -2501 072218 69251913
-
82 now.
-
Tip, Thanks for your reply. We know that the Arctic has warmed considerably more than middle latitudes, especially in winter. Thus, the contrast between the avg Arctic temp. and the avg mid latitude temp has lowered, which has reduced the avg speed of the polar jet. Thus per the source noted below: “A slower and more contorted jet stream allows cold air to move further south and warm air to move further north, and it also allows weather systems to persist longer than usual. Under these circumstances, episodes of severe cold or protracted heat, as the UK experienced in spring and summer 2018 respectively, become more likely.” https://theconversation.com/arctic-breakdown-what-climate-change-in-the-far-north-means-for-the-rest-of-us-123309#:~:text=The exceptional rate of Arctic ( the,and determines the paths of weather systems. But I still have to wonder if this phenomenon along with the up to 3F warmer globe were strong enough factors on their own to result in the W US heatwave being a record producer or would it without CC still have been a record producer but just at a lower level? I don’t see how this can be proven one way or the other. With the extreme heat so much hotter than the prior record, that would be quite the feat for CC’s influence. So, I’m at least for now maintaining what I said on April 3rd: “had there been no GW the US still could have had their warmest month since the late 1970s but with not as warm temps.” All I said on April 3rd was “could”. After all, one would have to prove that it “could not” to conclude that I’m wrong. Fair enough?
-
TORCH!
-
81. First 80s of the season.
-
Ffffttttttt
-
77/61. Ass stuck to undies outside doing yard work.
-
74.1° today - amazing turnaround compared to yesterday
-
Last part of April looks like ass..had a feeling