All Activity
- Past hour
-

2026-2027 Record-breaking El Nino
MJO812 replied to Stormchaserchuck1's topic in Weather Forecasting and Discussion
He blocked me on Twitter -
First time I saw thunder snow. We were on a generator for 4 days. Local DPW left a giant pile of mess at the end of my driveway because someone had never plowed snow before but i digress.
-
 best online canadian pharmacy: CanPointe - canadian pharmacies
 -
mexican medicine: FronteraCare Direct - legitimate mexican pharmacy online
-
Since moving here in 2005, far and away most favorite wx event. Only thing that will top it will be a direct strong cane strike up the CTRV or a TOR thru backyard
-

Yellow Medicine County, MN - Climate Fact or Climate Fiction?
donsutherland1 replied to Cobalt's topic in Climate Change
Thank you for your kind words, ChescoWX. I appreciate them. Have a great evening. -
It will turn somewhat cooler with readings in the upper 50s to near 60° for tomorrow and Wednesday before temperatures again warm into the middle and upper 60s for the remainder of the work week. Much of the region could approach or reach 70° on Friday. Unseasonable warmth will continue into the start of November. Dry conditions will likely persist through next week. The ENSO Region 1+2 anomaly was +5.2°C and the Region 3.4 anomaly was +3.4°C for the week centered around October 14. For the past six weeks, the ENSO Region 1+2 anomaly has averaged +5.08°C and the ENSO Region 3.4 anomaly has averaged +3.22°C. ENSO Region 3.4 breaks the all-time record most recently set in the prior week. The ongoing strong El Niño, will continue to strengthen through the mid-fall. The SOI was +9.35 today. The preliminary Arctic Oscillation (AO) was +1.221 today. Based on sensitivity analysis applied to the latest guidance, there is an implied near 97% probability that New York City will have a warmer than normal October (1991-2020 normal). October will likely finish with a mean temperature near 59.5° (1.6° above normal). Supplemental Information: The projected mean would be 2.6° above the 1981-2010 normal monthly value.
-
I’ll say I’ve been fringed in a lot of SNE storms but that’s the only one I’m still jealous of. We got 1.5” lol. What a remarkable event.
-
I really don’t know . That was a hot month , so I would heavily lean no. That morning for the last 2-3 hours of the storm dropped into upper 20’s after 31. 5 paste all night . The last inch or two was powdery
-
Had you hit 32F or lower in 2011 before the Rocktober snowstorm?
-
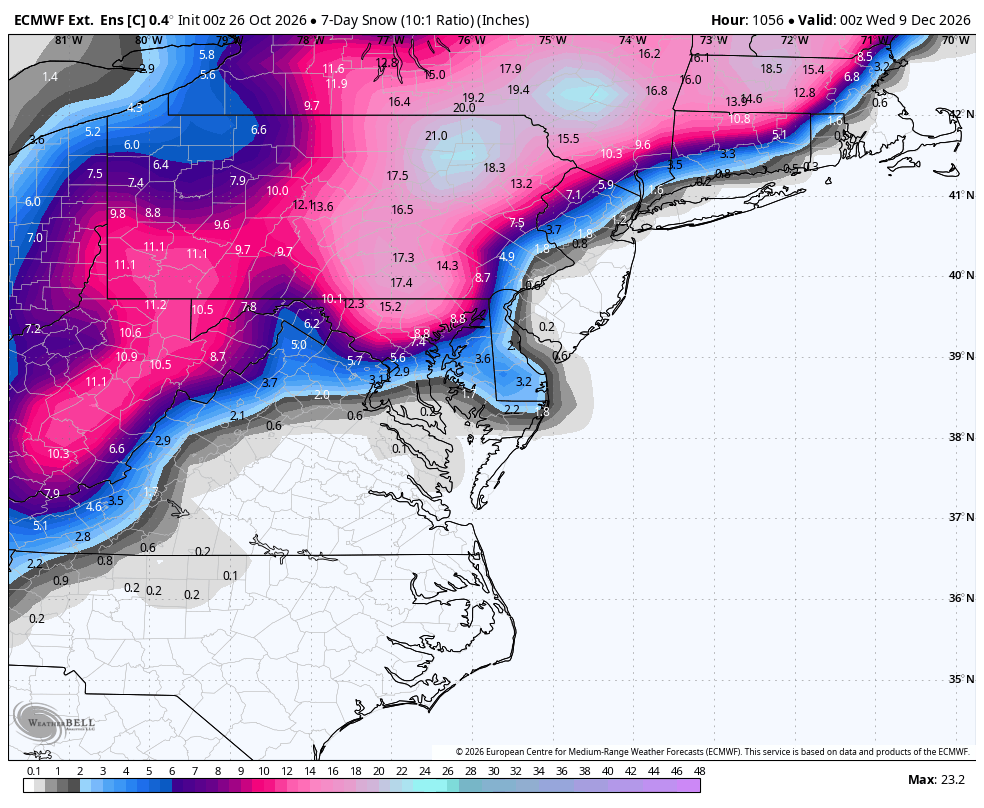
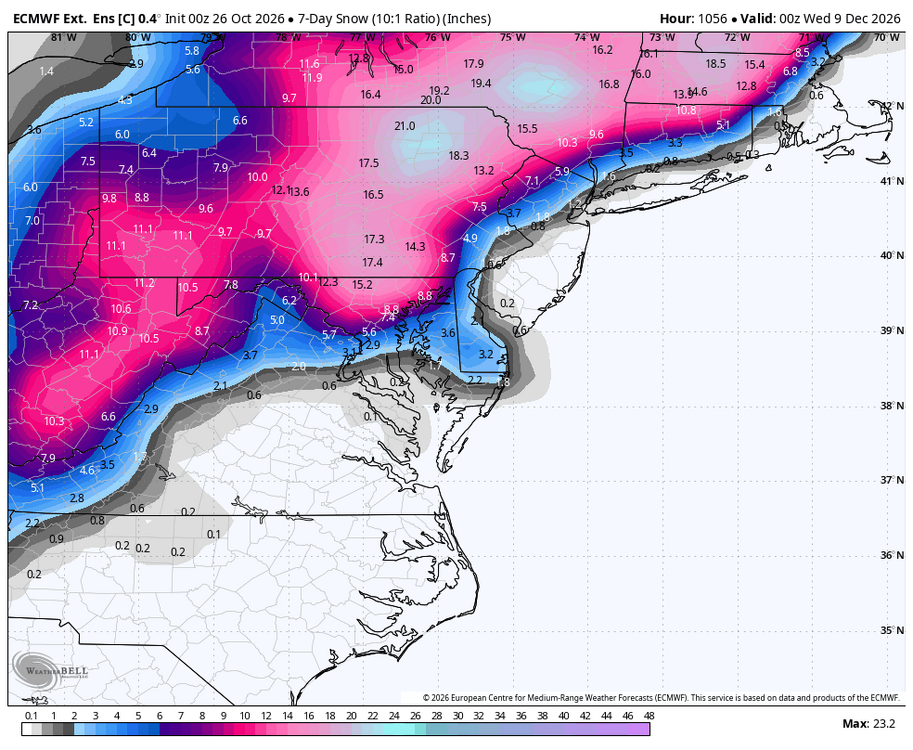
WB latest EPS weeklies control. First week of December is less than 5 weeks away!!!
-
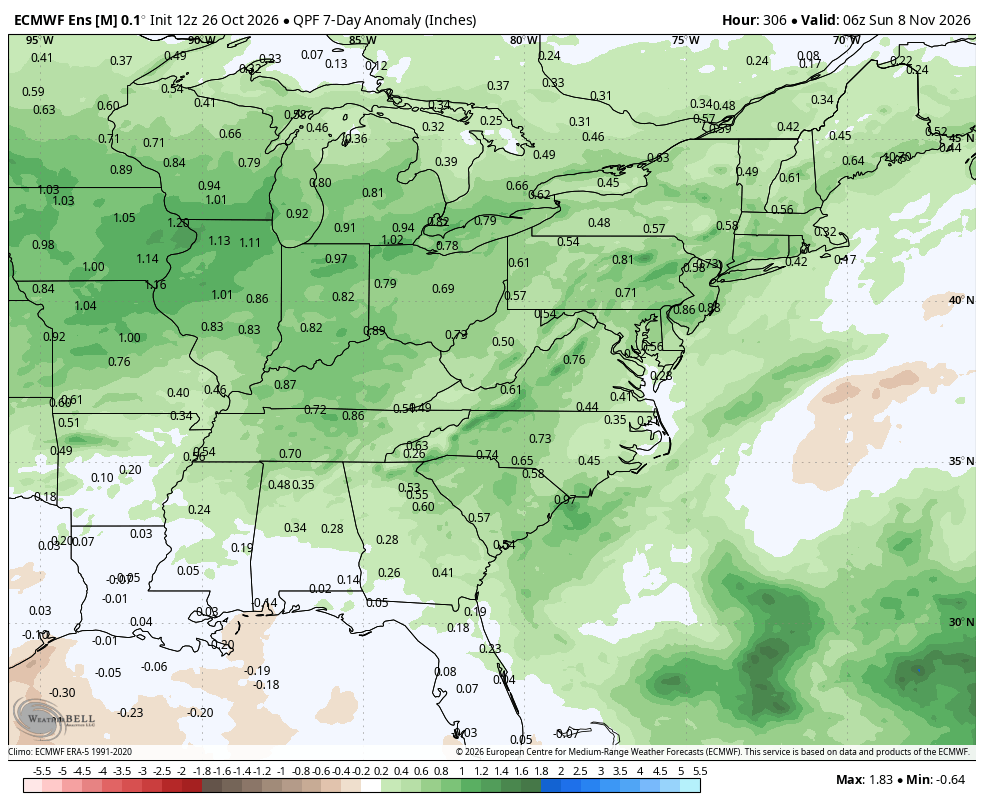
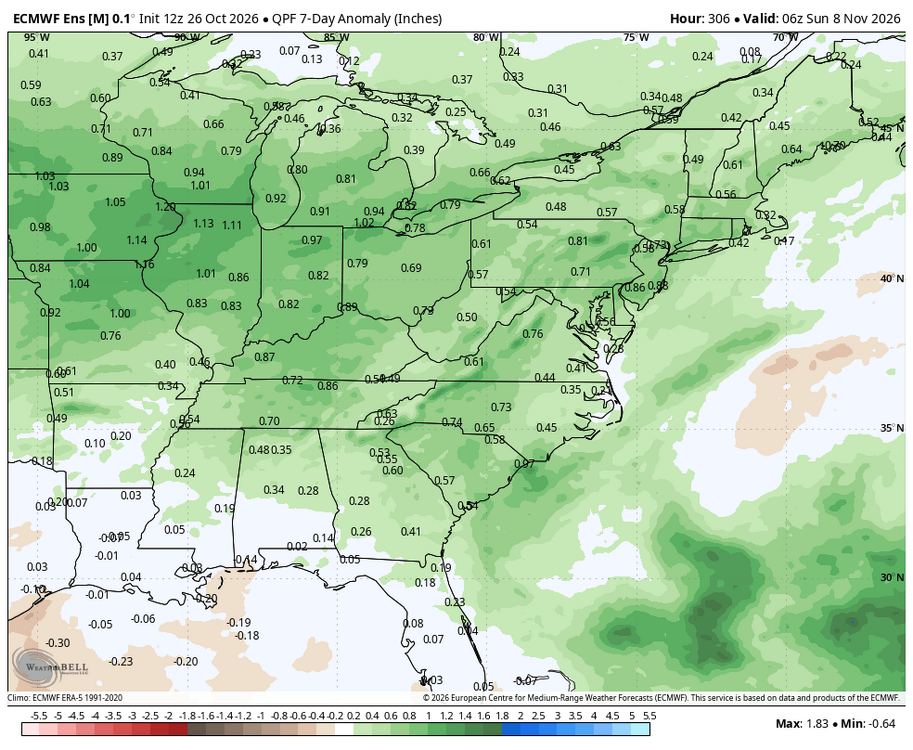
WB 12Z EPS. Next week looks wet.
-
Sizable full moon...noticed it last night from Vegas (been out west the last couple weeks).
-
Good to be back, gentlemen. I'll take your coats. Drinks are in the back.
-
http://zenithindusrx.com/# online drugstore
- Yesterday
-
That’s probably longer here . I recall a HFD marathon I ran in mid 2010’s and left here at about 5:00 AM and it was 28 degrees. That’s always run 2nd weekend of Octorcher . Only Oct in last 15 I can remember a freeze that early here
-
2026-2027 Record-breaking El Nino
40/70 Benchmark replied to Stormchaserchuck1's topic in Weather Forecasting and Discussion
And refuse to acknowledge it....(not Adam). -
That’s kind of wild. FROPA through here, some decent NW gusts.
-
ORH hasn’t had a freeze before November since 2020.
-
2026-2027 Record-breaking El Nino
40/70 Benchmark replied to Stormchaserchuck1's topic in Weather Forecasting and Discussion
CC trolls will disappear if it ever fails....like they did last year.....either that, or have a circle jerk over how warm it was in New Mexico if they can't troll us. " I realize you just had a NESIS 4 event, and a Feb system that rivaled 1978 in SE NE in the midst of your coldest winter in over a decade, but the warmth in New Mexico was more anomalous than the cold in the NE". Funny thing is it still proves the point that even though the climate is rapidly warming, these patterns remain cyclical and will largely even out over time independent of the background warming. I know there was some talk that we were going to be in the MC for the rest of eternity give or take, but if ya don't know....now ya know. -
2026-2027 Record-breaking El Nino
40/70 Benchmark replied to Stormchaserchuck1's topic in Weather Forecasting and Discussion
I don't think that means anything...early 1983 got cold via wave 1 reflection, which this season is better suited for than 1998 was due to the strat and especially the sun. TBH reflection is a far safer bet for wintry impacts than strat warming, which is hit or miss. -
Expectations are so low this season that I predict the only posts that will take place in the banter/complaint thread this winter will be Brian's daily almanacs.
-
I mean it’s November 12th
-
2026-2027 Record-breaking El Nino
EasternLI replied to Stormchaserchuck1's topic in Weather Forecasting and Discussion
~50% of the 12z eps with reversals at 10mb today. Increased % on the 12z GEFS today too from ~25% yesterday. Really curious how this all ends up. It doesn't automatically mean cold for anyone if that happens. Never does. It could mean torch... These things are never cut and dry. Just watching for now... -
the metric for "very likely" is 90%; what is the "smashed" metric? is that one week ? are you forecasting a first temp of 32F or lower for Worcester on or after November 19 ?