All Activity
- Past hour
-
Trying real hard to not kick heat on. Go pellet stove go
-
At least those mid-60's are coming for us tomorrow, but yeah, today is in the shitter.
-

2026-2027 El Nino
snowman19 replied to Stormchaserchuck1's topic in Weather Forecasting and Discussion
-
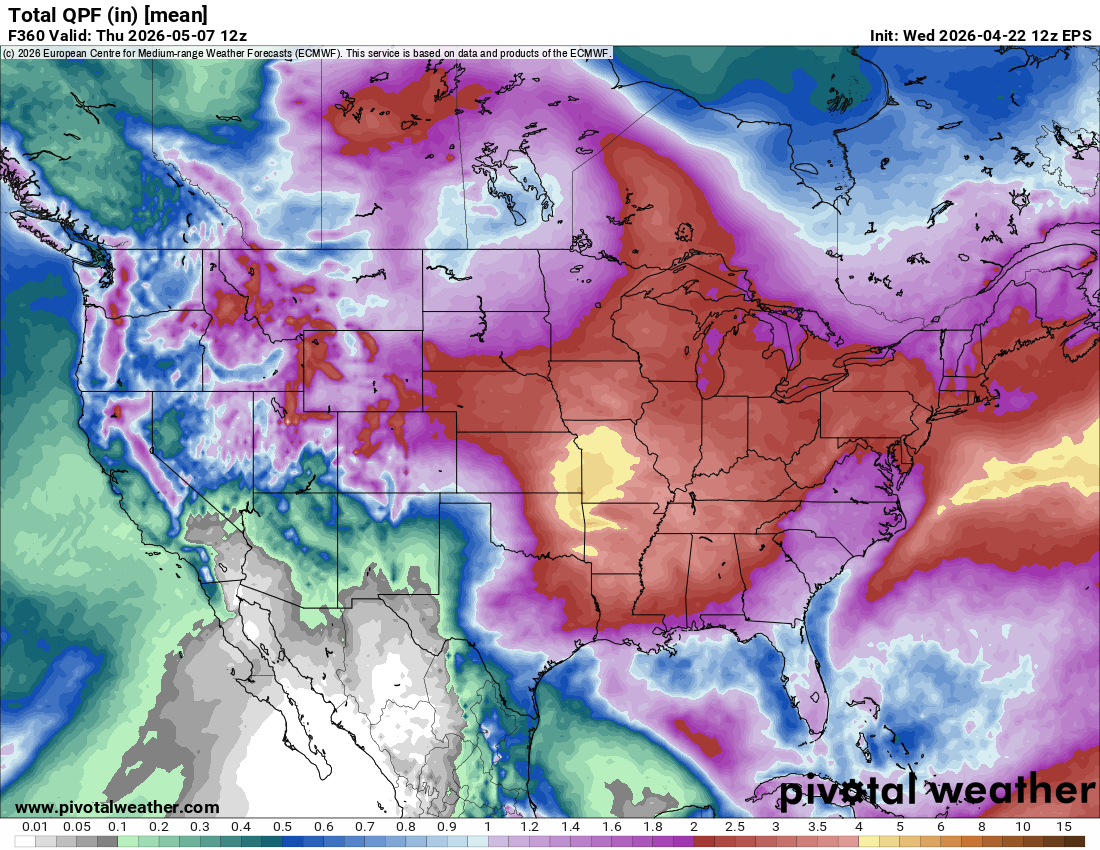
Less than 2 inches of rain in 16 days in late April/Early May is closer to average than being wet.
-
2026-2027 El Nino
snowman19 replied to Stormchaserchuck1's topic in Weather Forecasting and Discussion
+6C subsurface anomalies showing up now -

Occasional Thoughts on Climate Change
TheClimateChanger replied to donsutherland1's topic in Climate Change
I was looking at some data for Pittsburgh and, with GPT’s help, calculated the annual and monthly trends for periods starting in 1960, 1970, 1980, 1990, and 2000 (all using May–April data). For the first four start dates, warming is pretty insensitive to the choice of starting point — it comes out to roughly ~6°F per century in each case. However, starting in 2000, the trend is nearly double that rate (see table of trends below). Start Year Period Trend (°F/decade) Trend (°F/century) 1960 1960–2026 +0.59 +5.9 1970 1970–2026 +0.60 +6.0 1980 1980–2026 +0.62 +6.2 1990 1990–2026 +0.58 +5.8 2000 2000–2026 +1.14 +11.4 The obvious caveat is the shorter time window. I intentionally didn’t go any shorter than 2000 because it quickly becomes too noisy to draw meaningful conclusions. With that in mind, I wanted to get a sense of what the climate might look like 50 years from now. The table/graphic shows a range: Low end: continuation of the long-term trend (1960–present) High end: continuation of the more accelerated warming seen since 2000 This shouldn’t be interpreted as a true “high-end forecast.” If anything, one could argue warming may continue to accelerate as CO₂ increases and feedbacks come into play. This is simply a trend-based extrapolation, not a model projection. A couple interesting takeaways: Winter shows the largest absolute changes Summer warms less in °F, but still shifts meaningfully given its low variability November consistently stands out as a relative laggard Curious what others think, especially regarding the seasonal differences and whether similar patterns show up in nearby regions. A couple quick notes on the table: “Recent” refers to the most recent 7 years (May 2019 through April 2026), so it should be thought of as a snapshot of the current climate rather than a formal 30-year normal. The 2070s range is not a forecast — it’s simply an extrapolation of observed trends: Low end = continuation of the long-term (~1960–present) trend High end = continuation of the more accelerated warming seen since ~2000 Importantly, this should not be interpreted as a true upper bound. If anything, actual warming could end up higher than shown here if the recent acceleration continues or increases due to rising CO₂ and amplifying feedbacks. This is just a simple trend-based framework to give a sense of scale. -
relief for the downstate screw zone incoming?
-
A rare (the first this season?) warm spring day here with very calm winds. usually we pay a price with these 60s/70s, but thankfully not today
-
Occasional Thoughts on Climate Change
TheClimateChanger replied to donsutherland1's topic in Climate Change
That’s not inconsistent at all—those are two completely different contexts. When I post here, I’m discussing weather in the U.S. on a U.S.-focused forum. That’s the scope of the discussion, and everyone does the same thing. But when you’re evaluating a scientific paper making broader claims about climate behavior, scope absolutely matters. If a study is U.S.-only, that’s an important limitation that needs to be acknowledged before drawing bigger conclusions. On the Canada point, focusing on a cold spell there would actually be the cherry-pick. Short-term regional cold anomalies happen all the time, even in a warming world. The broader context right now is near-record global warmth, so isolating one region’s cold period doesn’t really tell you much about the overall climate signal. So the distinction is pretty simple: Talking about regional weather → it’s perfectly fine to focus on the U.S. Evaluating climate claims in a paper → you have to be clear about geographic limits and not overextend them Those aren’t contradictory standards—they’re just applying the right frame to the right situation. -

E PA/NJ/DE Spring 2026 Obs/Discussion
RedSky replied to PhiEaglesfan712's topic in Philadelphia Region
Many records set with the Tuesday morning cold Latest 24F or lower in Allentown, previous record 28F. Latest 29F in Harrisburg. Latest 17F in Bradford since 1981. Altoona 24F old record 26F. Scranton 24F old 26F All that just days after temps near 90 -
Well we are paying the price for last week. This is crappy weather for anytime of year but not abnormal for April. Hopefully the trend improves for may. .
-
You’re saying how this being U.S. only limits how broadly you can interpret it. But at the same time, many of your recent posts ITT have been U.S. only! You wouldn’t even consider the intense cold in Canada in March. You’re not being consistent.
-
E PA/NJ/DE Spring 2026 Obs/Discussion
RedSky replied to PhiEaglesfan712's topic in Philadelphia Region
May 2005 repeat being thrown around in the northeast forum. Nope don't want that not in anyway. Weeklies look brutal. -
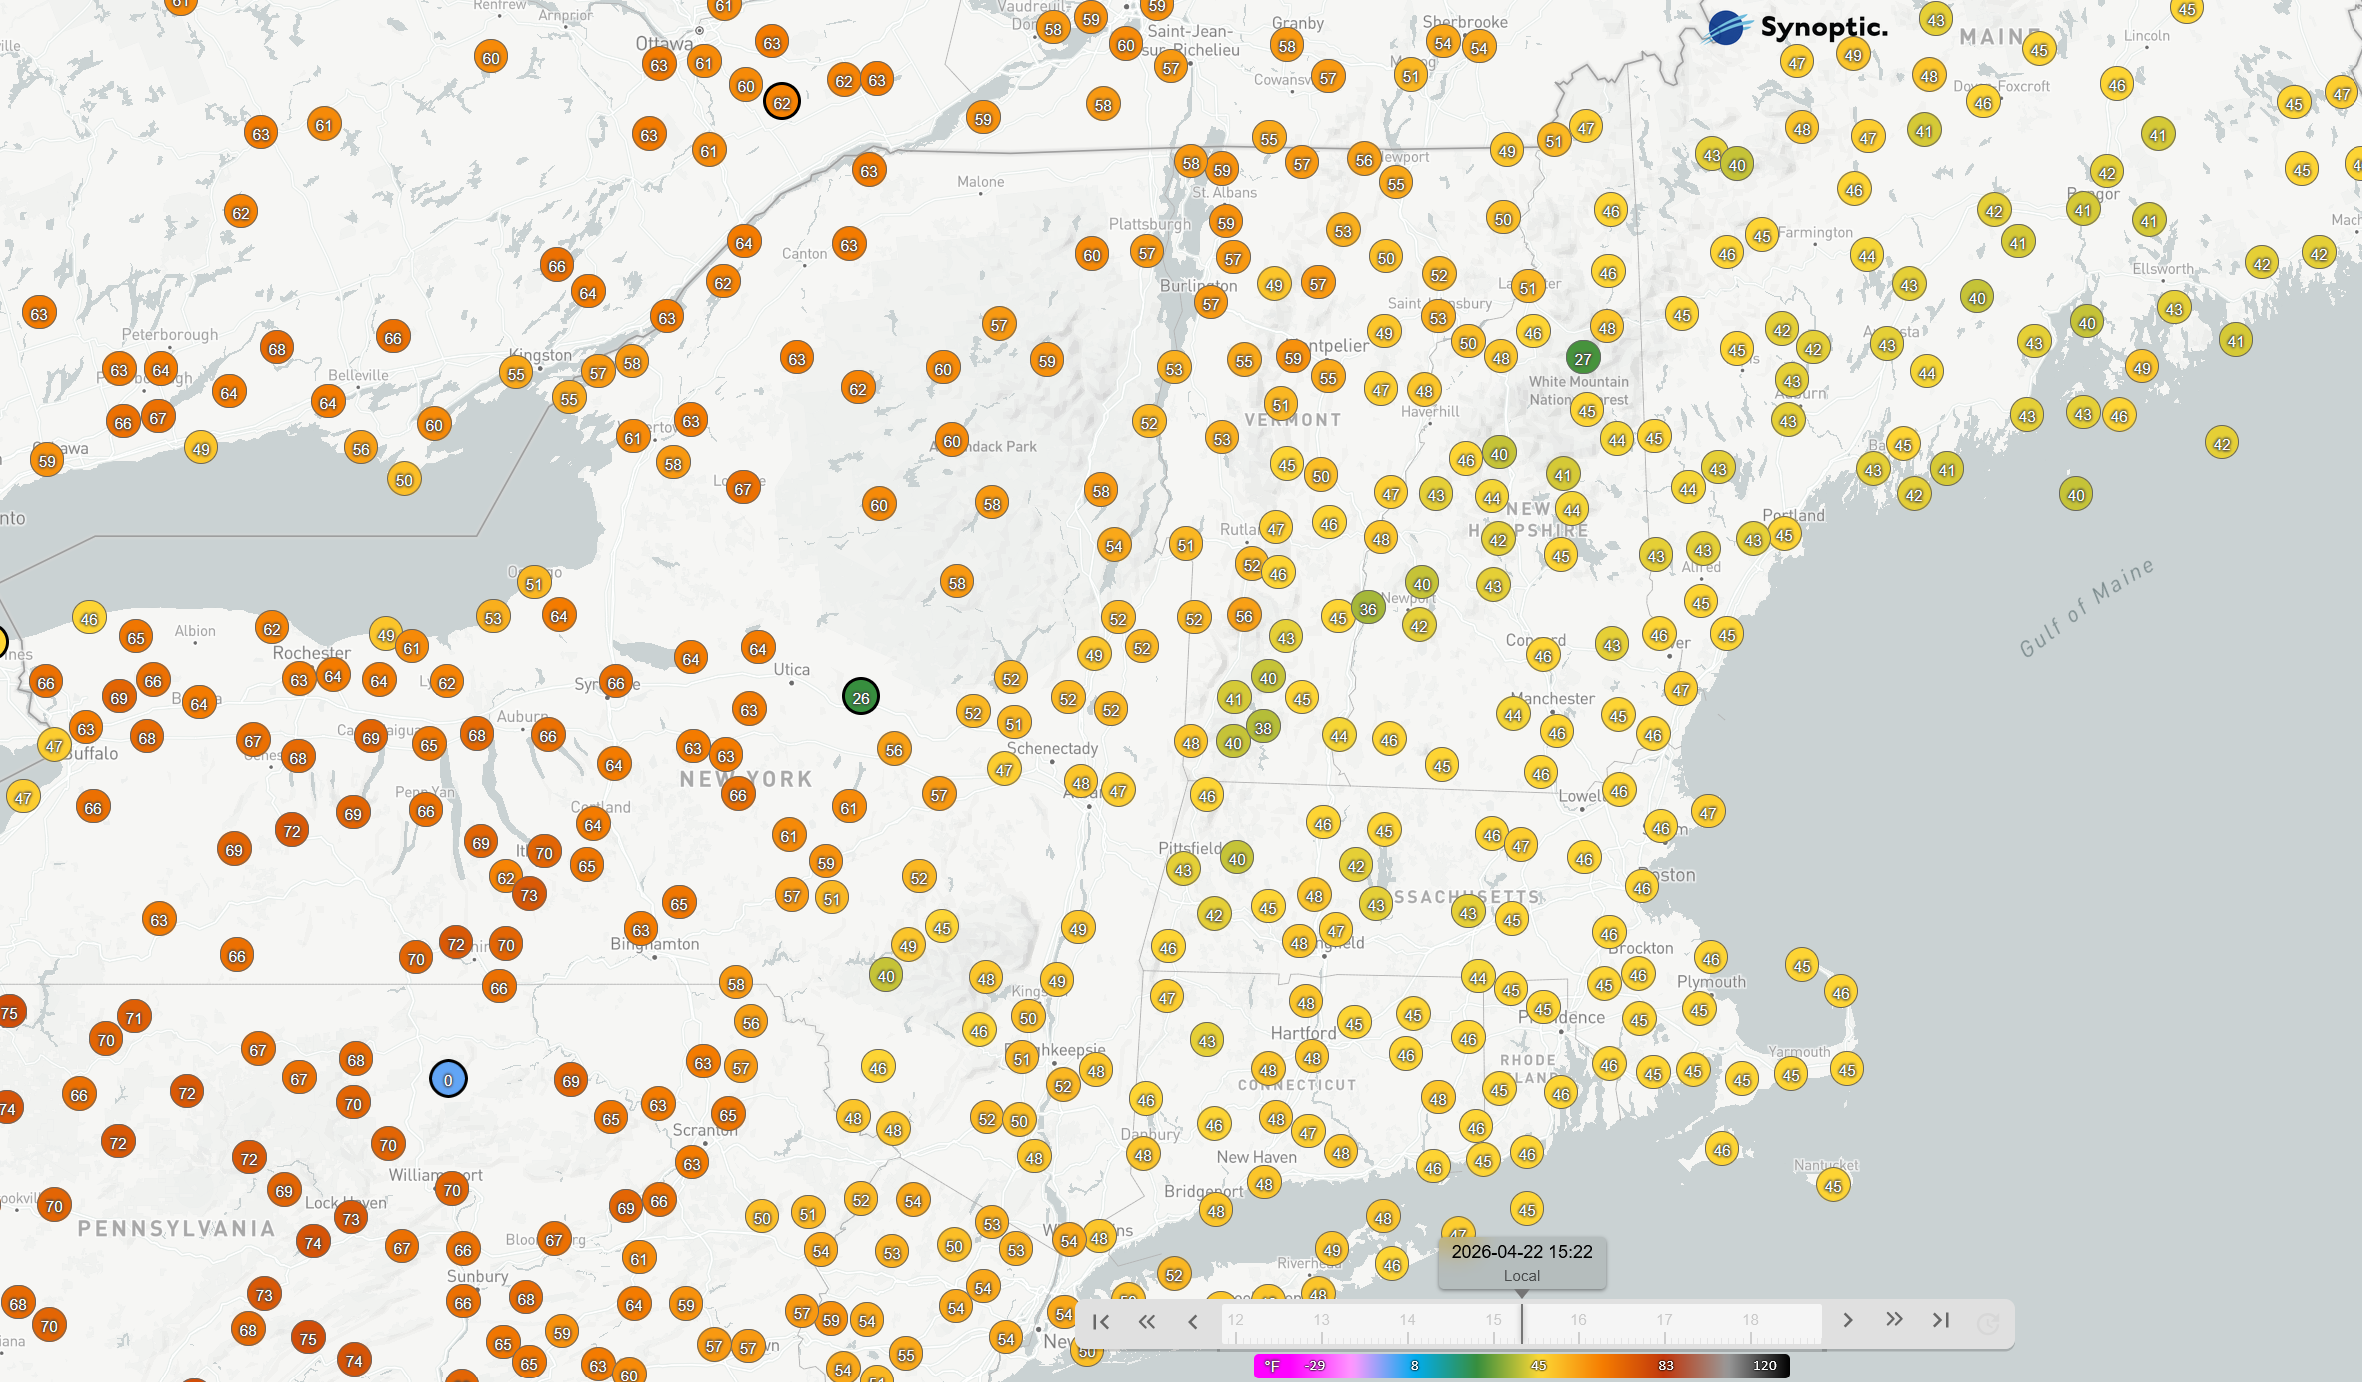
The south colder than the north…sucks ass here today..horrid!
-
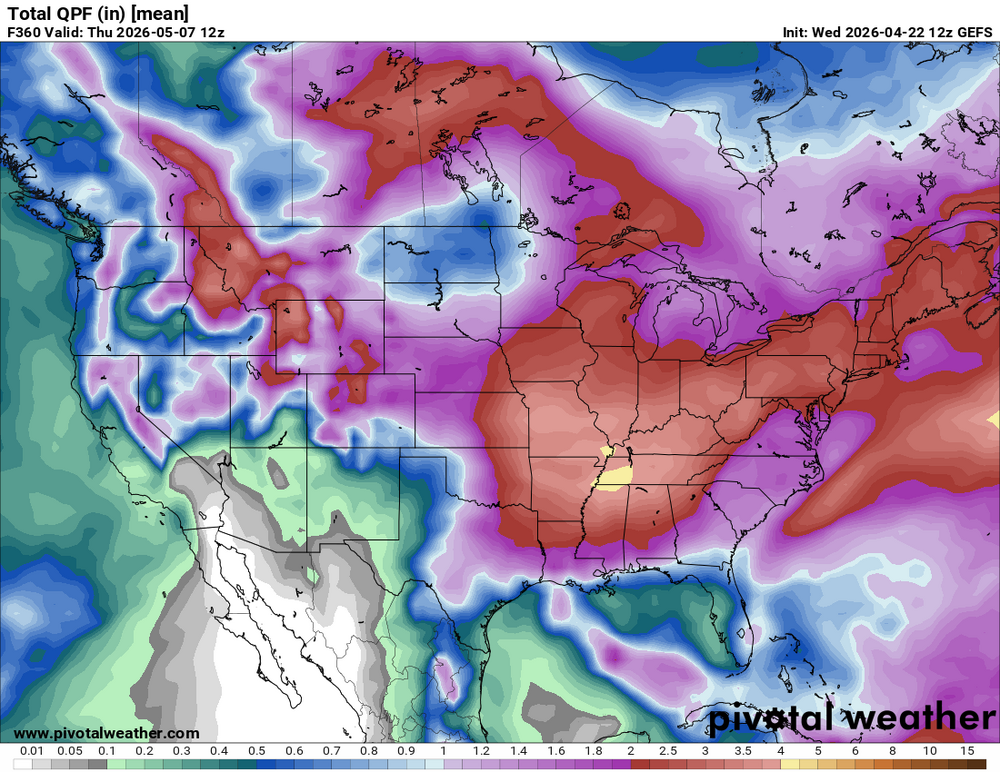
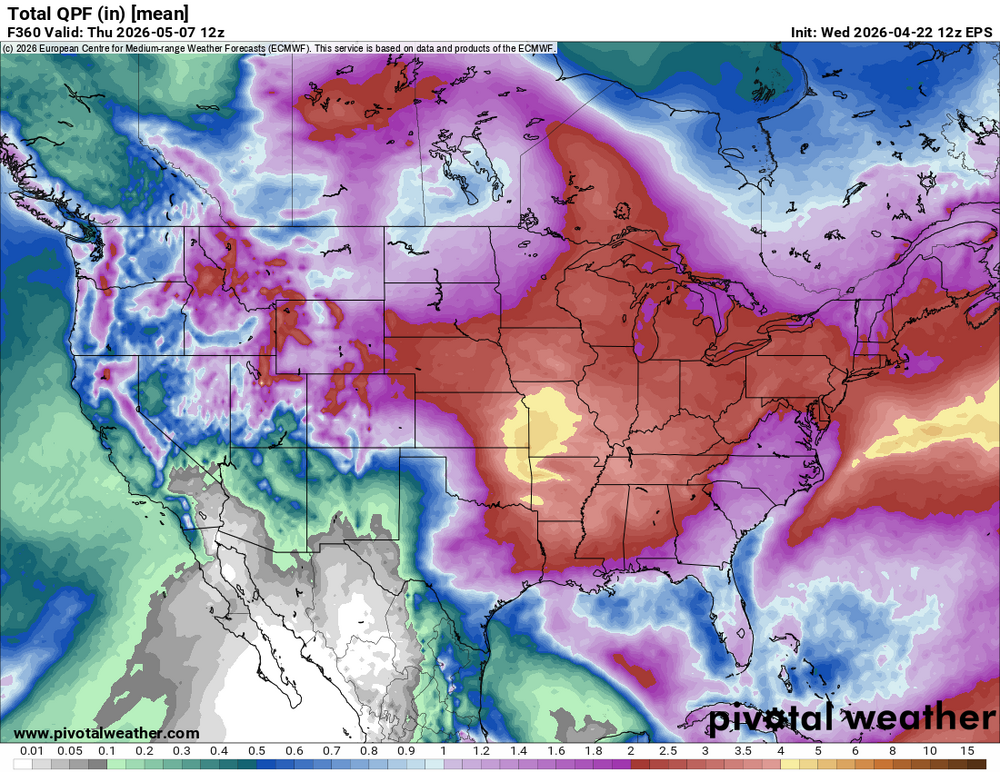
Ensembles people. Also the rainfall potential this weekend was always paltry (few models more than .25), the wetter period starts later next week and has mostly held the course
-
Let’s hope we don’t get into a slow to erode blocking situation.
-
I notice sometimes northeast TN (Tri cities especially east of MRX) can get going in the early afternoon on what's otherwise a Carolina day. That's mainly later in the season. Carvers may be talking about other examples. All I know is that it frustrates me to no end. I'm not going to chase east initiation, because it creates a long drive home. Euro came in a little hotter Monday. Nothing major but definitely supports a severe weather D6 outlook. Winds from 850 to 500 turn pretty well nearly 60 degrees vs say 45 deg. LLJ is still shown weakening / lifting north. That latter detail and/or any midday rain keeps Monday off the crazy train. Definitely watch it though.
-
E PA/NJ/DE Spring 2026 Obs/Discussion
RedSky replied to PhiEaglesfan712's topic in Philadelphia Region
Thankfully today's ECM has 70's May 1st followed by only a few days in the 50's -
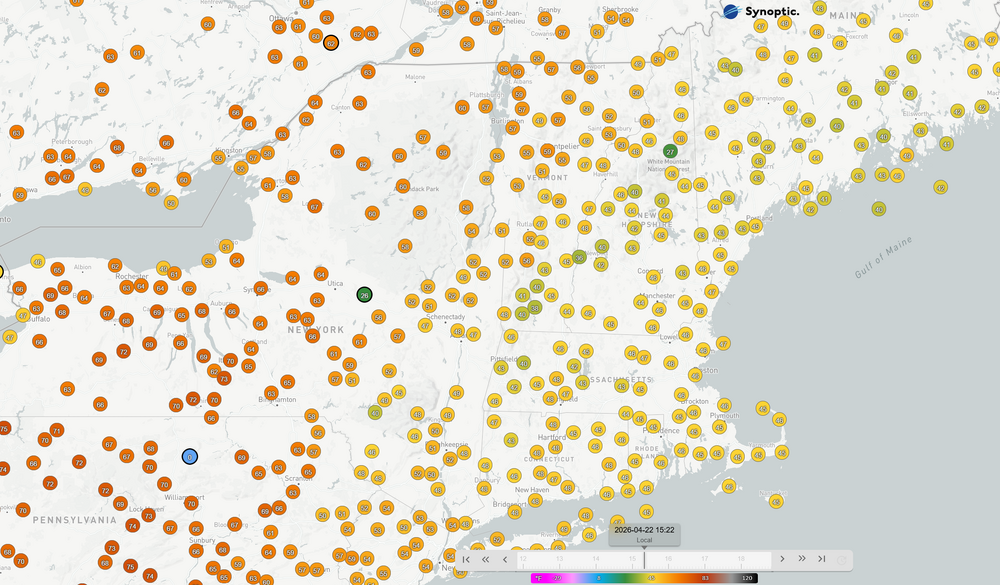
60° and sunny here at WXW2. 47.8° at WXW1.
-
Also- this aint gonna cut it
.thumb.png.238ee49ecfc60fec51a5757ff6288366.png)
-
Models are hinting at more cold/frost for mountains/foothills in early May.
-
Gunkfest. Hopefully tomorrow’s better but looks like we’re socked in for the weekend. We pay and pay dearly for last week.
- 787 replies
-
- 1
-

-
- april showers bring may..
- rain
- (and 2 more)
-
mostly 50's and 60's, as we thought days ago. nbd
- Today
-
Occasional Thoughts on Climate Change
TheClimateChanger replied to donsutherland1's topic in Climate Change
I’ve read through the Christy & Spencer paper and I think it’s worth discussing, but a lot of the conclusions depend heavily on how the analysis is set up. First, it’s U.S.-only, which already limits how broadly you can interpret it. The U.S. is a small, noisy region with a lot of land-use influence, and it’s not necessarily representative of global behavior. Second, they lean on minimally adjusted station data, which is not a neutral choice. One big issue there is time of observation bias (TOBs)—earlier stations often used afternoon observation times, which can effectively double-count hot days across two calendar days. That tends to inflate extreme heat in the early part of the record relative to today, when observations are mostly taken in the morning. If you don’t correct for that, you’re giving early decades a built-in advantage in heat extremes. On top of that, the way “extremes” are counted matters a lot. If you’re relying on record-setting events and not handling ties properly (or only counting first occurrences), later decades are inherently disadvantaged. Early in the record, everything is a “new record.” Later on, even in a warmer climate, you’re more likely to tie or narrowly exceed previous values. If ties aren’t treated equally, you can manufacture a downward trend in “new extremes” even if the underlying distribution is shifting warmer. Another big limitation is that the analysis focuses almost entirely on summer high extremes and winter low extremes, which is a pretty narrow slice of the climate system. It doesn’t really tell you anything about extreme warmth in winter, spring, or fall—which is where a lot of the warming signal actually shows up—or about the broader shift in temperatures. Summer daytime highs (Tmax) are one of the least responsive variables in many parts of the U.S., especially in the East. And this is where land-use changes become critical. The eastern and central U.S. have undergone significant reforestation over the past century after being heavily clear-cut, which increases evapotranspiration and tends to suppress daytime highs. At the same time, the Midwest has seen an explosion in corn and soybean agriculture, and those crops transpire enormous amounts of water—far more than the historical landscape. That effectively adds a massive, artificial cooling mechanism during the growing season. So you’ve got large parts of the country where land surface changes are actively dampening summer heat extremes, even as the broader climate warms. Meanwhile, more arid regions in the West—where you don’t have that same vegetation-driven cooling—show increasing heat extremes, which is more in line with expectations. On top of that, the 1930s Dust Bowl looms large in any long-term U.S. extremes analysis. That period featured extreme heat driven in large part by land degradation and drought—largely human-influenced surface conditions. If your methodology already favors early extremes (via TOBs and record-counting asymmetry), and you anchor the dataset with the most extreme decade in the record for partly non-climatic reasons, you’re stacking the deck toward showing a long-term decline. There are also the usual issues with long-term station data—station moves, instrument changes, siting differences, etc. Homogenization is meant to deal with those. Skipping it doesn’t remove bias, it just means you’re accepting a different set of biases, many of which tend to inflate earlier extremes relative to modern ones. To be fair, the paper is very likely correct that cold extremes are declining—that’s one of the most consistent and physically well-understood signals in the observational record. It’s also true that regional trends (especially in the U.S.) can look different due to land-use effects. But the headline claim about declining heat extremes is much more questionable and looks heavily dependent on methodology. At a minimum, this analysis is incomplete—it’s looking at a narrow set of metrics that are least likely to show strong warming signals and then generalizing from them. If you actually want to understand how extremes are changing, you need to look at the full temperature distribution, across all seasons, with methods that account for known observational biases and major land surface changes. -
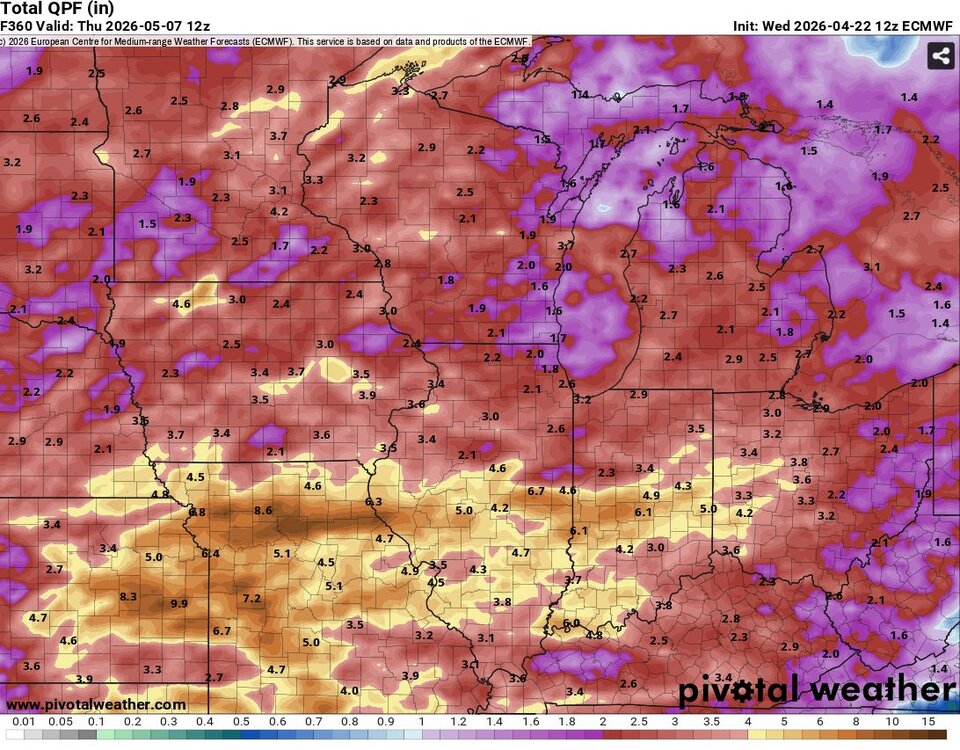
Quickly turning into May 05. Sucks balls.


.thumb.jpg.ad3a2e31d30aff035044689b311a0540.jpg)


.png.6a492a0bc46566233c1754aff93bef18.png)

.thumb.gif.f92b16c631a1d15d405ed77b33f0710d.gif)
