bluewave Posted December 28, 2019 Share Posted December 28, 2019 2 hours ago, binbisso said: Bluewave the next seven days the mjo is forecast to be in 7 and 8 how come we are going to be well above normal in this timeframe There can be a lag between the MJO and its effects. But depending on the overall pattern, the results can be more in real time. So the mild start to January can be the continuation of this 5-6 influence. A cool down a few days later would be in line with 7 or even 8. Beyond that, a move back to 4-6 would cause another temperature rebound should the models be correct. But there is plenty of time to watch that. Don has an excellent discussion in the January thread. 2 Link to comment Share on other sites More sharing options...
bluewave Posted December 28, 2019 Share Posted December 28, 2019 2 hours ago, frd said: The theme of post 12/20 warm ups the last few years is remarkable, almost as if the MJO knew the time of year. Also, it seems in this day and age any monthly negative departure has to be really extreme and significant to stand up to eventual warmth that hits us almost every month, including the higher min temps as well. The calls for an above normal December in the temp department were good calls. However, looking back at the last 10 years persistence forecasting would have been correct without ever considering the models, or fundamental meteorology. Thought for a brief moment winter was going to start early this year, but it was simply a head fake, part of the possible new trend of warm Octobers leading to colder Novembers and then the eventual warm up after mid December. Excellent post. That’s why the events this month were right in line in with recent experience You can see the emergence of this new pattern after 1981. But it became more pronounced in recent times. 2 Link to comment Share on other sites More sharing options...
donsutherland1 Posted December 29, 2019 Share Posted December 29, 2019 Temperatures again rose into the 50s in the Middle Atlantic region. Parts of the region saw temperatures top out in the 60s. Baltimore had a high temperature of 65° and Washington, DC had a high temperature of 67°. December will close on a generally mild note. It will also see one last storm bring a widespread 0.50"-1.50" precipitation to the region. As a result, Allentown will very likely reach 60" precipitation for a record second consecutive year and Scranton could reach 50" for a record second consecutive year. 2019 will also rank among the 30 wettest years on record for New York City. Through December 27, monthly anomalies for select cities were: Baltimore: +1.5°, Boston: +1.4°, Islip: +0.3°, New York City: -0.3°, Newark: -0.1°, Philadelphia: +0.1°, and Washington, DC: +0.7°. A short-duration cold shot is possible late in the first week of January into the second week of January. Nevertheless, there is a growing risk that New York City and Newark could have an average temperature near or even above 40° for the first week of January. Afterward, the predominant state of the EPO will likely be crucial to the persistence of any colder patterns. The 18z GFS forecast the EPO to fall to an all-time record below -5.000 in the extended range. Neither the GEFS nor EPS show anything like that. Hence, the 18z GFS solution beyond 300 hours could be suspect. Based on the forecast strongly positive AO to start January, the probability of a significant (6" or greater snowstorm) for the major cities of the Middle Atlantic region during the first week of January is low. Since 1950, the biggest snowfall for that region when the AO was +2.000 or above during the January 1-15 period occurred during January 14-15, 1954 when Philadelphia received 3.0" snow and New York City picked up 2.0". Boston has had numerous 6" or greater snowstorms during such cases, including one 10" or greater snowstorm. Therefore, the risk of significant snow would likely be greatest over New England assuming this relationship holds (no significant offsetting variables). Despite the development of a sustained colder than normal temperature regime, Utqiagvik (formerly Barrow) is nearing the end of its warmest year on record. 2019 will likely conclude with a mean temperature of 20.9°. The existing record is 18.9°, which was set in 2016. Currently, 2017 ranks as the second warmest year and 2018 ranks as the fourth warmest year. The ENSO Region 1+2 anomaly was +0.4°C and the Region 3.4 anomaly was +0.6°C for the week centered around December 18. For the past six weeks, the ENSO Region 1+2 anomaly has averaged +0.12°C and the ENSO Region 3.4 anomaly has averaged +0.56°C. The remainder of winter 2019-2020 will likely feature neutral-warm to weak El Niño conditions. The SOI was -12.04 today. Today, the preliminary Arctic Oscillation (AO) figure was -1.339. No significant stratospheric warming event appears likely through January 6, but warming will likely develop in the upper stratosphere and approach or reach 5 mb toward the end of the first week of January. Wave 2 activity will remain relatively muted at 30 mb through most of the first week of January, but a moderate Wave 2 hit could occur at or above 10 mb leading to the upper stratospheric warming. Overall, most of the stratosphere is forecast to remain cold through most of the first week of January on the EPS. On December 27, the MJO was in Phase 7 at an amplitude of 1.510 (RMM). The December 26-adjusted amplitude was 1.581. Since 1974, there were five cases when the MJO was in Phase 6 at an amplitude of 1.500 or above during the December 20-31 period, as has been the case this year. The temperature anomalies were closely tied to how much time the MJO spent in Phase 8 during that timeframe. The mean temperature for cases with more than 5 such days was 29.0° in New York City. The mean temperature for those with 5 or fewer such days was 36.1°. The overall 1981-2019 mean temperature for January 1-15 is 33.8°. Based on sensitivity analysis applied to the latest guidance, there is an implied 96% probability that December will wind up warmer than normal in New York City with a monthly mean temperature near 38.5°. At present, a warmer than normal January appears likely in the region. Link to comment Share on other sites More sharing options...
doncat Posted December 29, 2019 Share Posted December 29, 2019 My station Dec record for precipitation is 8.17" set way back in 1983...Total so far is 6.80" so it's doable. This after 11 straight dry days. Link to comment Share on other sites More sharing options...
CIK62 Posted December 29, 2019 Share Posted December 29, 2019 The last 3 days of December are averaging 45degs., or about 12degs. AN. Month to date is now +0.2[38.3]. At this train wreck pace, December should end near +1.4[38.9]. The first 5 days of January are already averaging 43degs. 44* here at 6am 48* by 9am. Back to 47* at Noon. (variable and going nowhere today.) All models have cold and some sort of snow event, but that is near Jan. 07. "Give me Snow or give me the Hottest January ever" 1 1 Link to comment Share on other sites More sharing options...
bluewave Posted December 29, 2019 Share Posted December 29, 2019 It’s fitting that we should get one more rain event to close out December. JFK already had its wettest December on record. You can see how wet our climate has become with the top 3 wettest Decembers since 2014. Time Series Summary for JFK INTL AP, NY - Month of Dec Click column heading to sort ascending, click again to sort descending. Rank Year Total Precipitation Missing Count 1 2019 7.17 3 2 2014 7.04 0 3 2018 6.76 0 4 1986 6.73 0 5 2009 6.25 0 6 1969 6.16 0 7 1983 6.14 0 8 1974 6.07 0 9 1948 6.05 0 10 1996 6.00 0 Link to comment Share on other sites More sharing options...
NYCweatherNOW Posted December 29, 2019 Author Share Posted December 29, 2019 GfS and Cmc have a snowstorm for January 7th timeframe. Snow is coming for sure the geese now the models showing it 1 Link to comment Share on other sites More sharing options...
donsutherland1 Posted December 29, 2019 Share Posted December 29, 2019 Another wet year in much of the region is concluding. At 8 am, rain was falling in Detroit and Indianapolis. Rain was also pushing into western Pennsylvania and western Maryland. Following the rain, Chicago and Indianapolis could approach or exceed their daily record high temperatures. Those records are: Chicago: 63°, 1984 and Indianapolis: 66°, 1889. Chicago also has a high probability of surpassing its daily record high minimum temperature of 42°, which was set in 1884. In fitting fashion for what has been a wet year, much of the northern Middle Atlantic and southern New England regions will likely pick up 0.50"-1.50" precipitation with some locally higher amounts from the upcoming system. Central New York State into central New England, especially higher elevations, could be in line for a significant freezing rain event. Year-to-Date Precipitation Figures and Rankings Scenarios are posted below: 1 Link to comment Share on other sites More sharing options...
Yanksfan Posted December 29, 2019 Share Posted December 29, 2019 29 minutes ago, NYCweatherNOW said: GfS and Cmc have a snowstorm for January 7th timeframe. Snow is coming for sure the geese now the models showing it Euro shows it too. Hopefully the models latches onto the idea and we have a legit storm to track. Believe me we need this with all the cliff diving going on in recent days. 1 Link to comment Share on other sites More sharing options...
donsutherland1 Posted December 29, 2019 Share Posted December 29, 2019 46 minutes ago, Torch said: I Wonder what the January’s precip totals like these years. January Precipitation for JFK 2020: TBD 2015: 5.31" 2019: 4.01" 1987: 5.62" 2010: 1.67" 1970: 0.56" 1984: 1.60" 1975: 5.05" 1949: 5.77" 1997: 2.37" 1 Link to comment Share on other sites More sharing options...
uncle W Posted December 29, 2019 Share Posted December 29, 2019 the squirrels are very active this morning in the Poconos...somethings up... 1 Link to comment Share on other sites More sharing options...
sussexcountyobs Posted December 29, 2019 Share Posted December 29, 2019 WWA advisory here. Ice Storm Warning issued for only 50-75 miles nw of here, and not a word about it ? Link to comment Share on other sites More sharing options...
donsutherland1 Posted December 29, 2019 Share Posted December 29, 2019 Light rain was affecting parts of the Metro NYC region near 4 pm. Overall, things remain on track for a soaking precipitation event. Much of the northern Middle Atlantic and southern New England regions will likely pick up 0.50"-1.50" precipitation with some locally higher amounts from the upcoming system. Central New York State and upstate New York into central New England, especially higher elevations, could be in line for a significant freezing rain event. Some portions of the affected area could see 0.50" or more freezing rain. Small amounts of freezing rain could extent across extreme northeastern Pennsylvania and northwestern New Jersey. Following the storm, December 2019 should end on a mild note. Link to comment Share on other sites More sharing options...
the_other_guy Posted December 29, 2019 Share Posted December 29, 2019 7 hours ago, uncle W said: the squirrels are very active this morning in the Poconos...somethings up... Im driving in it now on this awful I 80 that weaves like the Interborough through the Poconos. Rain and 34F Hope nobody had Holiday Ski Plans in the Poconos. Link to comment Share on other sites More sharing options...
Isotherm Posted December 29, 2019 Share Posted December 29, 2019 On 12/27/2019 at 5:12 PM, bluewave said: Thanks, Tom. The ENSO blog summed up several of the points we mentioned here going back to the fall of 2018. They discuss the warmest SST departures over the WPAC relative to further east. Another recent paper showed how the rapid expansion of that warm pool shifted the MJO to more frequent phase 4-6 episodes. https://www.climate.gov/news-features/blogs/enso/csi-enso-case-missing-central-pacific-rainfall The following figure shows how sea surface temperatures in the fall of 2018 differed from those of a typical El Niño of similar strength (1). Compared with a typical El Niño, the fall of 2018 featured a warmer sea surface in the western Pacific and a cooler sea surface in the eastern Pacific. This signifies an enhancement of the east-west sea surface temperature gradient relative to typical El Niño conditions. In other words, we failed to see the eastward movement of the warmest surface waters that we usually see with El Niño. It looks like this suspect fits the profile! The September–November difference in sea surface temperature between 2018 and a typical El Niño of similar strength. The typical El Niño sea surface temperature pattern was determined as a scaled average of all events since 1979 (13 total). In 2018, the sea surface temperature was warmer than typical over the western Pacific but cooler than typical over the eastern tropical Pacific, which indicates a stronger east-west temperature gradient than typically experienced during an El Niño fall. The white boxes indicate regions used to define a gradient index (west minus east) that measures the strength of the east-west temperature gradient. Climate.gov figure from ERSSTv5 data. Very nice article, Chris. The sea surface temperature profile projects onto the negative PDO paradigm to a certain extent, so we end up with a quasi Nino/Nina esque signal emanating from the Pacific. Warmer SST anomalies in the West Pacific, adjacent to Japan, and across the spatial domain around 150-60W longitude tend to promote these patterns. November PDO value was -0.36 per ERSST: https://www.ncdc.noaa.gov/teleconnections/pdo/ The tropical forcing pattern experienced last winter, also mediated in part by z50 QBO modulation. See this study: https://www.researchgate.net/publication/309099921_Impact_of_the_quasi-biennial_oscillation_on_predictability_of_the_Madden-Julian_oscillation 1 Link to comment Share on other sites More sharing options...
donsutherland1 Posted December 30, 2019 Share Posted December 30, 2019 The long-modeled sharp increase in the Arctic Oscillation (AO) is now underway. Over the past 2 days, the AO has risen 2.5 sigma. Over the past 3 days, it has risen more than 2.8 sigma. Since 1950, there were seven prior years when the AO rose 2.5 sigma or more over a two-day period during December 20-31. During the 2010s, there has been a cluster of such events: 2014, 2015, 2016, and now 2019. Four of the prior cases saw monthly snowfall in excess of 10" in New York City during the following January: 1963-64, 1977-78, 2014-15, and 2015-16. Two had less than 4" snowfall in January: 1967-68 and 1972-73. Widespread 0.50"-1.50" precipitation is likely in the region tonight into tomorrow. As a result, Allentown will very likely reach 60" precipitation for a record second consecutive year and Scranton could reach 50" for a record second consecutive year. 2019 will also rank among the 30 wettest years on record for New York City. Through December 28, monthly anomalies for select cities were: Baltimore: +2.0°, Boston: +1.6°, Islip: +0.6°, New York City: +0.2°, Newark: +0.3°, Philadelphia: +0.5°, and Washington, DC: +1.2°. A week ago, those anomalies were: Baltimore: +0.3°, Boston: -0.8°, Islip: -1.4°, New York City: -2.7°, Newark: -2.1°, Philadelphia: -1.3°, and Washington, DC: -0.4°. A short-duration cold shot is possible late in the first week of January into the second week of January. Nevertheless, there is a growing risk that New York City and Newark could have an average temperature near or even above 40° for the first week of January. A tendency for ridging could develop during the latter part of the second week of the month. The predominant state of the EPO will likely be crucial to the persistence of any colder patterns. Based on the forecast strongly positive AO to start January, the probability of a significant (6" or greater snowstorm) for the major cities of the Middle Atlantic region during the first week of January is low. Since 1950, the biggest snowfall for that region when the AO was +2.000 or above during the January 1-15 period occurred during January 14-15, 1954 when Philadelphia received 3.0" snow and New York City picked up 2.0". Boston has had numerous 6" or greater snowstorms during such cases, including one 10" or greater snowstorm. Therefore, the risk of significant snow would likely be greatest over New England assuming this relationship holds (no significant offsetting variables). Some of the newer AO forecasts keep the AO at +2.000 or above through January 10. If so, that development could adversely impact Mid-Atlantic significant snowfall prospects beyond the first week of January. Despite the development of a sustained colder than normal temperature regime, Utqiagvik (formerly Barrow) is nearing the end of its warmest year on record. 2019 will likely conclude with a mean temperature of 20.9°. The existing record is 18.9°, which was set in 2016. Currently, 2017 ranks as the second warmest year and 2018 ranks as the fourth warmest year. The ENSO Region 1+2 anomaly was +0.4°C and the Region 3.4 anomaly was +0.6°C for the week centered around December 18. For the past six weeks, the ENSO Region 1+2 anomaly has averaged +0.12°C and the ENSO Region 3.4 anomaly has averaged +0.56°C. The remainder of winter 2019-2020 will likely feature neutral-warm to weak El Niño conditions. The SOI was -0.94 today. Today, the preliminary Arctic Oscillation (AO) figure was +0.120. No significant stratospheric warming event appears likely through January 7, but warming will likely develop in the upper stratosphere and approach or reach 5 mb toward the end of the first week of January. Wave 2 activity will remain relatively muted at 30 mb through most of the first week of January, but a moderate Wave 2 hit could occur at or above 10 mb leading to the upper stratospheric warming. Overall, most of the stratosphere is forecast to remain cold through the first week of January on the EPS. However, the upper stratospheric warming will need to be watched for downward propagation. On December 28, the MJO was in Phase 7 at an amplitude of 1.233 (RMM). The December 27-adjusted amplitude was 1.511. Since 1974, there were five cases when the MJO was in Phase 6 at an amplitude of 1.500 or above during the December 20-31 period, as has been the case this year. The temperature anomalies were closely tied to how much time the MJO spent in Phase 8 during that timeframe. The mean temperature for cases with more than 5 such days was 29.0° in New York City. The mean temperature for those with 5 or fewer such days was 36.1°. The overall 1981-2019 mean temperature for January 1-15 is 33.8°. Based on sensitivity analysis applied to the latest guidance, there is an implied >99% probability that December will wind up warmer than normal in New York City with a monthly mean temperature near 38.5°. At present, a warmer than normal January appears likely in the region. 1 Link to comment Share on other sites More sharing options...
donsutherland1 Posted December 30, 2019 Share Posted December 30, 2019 As of 7:25 pm, New York City had picked up 0.12" rain. That brought the precipitation total for 2019 to 52.14". As a result, 2019 has moved ahead of 1979 when 52.13" precipitation was recorded to become New York City's 31st wettest year on record. Records go back to 1869. Link to comment Share on other sites More sharing options...
doncat Posted December 30, 2019 Share Posted December 30, 2019 Mean monthly temp here after today is 35.8°...Normal for Dec is 36.2°, so will finish very close to normal. Link to comment Share on other sites More sharing options...
doncat Posted December 30, 2019 Share Posted December 30, 2019 44 minutes ago, donsutherland1 said: As of 7:25 pm, New York City had picked up 0.12" rain. That brought the precipitation total for 2019 to 52.14". As a result, 2019 has moved ahead of 1979 when 52.13" precipitation was recorded to become New York City's 31st wettest year on record. Records go back to 1869. Way above that yearly total here on SI.... Will finish the year with around 63" after this current event. 1 Link to comment Share on other sites More sharing options...
donsutherland1 Posted December 30, 2019 Share Posted December 30, 2019 38 minutes ago, doncat said: Way above that yearly total here on SI.... Will finish the year with around 63" after this current event. South and west of Manhattan picked up quite a bit more precipitation this year. 1 Link to comment Share on other sites More sharing options...
Rtd208 Posted December 30, 2019 Share Posted December 30, 2019 Picked up 0.28" of rain for the day. Current temp 42 Link to comment Share on other sites More sharing options...
doncat Posted December 30, 2019 Share Posted December 30, 2019 0.38" for day, 7.18" month and 61.25" year. Link to comment Share on other sites More sharing options...
CIK62 Posted December 30, 2019 Share Posted December 30, 2019 The last two days of December are averaging 46degs., or about 13degs. AN. Month to date is +0.4[38.2]. December should end near +1.2[38.7]. The first 6 days of January are averaging 42degs. The first halve of January looks like toast. Just 7/16 days with a low of 32 or less----just 2 of them below the average of 27and 13/16 with a high of at least 40. Second halve looks even worse, especially Week 3. Might as well keep in mind these numbers: JAN. NORMAL 32.6. RECORD is 43.2. Winning pace would be +10.7. A +5.8 would net us Top Ten status. 43* here at 6am, drizzle. 46* by Noon. 42* by 5pm. Link to comment Share on other sites More sharing options...
bluewave Posted December 30, 2019 Share Posted December 30, 2019 With two milder days to go, all our stations will finish another warmer than average December. Not much in the way of cold across the US as the Pacific continues to dominate. Through 12-28 EWR....+0.6 NYC....+0.4 LGA....+0.2 JFK.....-0.1 BDR....+0.3 ISP.....+0.7 1 Link to comment Share on other sites More sharing options...
Isotherm Posted December 30, 2019 Share Posted December 30, 2019 16 hours ago, doncat said: Mean monthly temp here after today is 35.8°...Normal for Dec is 36.2°, so will finish very close to normal. 5 hours ago, bluewave said: With two milder days to go, all our stations will finish another warmer than average December. Not much in the way of cold across the US as the Pacific continues to dominate. Through 12-28 EWR....+0.6 NYC....+0.4 LGA....+0.2 JFK.....-0.1 BDR....+0.3 ISP.....+0.7 Exactly +1.0 here through this morning. After today and tomorrow, likely near 50F, I expect that will be a bit higher. Departures about as I expected nationwide; slightly warmer than normal in the NYC-metro region; a little lower than I had for Dec, but good overall. Snowfall here was 3.7". How much do you both have to date? 1 Link to comment Share on other sites More sharing options...
nj08822 Posted December 30, 2019 Share Posted December 30, 2019 Rumbles of thunder in Nazareth PA, 75 miles west of NYC. 1 Link to comment Share on other sites More sharing options...
Brian5671 Posted December 30, 2019 Share Posted December 30, 2019 10 minutes ago, nj08822 said: Rumbles of thunder in Nazareth PA, 75 miles west of NYC. nice cell on radar out there Link to comment Share on other sites More sharing options...
purduewx80 Posted December 30, 2019 Share Posted December 30, 2019 10 minutes ago, nj08822 said: Rumbles of thunder in Nazareth PA, 75 miles west of NYC. Impressive storm out there w/ tops to 40,000'. Think some of these could affect the city ~3-5PM. 1 Link to comment Share on other sites More sharing options...
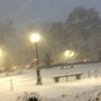
donsutherland1 Posted December 30, 2019 Share Posted December 30, 2019 Two photos along the Long Island Sound from early this afternoon. The temperature was 41° with drizzle. The wind was gusting around 40 mph by the water. 6 Link to comment Share on other sites More sharing options...
weathermedic Posted December 30, 2019 Share Posted December 30, 2019 51 minutes ago, purduewx80 said: Impressive storm out there w/ tops to 40,000'. Think some of these could affect the city ~3-5PM. From OKX AFD: Fcst models show a developing axis of elevated instability with MUCAPE up to 500 J/kg moving across the NYC metro area and Long Island this afternoon, right on the back edge of the rain shield, and have added isolated thunder to the forecast for those areas. 1 Link to comment Share on other sites More sharing options...

Recommended Posts
Create an account or sign in to comment
You need to be a member in order to leave a comment
Create an account
Sign up for a new account in our community. It's easy!
Register a new accountSign in
Already have an account? Sign in here.
Sign In Now