

TheClimateChanger
-
Posts
4,398 -
Joined
-
Last visited
Content Type
Profiles
Blogs
Forums
American Weather
Media Demo
Store
Gallery
Everything posted by TheClimateChanger
-
Occasional Thoughts on Climate Change
TheClimateChanger replied to donsutherland1's topic in Climate Change
Just because we're not getting gigantic heat blobs doesn't mean it's not warming at an alarming clip. I responded to "you know who" who was going on about adjustments to the NCEI numbers for Harrisburg, PA. I noticed immediately his alleged adjustments actually cool the recent summertime warming trend. So I pulled up the data for MDT and CXY airports... Since 2001, MDT is warming at +10.4F/century in the summertime; CXY Airport is warming at +17.2F/century in the summertime. This isn't even a cherrypicked start period. There were a lot of warm summers in the early years of this century. 2001 was hot - I remember Korey Stringer passing away at Vikings practice from the heat. 2002 was a ridiculous scorcher, as was 2005. 2006 was mostly hot. I think it reached 121F in South Dakota and was basically a statistical tie with 1936. And if you believe the people on this forum, recent summers haven't been too bad. I realize it's too short of a timeframe to really draw any significant conclusions, but wow. It's like we're boiling frogs. Maybe it's not reaching 120F every summer, but quietly this century, every location is heating up in the summertime and heating up quickly. -
Occasional Thoughts on Climate Change
TheClimateChanger replied to donsutherland1's topic in Climate Change
1936 is mostly a paper tiger. Doesn't stand up to scrutiny. Would be considered a summer of yesteryear if it happened today by the same people minimizing recent summertime heat. Ice was present on the east end of Lake Erie until the end of May. June was cold as hell compared to recent years. July was fairly typical, but generally cooler than recent years. A formidable heat wave struck from July 8 - July 14, which is included in the July numbers and brings the month up to close to current norms. However, humidity was exceptionally low with dew points commonly in the 40s and 50s, even as air temperatures climbed well into the 90s and 100s. Every recent summer has seen more deadly heat indices/wetbulb readings. Excluding the 7-day stretch, July was way cooler than recent years for the other 24 days. August was a little bit above current norms, but nothing crazy. Even in Des Moines, Iowa, where it was the hottest July on record, the humidity was unbelievably low. In fact, if you check on the Iowa Mesonet, they have data back to 1936. It was the driest July and summer on record, by mean dew point. All record heat indices [basically an analog for wet bulb reading] have been set in recent decades, including the highest on record just last summer [the one higher reading from 1936 appears to be erroneous]. Look at your local observations from that summer. You'll be surprised. This was pretty much the case everywhere from the east coast to Michigan, but even on the west shore of Lake Michigan at Chicago and Milwaukee. Some how they say this is the hottest summer on record, but its way cooler than all recent summers. Go figure. -
Central Pa. Spring 2024
TheClimateChanger replied to mahantango#1's topic in Upstate New York/Pennsylvania
But their adjustments have lowered the trend over that period? Looks like they've failed miserably. -
Central Pa. Spring 2024
TheClimateChanger replied to mahantango#1's topic in Upstate New York/Pennsylvania
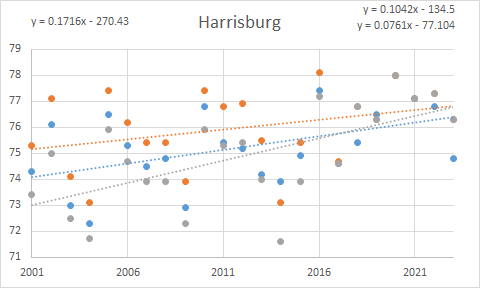
It gets even crazier when look at Capital City Airport (CXY) which used to be the official reporting station. Summertime warming trend this century is an astounding +17.2F per century. Absolutely bonkers.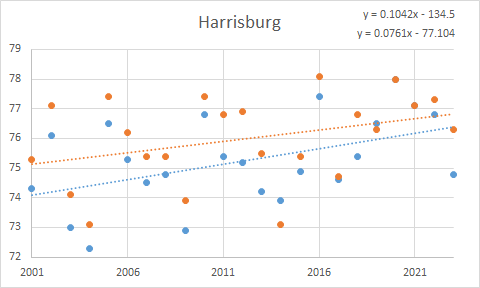
-
Central Pa. Spring 2024
TheClimateChanger replied to mahantango#1's topic in Upstate New York/Pennsylvania
Confirmed. NCEI's adjustments have lowered the raw data trend of +10.4F/century so far in the 21st century down to +7.6F/century. Why are they trying to hide the warming trend? @ChescoWx
-
Central Pa. Spring 2024
TheClimateChanger replied to mahantango#1's topic in Upstate New York/Pennsylvania
Interesting. Looks like they reduced the recent warming trend by generally warming the past more? -
Pittsburgh, Pa Summer 2024 Thread.
TheClimateChanger replied to meatwad's topic in Upstate New York/Pennsylvania
Not too bad out there today. Thought it would feel hotter, but the humidity is on the lower side. -
I know there's been a lot of discussion here about cicadas, but this is fascinating stuff. Due to climate change, they are having increasing difficulty in counting time between hatchings. I think in the future, it may be less predictable when they arrive. Cicadas are back, but climate change is messing with their body clocks - CBS News
-
Occasional Thoughts on Climate Change
TheClimateChanger replied to donsutherland1's topic in Climate Change
I think in the future we may have better chances of seeing drier heat episodes with excessive temperatures. When I look at a map, I look at that massive continental expanse called Canada. And I just think - geez, in this hothouse earth, that should be a blazing inferno in the summertime. I think it's only thermal inertia keeping things relatively in check. I do wonder if, in the future, we will see massive heat ridges forming over the Northern Plains and Canada and moving south into the United States. Imagine a 120-130F air mass over Manitoba, Saskatchewan, and Alberta pushing southeast into the U.S. with a pall of suffocating dust and wildfire smoke. -
Occasional Thoughts on Climate Change
TheClimateChanger replied to donsutherland1's topic in Climate Change
I think we're talking about different time scales. I've seen like months and months [3-6+] in a row in some of these more tropical regions set monthly record temperatures. You'd be very hard pressed to find that outside the tropics. And I wasn't too surprised by those temperatures. It's a lot drier there in the summertime, easier to heat up the atmosphere. Still much more deadly in the eastern U.S. with astronomical wet bulbs. We might not get those 115F+ readings, but need to keep an eye on the 85, 90, even deadly 95F wet bulbs in the future. -
This is where manual observation would come in handy. If that picture is recent and reasonably accurate for KTAN, there is no ceiling there.
-
Occasional Thoughts on Climate Change
TheClimateChanger replied to donsutherland1's topic in Climate Change
The funny thing is you look at scoundrels like Tony Heller and they are posting articles from 1962 about millions dying, and we are just leaving 1962 in the dust. Same thing with 1921. He often posts some old New York Tribune or something that had a multipage spread on the heat alleging millions dead. I just don't understand how this is possible. These years are cold compared to today. You could argue air conditioning, but is it that prevalent in those regions to offset the massive population growth and aging that has occurred. Really makes you wonder: (1) Were the historic reports untrue or exaggerated? Or (2) Is something more sinister afoot - like millions of deaths being covered up and simply not reported on by the press? That is, if millions were dying in these much cooler climate regimes, how many are dying today? -
Occasional Thoughts on Climate Change
TheClimateChanger replied to donsutherland1's topic in Climate Change
Not sure those are analogous to what's going on in the tropics. If we look at Mexico City, for instance, we just a nonstop barrage of monthly mean temperatures FAR in excess of existing records in 2024. I don't believe that to be the case in the instances you cite. March April May
-
Occasional Thoughts on Climate Change
TheClimateChanger replied to donsutherland1's topic in Climate Change
Basically what I'm saying is the climate warming in those regions is so substantial that standard deviations based on historical climate norms are meaningless, because the current mean is already 1 or more standard deviations above the historical data. -
Occasional Thoughts on Climate Change
TheClimateChanger replied to donsutherland1's topic in Climate Change
In fact, I would argue it's impossible to replicate that type of behavior at mid or high latitudes. The internal variability is acting in tandem with the overall warming trend, so you're going to produce outliers like February 2017, March 2012, etc. that might be difficult to beat for long periods of time even with continued warming. -
Occasional Thoughts on Climate Change
TheClimateChanger replied to donsutherland1's topic in Climate Change
Even 3-4 degrees of warming in a continental influenced, mid-latitude is insufficient to cause that, because the internal variablity / standard deviation is so much greater. -
Occasional Thoughts on Climate Change
TheClimateChanger replied to donsutherland1's topic in Climate Change
I think the explanation is much simpler. The standard deviations [i.e., internal variability] is substantially lower in those locations due to being at low latitude and being surrounded by water. A couple degrees of warming in the Caribbean or Florida is all it takes to get into a new climate regime where EVERY single month is above historical normals and where any given month in a regime favoring warm anomalies is likely to be the warmest on record. We are in that universe. -
Pittsburgh/Western PA Spring 2024
TheClimateChanger replied to Ahoff's topic in Upstate New York/Pennsylvania
It will be interesting to see if this month will come in below the normal mean temperature. Two days in and it's a bit below normal, which will likely reverse over the next 3-4 days. However, both the 6-10 day and 8-14 day outlooks favor below normal temperatures. So looks like decent odds that it will be below normal on the whole through mid month. June 2023 was the last below normal month officially at KPIT. Some of the other climo stations may have managed a below normal month somewhere in that period. -
Pittsburgh/Western PA Spring 2024
TheClimateChanger replied to Ahoff's topic in Upstate New York/Pennsylvania
But then again, I saw some boomers on Facebook comment that "it didn't feel that warm" to them. So maybe we ought to sort by people's feelings, instead of actual data. -
Pittsburgh/Western PA Spring 2024
TheClimateChanger replied to Ahoff's topic in Upstate New York/Pennsylvania
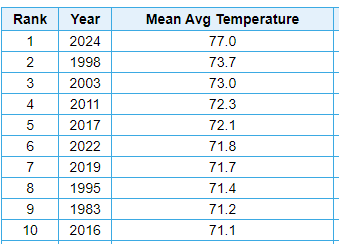
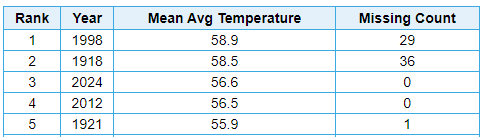
On a similar note, the NWS often posts misleading graphics like this one. It claims that 1998 & 1918 were warmer in the Wheeling thread, and 1998, 1944, and 1919 were warmer in the Morgantown thread. In fact, 2024 is the warmest spring with full data. At Wheeling, 1918 is missing the entire month of March. The mean returned is just the average of April & May. 1998 has data for all three months, but March only has 4 days late in the month which happen to coincide with a 2012-esque heat wave showing a ridiculous 68.3F monthly mean. In this case, utilizing the March data is even more misleading if averaged by month, because the actual monthly mean was undoubtedly 20 or more degrees less than that. So it's artificially tacking on at least nearly 7F to the spring mean [dividing the surplus by 3]. Below, I sorted by daily average to mitigate this to some degree. At Morgantown, 1998 and 1944 are missing data for the entire month of March. The averages reported are based only on April & May. 1919 is missing the entirety of both March & April. The average reported is simply the mean for May. In fact, it's 0.1F BELOW the current normal for May at Morgantown, and 4.4F cooler than May 2024. MGW HLG Undoubtedly all of these years would fall below 2024 with full data. The only comparable springs across all sites are 2012 & 1921, which in most cases are generally cooler. For context, 2024 averaged 62.6F in April & May at MGW, and 61.7F at HLG. This is well above all of the months listed without March data. Heck, the April-May average at Morgantown was even higher than the May alone average from 1919.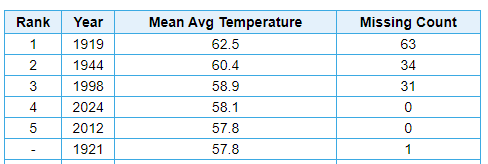
-
Pittsburgh/Western PA Spring 2024
TheClimateChanger replied to Ahoff's topic in Upstate New York/Pennsylvania
Depends on if it's sorted by averaging monthly averages or averaging daily averages. The latter is more accurate, but I think the former [i.e., averaging by monthly averages] is often superior since it mitigates the problem of missing data [which is common especially in the early years in most locations]. For example, if you are missing several days from March or June [which tend to be cooler], then averaging by days would tend to produce an exaggerated temperature for the seasonal mean since March or June is not being weighted equally since fewer data points are available. Averaging by months makes sure each month is equally weighted in its contribution. I always select monthly averaging for this reason unless there's no missing data. In this case, it's kind of a moot point since both 1921 & 2024 have full data, so averaging by days is fine and more accurate. Although technically, 2024 did edge out 1921 by a fraction of a tenth of a degree, but with rounding the two are equal. -
Occasional Thoughts on Climate Change
TheClimateChanger replied to donsutherland1's topic in Climate Change
Sorry @Typhoon Tip, I'm not seeing the suppression in latitude. It was the warmest meteorological spring of record in a large number of locations. -
But how did they get to Wisconsin? Thats 1,000 miles from the track of Idalia. It would have been quicker for them to just fly home. And where did the one in New York come from? Are you telling me it overwintered in North America, because that would be even more bizarre?
-
I must have missed the tropical storm that this specimen got mixed up in. Just like I missed the hurricane in Wisconsin last summer.
-
Wonder what they’ll blame this one on? I remember last summer when they showing up in the north, the experts were blaming it on some tropical storm.

