

TheClimateChanger
-
Posts
4,598 -
Joined
-
Last visited
Content Type
Profiles
Blogs
Forums
American Weather
Media Demo
Store
Gallery
Everything posted by TheClimateChanger
-
Occasional Thoughts on Climate Change
TheClimateChanger replied to donsutherland1's topic in Climate Change
Honestly, if I'm doing climate forensics here, the data @chubbsposted looks like a solar heating problem, not a miscalibration. If the thermometer was simply reading too high, you'd expect it to be pretty consistent, but there was a stretch from about the 9th through 16th where it was largely in line with its neighbors. This was a very wet period. Although the cloud cover reported by the observer was mostly clear on the majority of those days, you can tell he was very lenient. Because several of the "clear" days had rainfall near or over 1 inch, with hours long thundershowers. Probably poor siting impacted by radiant heat from a nearby building or surface and/or poor maintenance of the shelter allowing filtered sun to reach the thermometer. Previous research by Anthony Watts has shown that even failing to maintain the whitewash paint can cause a not insignificant warm bias by allowing the shelter housing itself to radiate heat to the thermometer. Needless to say modern automated stations are definitely superior.
-
Occasional Thoughts on Climate Change
TheClimateChanger replied to donsutherland1's topic in Climate Change
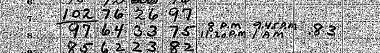
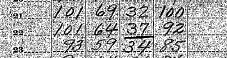
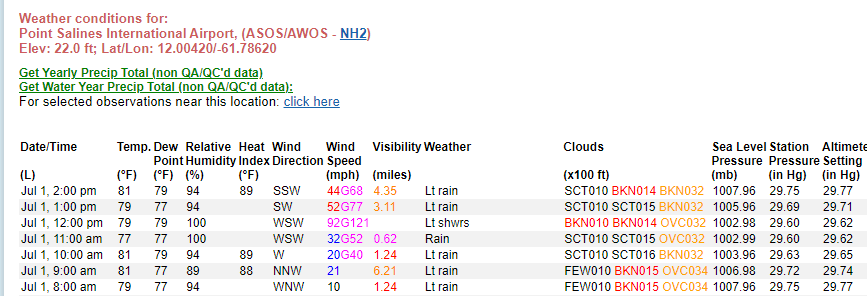
You can really see the impact of TOBs on the 8th. This looks at high temperatures on a few of the days with a big discrepancy. TOBs also impacts low temperatures because you lose midnight lows, which are surprisingly common in the summertime due to cool fronts and evening showers & thunderstorms. While @ChescoWxclaims there's no impact from TOBs, this is obvious BS. His analysis was at 8 pm [standard, daylight?], whereas some stations like Phoenixville were taking daily observations as early as 4 pm daylight time. As you can see, errors can be high as 20F (or more) on the daily maximum temperature. A single error of 20F would add about 0.6 to 0.7F to the mean maximum temperature. The high on the 7th was reported to be 102F, with a 4pm observation of 97F. The high on the 8th was 97F - obviously registered the previous day at 4 pm. But the 4 pm temperature on the 8th was 75F. This temperature was not a rain-cooled reading. Rain fell from 8 pm to 9:45 pm, and from 11:20 pm to 1 am., likely associated with a cold frontal passage the night prior. As such, the actual high on the 8th was likely in the mid to upper 70s, perhaps near 80. This would jive well with @chubbsgraphic, which shows that all of the neighboring stations were in the mid 70s that day. Looking at your graphic, the 22nd and 23rd depart significantly from the surrounding sites. We can see TOBs impacting that on both days. The high on the 21st was reportedly 101F, with a 4 pm observation of 100F. The high on the 22nd was reported as 101F, with a 4 pm observation of 92F. Skies were clear. Most likely, the mercury ticked back up a degree after the 4 pm observation on the 21st, and the high on the 22nd was in the mid 90s. We can see neighboring locations ranged from the mid 80s to low 90s. Same story on the 23rd. The high was 93F, but at 4 pm, it was just 85F with clear skies all day. Likely the 93F occurred the day prior shortly after the 4 pm observation, and the actual high was in the mid to upper 80s. Neighboring sites were all in the mid 80s that day.
-
Occasional Thoughts on Climate Change
TheClimateChanger replied to donsutherland1's topic in Climate Change
It looks like they reset at 4 pm, so yes they would have been double counting many high temperatures. That’s near peak heating. I thought these were standard time, but it looks like it was 4 pm eastern daylight saving time. -
Occasional Thoughts on Climate Change
TheClimateChanger replied to donsutherland1's topic in Climate Change
-
Pittsburgh, Pa Summer 2024 Thread.
TheClimateChanger replied to meatwad's topic in Upstate New York/Pennsylvania
-
Could it have been the result of an isolated tornado? No funnel cloud noted in the METAR, but visibility was poor.
-
Impressive.
-
Pittsburgh, Pa Summer 2024 Thread.
TheClimateChanger replied to meatwad's topic in Upstate New York/Pennsylvania
This is probably the most insane stat in that post. A 14-year running mean of 52.8F to 53.0F would be 0.8 to 1.0F above the 1991-2020 mean. It would also be 2.5 to 2.7F above the 1961-1990 mean, which was 1.7F lower than the 1991-2020 mean. -
Pittsburgh, Pa Summer 2024 Thread.
TheClimateChanger replied to meatwad's topic in Upstate New York/Pennsylvania
I will say it's actually kind of crazy how quickly things are warming these days. 1991-2020 2001-2024 [nearly 80% of the way through the next climate average period] Note: The 52.3 mean includes the mean of 52.6 for the first 6 months of 2024. This will certainly rise since the second half of the year is invariably warmer than the first [every month is warmer than its analog, i.e. July -> June through December -> January], and likely finish between 53 and 55F. But given it's averaged over 24 years, would likely only push us up a tenth of a degree at most. Nevertheless, likely that once 2024 is fully included, the 24 year running mean will climb to 52.4F, or about 0.4F above the 1991-2020 average. And for the period that will be coming in 2040, obviously not even 50% of the way through so subject to major changes. But does anyone truly believe 2025-2040 will be cooler than 2011-2024 on the whole? Also see comment above, when 2024 is fully factored in, it's likely to be at least 52.8, and possibly as high as 53.0F. Here, the final tally is being averaged across only 14 years. The 14-year running mean is thus likely to be between 0.8F and 1.0F above the 1991-2020 mean. 2011-2024 My takeaway: At this point, each climate update is shooting up 0.5F or more over the prior period. Which, when you consider that each climate period includes 2/3 of the prior, means the decade is 1.5F warmer than the one it is replacing. It becomes doubly insane when you recollect to the 1990s and many of these people saying it was due to a "warm cycle." In other words, the periods being replaced were not unusually cold, but rather considered to be unusually warm at the time. I'm also old enough to remember being told it's warmed like a degree over 100 years, and not 1.5F degrees every 30 years.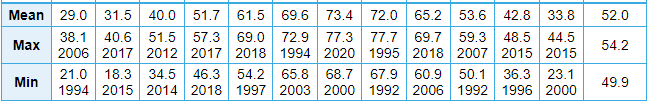
-
Pittsburgh, Pa Summer 2024 Thread.
TheClimateChanger replied to meatwad's topic in Upstate New York/Pennsylvania
Interesting. The funny thing about 2014 is it tied two daily record lows, and set one, despite not going below 50F. Only 7 days in the month of July have record lows above 50F, and it managed to find three of those low-hanging fruit days with timely cold fronts. If your suspicion is correct, daily record low minima in the month of July may permanently be a thing of the past. Not that record lows are common at any time of the year these days. -
Occasional Thoughts on Climate Change
TheClimateChanger replied to donsutherland1's topic in Climate Change
The historic heat wave continues across eastern North America, with a number of monthly high minimum readings in danger of falling today, including a couple of all-time records. -
Pittsburgh, Pa Summer 2024 Thread.
TheClimateChanger replied to meatwad's topic in Upstate New York/Pennsylvania
Looks like our streak of 80+ high temperatures will end tomorrow at 19 days, and then another streak begins Tuesday. -
Pittsburgh, Pa Summer 2024 Thread.
TheClimateChanger replied to meatwad's topic in Upstate New York/Pennsylvania
Weird. You would think with temperatures in the mid 80s, and dewpoints in the low to mid 70s, radar would be lighting up. I’m not complaining though. Glad we didn’t get that 1 to locally 4 inches of rain. -
Pittsburgh, Pa Summer 2024 Thread.
TheClimateChanger replied to meatwad's topic in Upstate New York/Pennsylvania
Doubt cloud cover will have much effect. It’s very hot and humid out. -
Pittsburgh, Pa Summer 2024 Thread.
TheClimateChanger replied to meatwad's topic in Upstate New York/Pennsylvania
-
Pittsburgh, Pa Summer 2024 Thread.
TheClimateChanger replied to meatwad's topic in Upstate New York/Pennsylvania
-
Pittsburgh, Pa Summer 2024 Thread.
TheClimateChanger replied to meatwad's topic in Upstate New York/Pennsylvania
Model projection showing elevated EHI for tomorrow. -
Pittsburgh, Pa Summer 2024 Thread.
TheClimateChanger replied to meatwad's topic in Upstate New York/Pennsylvania
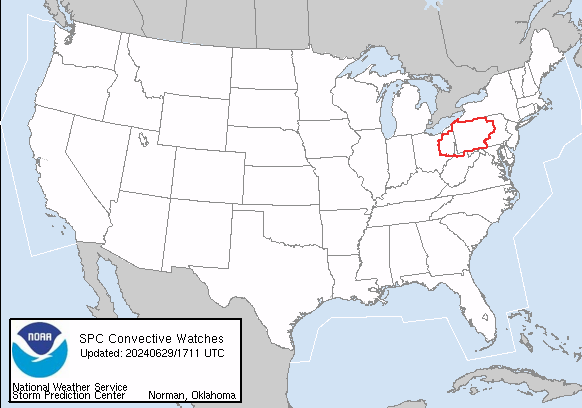
SPC has Pittsburgh in a 5-9 percent risk of tornadoes (within 25 miles) for tomorrow. Given recent tornadoes with less than 2 percent risk, may be something to watch. -
Pittsburgh, Pa Summer 2024 Thread.
TheClimateChanger replied to meatwad's topic in Upstate New York/Pennsylvania
Update on yesterday's tornados: -
Occasional Thoughts on Climate Change
TheClimateChanger replied to donsutherland1's topic in Climate Change
Another thing I've noticed in reviewing old phenological records is that the same species of trees leafed out in northern Ohio later than they did this year in the Upper Peninsula of Michigan. And temperatures from that era in Cleveland were in fact comparable to those observed in Marquette this year. Very interesting finding to me. You won't see any of this reported anywhere. Like you would think it would be important news, but I guess not. Oh, but do carry on about how NOAA's 2 degree warming estimate for U.S. is wildly overblown.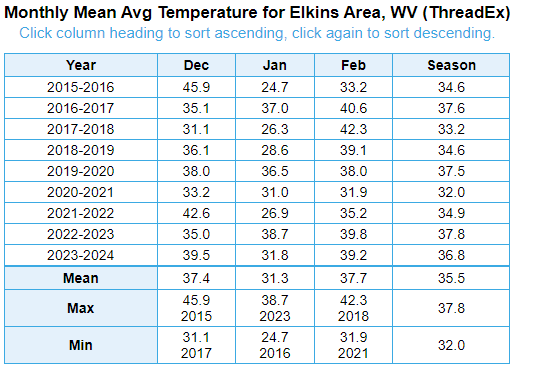
-
Occasional Thoughts on Climate Change
TheClimateChanger replied to donsutherland1's topic in Climate Change
Some other oddities that don't jive with the official narrative. The mean winter temperature at Elkins, West Virginia [elev: 2000 feet, population almost nothing] over the past 9 winters is more than one half of a degree warmer than the mean temperature of all winters in Washington, D.C. [elev: near sea level, population: a very big city] from 1871 to 1921. This is a place that averages near 70 to 80 inches of snow per year historically, that is now warmer in the wintertime than the subtropical climate of the District of Columbia.
-
Occasional Thoughts on Climate Change
TheClimateChanger replied to donsutherland1's topic in Climate Change
So what is the significance of this data? While NOAA continues to downplay the warming, we can see in fact that temperatures 100 years ago were routinely 8-10F cooler than the temperatures observed in 2024. The temperatures observed in this region in 2024 are more typical of 20th century East Tennessee (lower elevations). In fact, if we key in on Knoxville, Tennessee, for the period 1872-1996 (125 years), what we discover is this: 9 years [all on or before 1985] had a mean temperature at or below 52.1F. 34 years had a mean temperature of 53.4F or lower. 59 years had a mean temperature of 54.6F or lower. Turning instead to Tri-Cities, Tennessee [Bristol/Johnson City Area]... and I know the elevation here is a bit higher, but only by like 200-300 feet compared to the airports I showed in the Upper Ohio Valley. In fact, the elevation gain here is comparable to the elevation loss in comparing those locations to Knoxville and less than the elevation gain in the threaded records for those very locations. Anyways from 1938-2016, a period of 79 years, we find the following: 44 years had a mean temperature at or below 52.1F. 67 years had a mean temperature at or below 53.4F. All but 4 years had a mean temperature at or below 54.6F.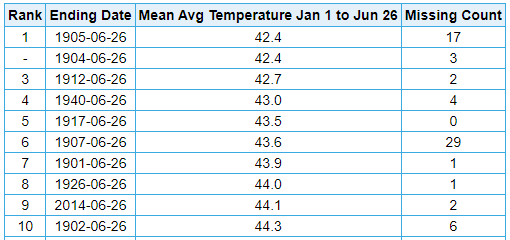
-
Occasional Thoughts on Climate Change
TheClimateChanger replied to donsutherland1's topic in Climate Change
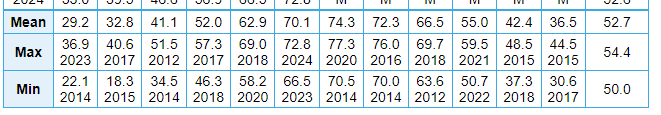
Very similar conditions can be noted in south central Pennsylvania, at locations like Hagerstown, Maryland [just across the state line] and Harrisburg/Middleton Area, Pennsylvania. Hagerstown, Md. Harrisburg/Middleton, Pa.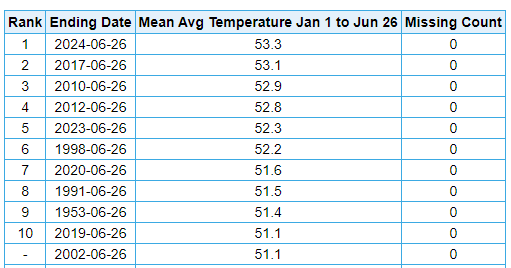
-
Occasional Thoughts on Climate Change
TheClimateChanger replied to donsutherland1's topic in Climate Change
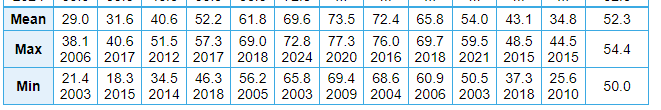
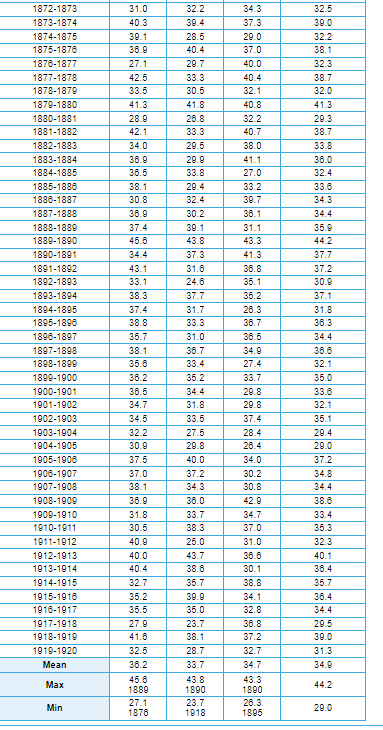
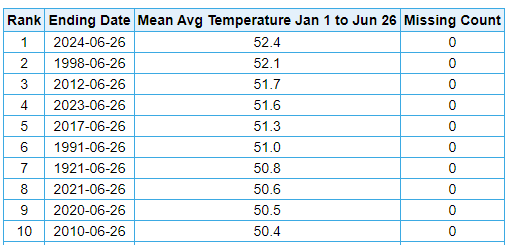
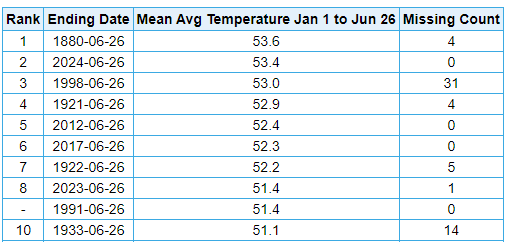
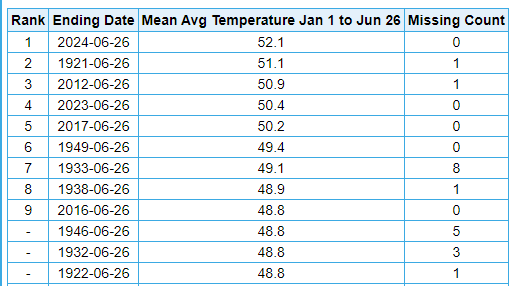
As we approach the half-way point of 2024, I figured it would be a good time to review the weather and past climate. Anyone who has followed me since the 1990s knows that I have consistently been the most accurate voice on climate change - even back to when I was but a wee lad of ten years. So far, everything is playing out largely as I had projected. For western Pennsylvania, this has undoubtedly been the hottest year on record to date. At Pittsburgh International Airport, the mean temperature has been 52.0F. In the threaded record, only 1880 is warmer. However, this was at the downtown city office - sited about 400' lower in elevation than the airport, and is not a reliable reading [as with most of the 19th century data in the threaded record]. From 1953-1979, the city office averaged 2.6F warmer than the suburban airport, with an annual range of +1.1F to +3.8F. Therefore, we can surmise that the mean temperature in downtown Pittsburgh is near 54.6F, with a high confidence interval of 53.1F to 55.8F. At Morgantown, West Virginia, the mean temperature has been 53.4F. Second to 1880, but Morgantown's records from that era also appear to suffer from a substantial warm bias. What is fascinating to me is 1998 is missing the entire month of March, and 2024 is still nearly a half degree Fahrenheit warmer! If you were alive in 1998, you can recall how it was a HUGE deal how warm it was in so many places. So to see this El Nino just completely blowing that away - even excluding a winter month - is incredible. At Wheeling, West Virginia, the mean temperature has been 52.1F, which is 1F above 1921. No data in this station thread 1954-1998, although only 1998 & 1991 would be warm year candidates. Worth noting the pre-1954 records were taken from a location adjacent to the Ohio River (at an elevation of less than 700 feet ASL, while the modern records are at the airport with an elevation of 1200 feet ASL).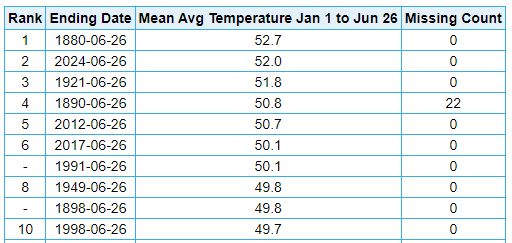
-
E PA/NJ/DE Summer 2024 Obs/Discussion
TheClimateChanger replied to JTA66's topic in Philadelphia Region
What is the annual mean temperature to date looking like on all of your devices? You should add a year-to-date temperature summary.


