

TheClimateChanger
-
Posts
4,574 -
Joined
-
Last visited
Content Type
Profiles
Blogs
Forums
American Weather
Media Demo
Store
Gallery
Everything posted by TheClimateChanger
-
Central PA Autumn 2023
TheClimateChanger replied to Itstrainingtime's topic in Upstate New York/Pennsylvania
I already gave my thoughts. Why do I need to give any more justification other than the fact that I don't think a low-probability, thread-the-needle storm showing up on Day 9 is likely to happen? I also simply pointed out that the forecast snowfall accumulation values were actually normal to below normal (in some cases, well below) for much of the Commonwealth outside of a narrow corridor in the south. So, like I said, let's wait and see who is right on December 9 before we accuse someone of trolling. In fact, you are the one trying to stifle weather discussion. -
Temperatures are delivering just fine. With one month left in 2023, it's been 3rd warmest at Toledo, 7th warmest at Cleveland, 10th warmest at Youngstown, and 12th warmest at Mansfield and Canton/Akron. Would be even higher in the ranks if not for a number of recent, even warmer, years at most of these locations. And these are based on even longer PORs than the snowfall numbers, with 150 years at Toledo and 153 years at Cleveland. That's a predicted exceedance of about once every 75 years at Toledo, and about once every 25- or 26-years at Cleveland. So I would say temperatures are performing VERY well.
-
Central PA Autumn 2023
TheClimateChanger replied to Itstrainingtime's topic in Upstate New York/Pennsylvania
How about we wait until December 9 and see what actually happens? -
Central PA Autumn 2023
TheClimateChanger replied to Itstrainingtime's topic in Upstate New York/Pennsylvania
Not too impressed with this setup. 0.9" at Pittsburgh is below normal for that period, and 0.5" at Erie is WAY below normal. Outside of the mountains, I think the numbers shown in the Mid Atlantic are inflated and a lot of that isn't actually snow (or certainly not a 10:1 ratio). -
Where the heck is that? Clearly, nowhere near New York City.
-
I think it's mostly mean reversion. Some of the months showing less warming tendencies in recent years [March, April, November] have historically warmed the most. At NYC, March has warmed at an average of 4.8F/century; April, 4.0F/century; and November, 3.7F/century. By contrast, the annual mean has risen only 2.8F/century. These months are actually among the months which show the most warming since the late 19th century. Note that, while the values presented above may be affected by UHI, the findings are robust in that I've seen the same pattern at many locations - with early spring and November being among the times of the year that have warmed the most since the 19th/early 20th century.
-
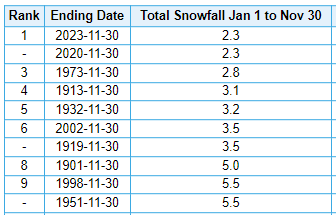
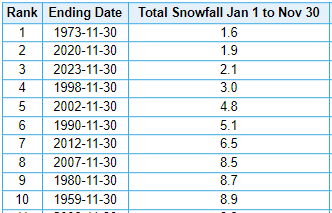
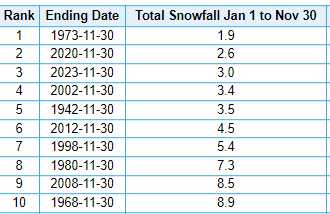
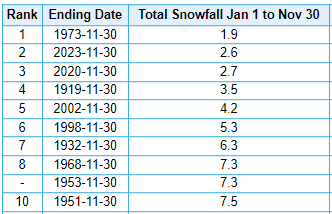
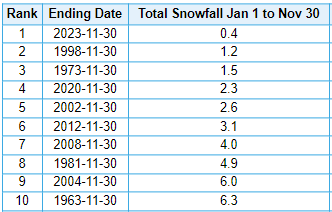
RECORD WATCH: Calendar year snowfall to date. Current annual record [full 12 months] shown below each table. NYC [Tied least of 155 years] Full year record is 3.4" set in 1913. JFK [3rd least of 67 years] Full year record is 2.1" set in 1973. LGA [3rd least of 84 years] Full year record is 4.1" set in 1973. EWR [2nd least of 123 years] Full year record is 4.0" set in 1973.
-
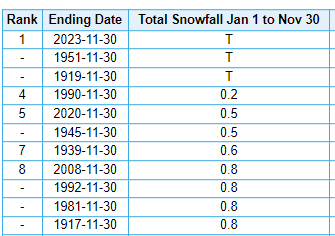
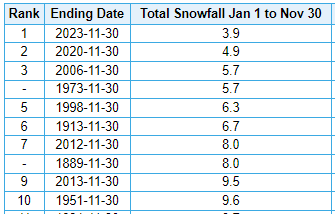
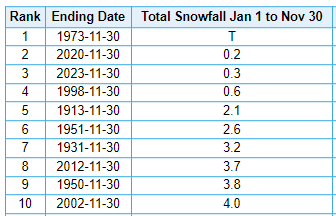
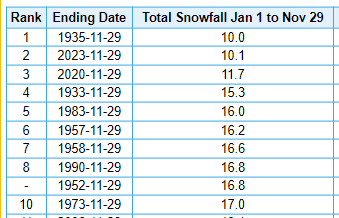
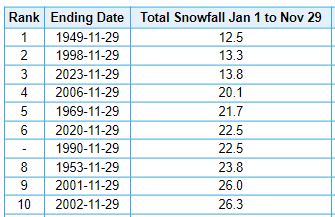
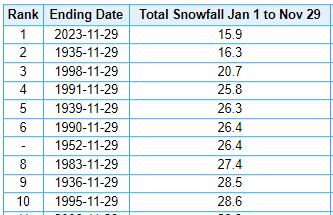
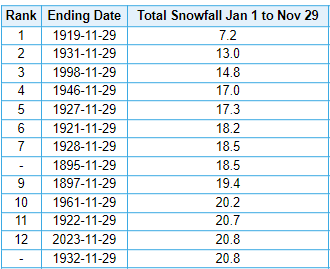
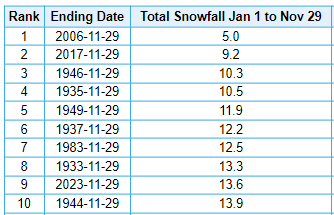
RECORD WATCH: Calendar year snowfall ranks to date. IAD will attain the record with 1.4" or less snowfall in December, while PHL and MDT will attain records with 1.8" or less snowfall in December. Richmond and Norfolk can tie with no measurable snowfall in December. The record is already out at DCA as 2020 saw only 0.2" at that location. IAD [Least of 61 years] Full year record is 1.8 inches, set in 1998. DCA [5th least of 139 years] Full year record is 0.2 inches, set in 2020 - which has already been exceeded. Second place is 0.5 inches, set in 1998. RIC [Tied least of 116 years] Full year record is a trace, set in 1951. Norfolk, VA [Tied least of 128 years] Full year record is a trace set in 7 years, most recently in 2019. Harrisburg, PA [Least of 135 years] Full year record is 5.7 inches, set in 2006. Philadelphia, PA [3rd least of 139 years] Full year record is 2.1 inches, set in 1913.


-
Paltry calendar year for snow so far across northern Ohio. A few sites eyeing a record if we get a mild December. Toledo and Cleveland doing a bit better than most with the recent snowfall at those locations, although some of that is simply a result of longer PORs at those sites. While this is the 12th least snowiest calendar year to date in the Cleveland threaded climate record, only three years at CLE airport have seen less snowfall to date (1998, 1946 & 1961). Due to a lot of missing data and irregularities in the early snowfall data in the MFD and YNG threads, these are based only on years with less than 50 missing days. Wanted to select a target that would allow the most data possible, while excluding clearly erroneous data. Of course, that also means some of the early years may have had more snow than shown - although I believe most of the missing days were days without snow. Below each box, I've added the existing target to beat for the full 12-month calendar year. Akron/Canton [3rd least of 74 years] Record least calendar year snowfall is 17.5" in 1998. Mansfield [2nd least of 79 years] Record least calendar year snowfall is 19.7" in 2006. Youngstown [Least of 78 years] Record least calendar year snowfall is 26.8" in 1939. Toledo [9th least of 84 years] Record least calendar year snowfall is 6.6" in 2006. Cleveland [12th least of 131 years; 4th least of 84 years at airport observation site] Record least calendar year snowfall is 13.0" in 1931. At the airport, the record least snowfall is 21.7" in 1998.
-
Well, I wouldn't call myself elite or intelligentia [sic], I just use it to mean "one who denies, e.g. Holocaust denier."
-
It just seems in a lot of cases these claims are made in bad faith. Our current equipment and measuring ability is better than ever. You can even quantify some of the impacts of moving the station from the City of Worcester to ORH, some 400-500 feet increase in elevation. During the period from 1949-1961, the Worcester City station ran 2.7F warmer for maximum temperatures, 0.6F cooler for minimum temperatures, and averaged 1.0F warmer for the daily mean. That's a big difference, especially for daytime maximum, so I would expect a disproportionate amount of record maxima to belong to the city station. Fortunately, the elevation change was somewhat offset by the more favorable radiational cooling at the city station [it looks like the station may have been sited in a neighborhood, not downtown]. This is not even looking into whether there were time of observation biases in the earlier city record. From the mid/late 1980s to the mid/late 1990s, the first-order (airport) sites utilized the HO-83 hygrothermometer. There's a plethora of academic research showing these read as much as 2C too warm, particularly on sunny days with minimal winds. I know this, ironically, because deniers made a big deal about it in the 2000s saying the recent warming was inflated - even though this was only affecting a small subset of climate stations. Of course, now they point to years like 1988 and 1995 to say it's been hot before. There were a lot of heat records set in this period in the U.S., particularly at these first order sites. Most likely, some of those heat records were inflated, but we're not allowed to say that.
-
Can you show one of these observations from ORH? I'll bet it's something like: -ZR 01/M04. Freezing rain is certainly possible above freezing if there's a big dewpoint depression and/or a rapid increase in air temperature such that the surface is still below freezing. I agree 2" of snow in an hour at 34F is impossible with a properly sited station, and that snow of that intensity would surely drop the air temperature to freezing or below.
-
Look, I don't want to stir up any trouble. I know you and @CoastalWxare prolific posters with lots of credibility, but MADIS almost also shows a big warm bias. And I'm always skeptical of people making a big deal out of a station running warm. You never see people call out stations running cool - Albany was running 2-3 degrees too low for awhile, it took a former NWS met calling it out before they would address it. It's always so warm these days, that even a minor warm bias automatically gets detected and amplified since records start being shattered.
-
It may have a small warm bias, but MADIS is not reliable. It literally always says most ASOS stations are way too warm. It's certainly not 2 degrees off the surrounding stations - Boston is only 0.7F from a record, Concord 0.5F, and Hartford 0.3F. None of the surrounding first-order sites are any where near 2 degrees cooler than ORH, on a departure basis.
-
Central PA Autumn 2023
TheClimateChanger replied to Itstrainingtime's topic in Upstate New York/Pennsylvania
I see my "alter ego" is lurking. -
Central PA Autumn 2023
TheClimateChanger replied to Itstrainingtime's topic in Upstate New York/Pennsylvania
Bunch of snowflakes in this thread. Can't even take someone sharing the fact that it's been one of the hottest and least snowiest years on record without flying off the handle. Funny, I bet some of these are "free speech" people. -
Central PA Autumn 2023
TheClimateChanger replied to Itstrainingtime's topic in Upstate New York/Pennsylvania
Got to love it! I post topical climate data for central Pennsylvania, don't even mention climate change, and am accused of trolling. @PSUWhiteout70comes here posting completely off-topic conspiracy theories, and gets several likes. -
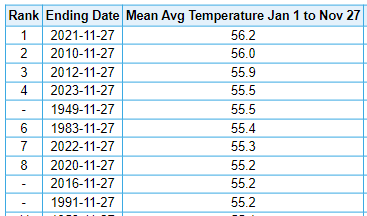
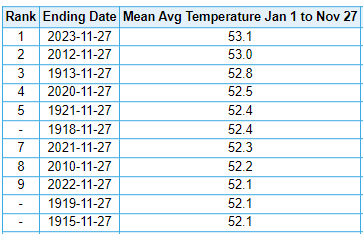
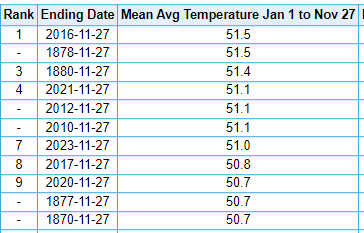
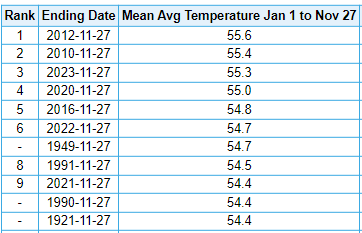
Looking like another historic year weatherwise for New England, depending on how December shapes up. Here is a collection of cities, with 2023 ranging from warmest on record at ORH to 7th warmest on record at CON. Some of the records for ORH and CON in the early years are not reliable - in the case of ORH, this is due mainly to elevation and site location changes. Unclear what the problem is at CON, but the 1870s are way out of whack with other data [excluding those records, 2023 is 5th warmest since 1880]. Burlington, VT Caribou, ME Mount Washington, NH Boston, MA Worcester, MA Note: Due to substantial elevation change, early data is not directly comparable to present. Concord, NH Hartford, CT
-
Central PA Autumn 2023
TheClimateChanger replied to Itstrainingtime's topic in Upstate New York/Pennsylvania
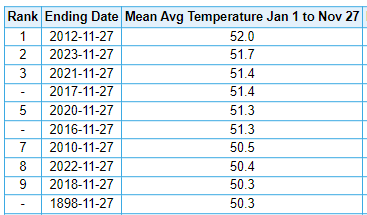
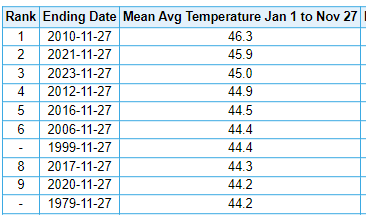
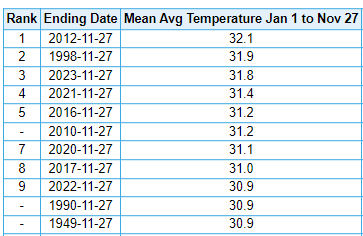
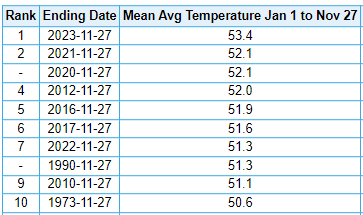
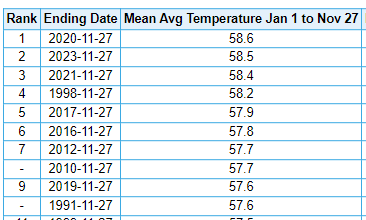
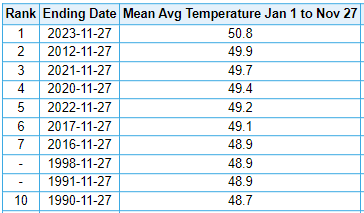
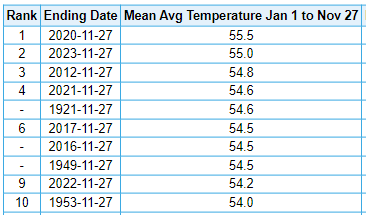
With a little over one month left in the year, 2023 continues to be in the running for one of the warmest years on record at several cities in the Commonwealth of Pennsylvania. Notably, it is easily the warmest on record at DuBois and Bradford, in the higher elevations of the north. Williamsport, Harrisburg, and Scranton/Wilkes-Barre area are all in second place to date - in the latter two cities, the records belong to the recent year of 2020; however, the record at Williamsport dates back more than 100 years (1921). While 1921 is the warmest through November 27, the record warmest year at IPT actually occurred much more recently in 2012 (as a warm December enabled that year to overtake the early 20th century challenger). Regardless, if we continue to run warmer than normal in December, this is shaping up to be an historic year weather-wise in the Commonwealth. I am looking forward, with much excitement, to sharing the final numbers in early January. Williamsport (2nd warmest) DuBois (warmest on record - a full 1.3F above #2!!!) Harrisburg - Middleton (2nd place) Bradford (warmest on record - by nearly a full degree!) Scranton, Wilkes-Barre, Avoca, PA (2nd warmest)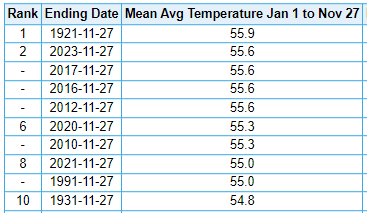
-
Central PA Autumn 2023
TheClimateChanger replied to Itstrainingtime's topic in Upstate New York/Pennsylvania
I just don't know what is so controversial, or factually wrong. Like I said, I was just taking a quick look at snowfall numbers for Pennsylvania cities, as we head into winter. Since I don't live near Harrisburg, I didn't know snowfall has been that low there. While 2019-2020 & 2022-2023 were paltry everywhere in the Commonwealth, most places in the Commonwealth have not had their top two least snowiest winters in that stretch. -
Central PA Autumn 2023
TheClimateChanger replied to Itstrainingtime's topic in Upstate New York/Pennsylvania
I was talking about the sock puppet theory. Wonder if he thinks ChescoWx is another sock puppet of mine? Lol. -
Central PA Autumn 2023
TheClimateChanger replied to Itstrainingtime's topic in Upstate New York/Pennsylvania
Same here. The bulk of my posts are simply sharing unadjusted climate stats from first order sites that I find interesting. I never even bring up climate change, except in the climate change section. -
Central PA Autumn 2023
TheClimateChanger replied to Itstrainingtime's topic in Upstate New York/Pennsylvania
Nobody thinks that, except for you. -
Central PA Autumn 2023
TheClimateChanger replied to Itstrainingtime's topic in Upstate New York/Pennsylvania
With all due respect, how is posting year to date climate statistics for the capital against the rules? -
Central PA Autumn 2023
TheClimateChanger replied to Itstrainingtime's topic in Upstate New York/Pennsylvania
Yes, I posted the annual snowfall to date in the previous post. 2023 is #1 for lowest through 11-27.


