

TheClimateChanger
-
Posts
4,574 -
Joined
-
Last visited
Content Type
Profiles
Blogs
Forums
American Weather
Media Demo
Store
Gallery
Everything posted by TheClimateChanger
-
Central PA Autumn 2023
TheClimateChanger replied to Itstrainingtime's topic in Upstate New York/Pennsylvania
In any event, here is where we stand on the year in the capital city. This has been an incredibly noteworthy year weatherwise. Second warmest to date Least snowiest calendar year to date Just a shame that records aren't taken at Capital City Airport anymore, or we'd really be blowing all other years out of the water. They do this all the time. Move the station to a cooler location to hide the incline. Change the equipment or time of observations to hide the incline. It's just not working anymore.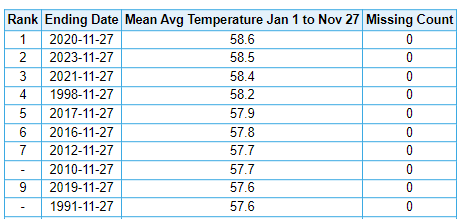
-
Central PA Autumn 2023
TheClimateChanger replied to Itstrainingtime's topic in Upstate New York/Pennsylvania
I'm going to have to disagree. I don't think anyone here knew it was that bad in 2019-2020 & 2022-2023 in Harrisburg. I certainly didn't, as I haven't seen it mentioned anywhere. -
Central PA Autumn 2023
TheClimateChanger replied to Itstrainingtime's topic in Upstate New York/Pennsylvania
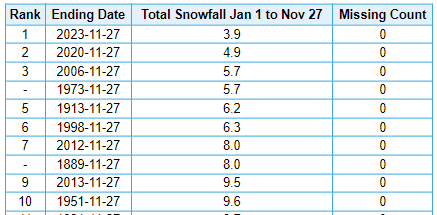
I was looking at snowfall records across the Commonwealth, and I found this quite interesting. Harrisburg had never had less than 9" of snow in a full winter until recently, but has now had 2 of the past 4 winters with less than 6 inches of snow. By percent that is pretty substantial, some 35-40% less than the prior record in those winters.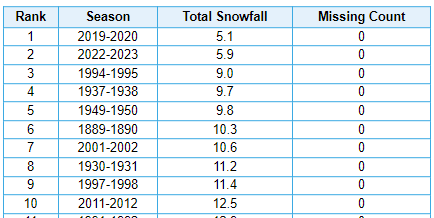
-
Pittsburgh/Western PA Fall 2023 Discussion
TheClimateChanger replied to Ahoff's topic in Upstate New York/Pennsylvania
Picked up a light dusting of snow pellets here. -
Pittsburgh/Western PA Fall 2023 Discussion
TheClimateChanger replied to Ahoff's topic in Upstate New York/Pennsylvania
11.6 inches of snow so far in the 2023 calendar year. The least snowiest calendar year on record is 1998, with 10.9 inches. The current second least snowiest calendar year is 1889, with 15.8 inches. However, that value is probably not really comparable to recent snowfall records due to changes in location and station exposure, as well as changes in snowfall measurement procedures. -
Central PA Autumn 2023
TheClimateChanger replied to Itstrainingtime's topic in Upstate New York/Pennsylvania
I guess only one person can possibly wonder how winter will be affected by a 2C warmer globe this year? Even if only temporary, that’s pretty significant since all the discourse has always made it seem that’s some far off threshold. -
Central PA Autumn 2023
TheClimateChanger replied to Itstrainingtime's topic in Upstate New York/Pennsylvania
You would think it would be pretty difficult to get any sustained wintry weather at our latitude in a +2C world. Might have to hold out hope for a few “thread the needle” type events that melt away quickly. -
The sky is literally falling though. https://e360.yale.edu/features/climate-change-upper-atmosphere-cooling#:~:text=it to contract.-,The sky is falling — literally.,at Charles University in Prague.
-
-
Fall 2023 Medium/Long Range Discussion
TheClimateChanger replied to Chicago Storm's topic in Lakes/Ohio Valley
Are the palms still unprotected? -
Central PA Autumn 2023
TheClimateChanger replied to Itstrainingtime's topic in Upstate New York/Pennsylvania
Oh, I didn’t mean to imply your forecast was incorrect. I was admiring your willingness to go out on a limb. I just thought 58” sounded like a lot for IPT, and was curious how long it had been since that number was reached or exceeded in a winter. -
Central PA Autumn 2023
TheClimateChanger replied to Itstrainingtime's topic in Upstate New York/Pennsylvania
Here was Wednesday's climate report for DuBois - Jefferson County Airport. Far cry from last year when the high was just 33.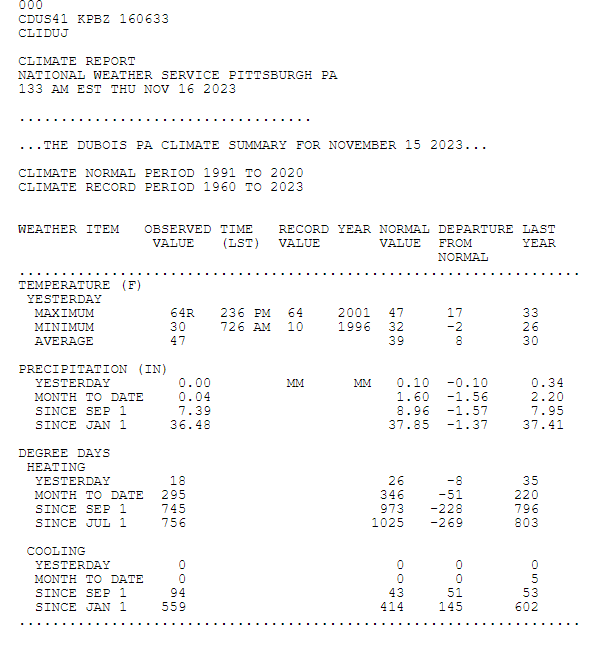
-
Pittsburgh/Western PA Fall 2023 Discussion
TheClimateChanger replied to Ahoff's topic in Upstate New York/Pennsylvania
DuBois also tied a record high of 64F on Wednesday.
-
Central PA Autumn 2023
TheClimateChanger replied to Itstrainingtime's topic in Upstate New York/Pennsylvania
DuBois also reached a record of high of 64F on the 15th as well. Looks like today will come up short. Current temperature is 61F with rain knocking on the doorstep. Record is 67F. -
Pittsburgh/Western PA Fall 2023 Discussion
TheClimateChanger replied to Ahoff's topic in Upstate New York/Pennsylvania
-
Same story in Martinsburg! One of the hottest and driest years ever recorded, and it can only muster a measly D1 on the drought scale. Northern Berkeley isn't even in drought, only abnormally dry (D0)!
-
It's incredible how difficult it is to get a drought in this region. At Hagerstown Regional Airport, it has been the 4th warmest and 3rd driest on record (less than a quarter of an inch from driest on record). Needless to say, this is about as hot and dry as it gets. Yet if you look at the map, HGR is roughly on the border between D0 and D1. You'd think these conditions would correspond to D3 or D4, given that there has never been this combination of heat and lack of precipitation recorded in Hagerstown prior to this year. Can only imagine how dry it must be in those D3 zones in Virginia.
-
Pittsburgh/Western PA Fall 2023 Discussion
TheClimateChanger replied to Ahoff's topic in Upstate New York/Pennsylvania
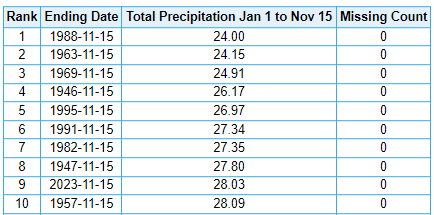
Absolutely astounding. "Abnormally dry" supposedly correlates to conditions that are expected to occur about 1 every 3 or 4 years. I don't know how they are determining it isn't abnormally dry. If we exclude downtown data, and look at all data from the two airport sites, this is the sixth warmest year on record to date [of 88 years]. And the ninth driest of those 88 years, and only about an inch from 5th place on this list:
-
Pittsburgh/Western PA Fall 2023 Discussion
TheClimateChanger replied to Ahoff's topic in Upstate New York/Pennsylvania
PIT's low of 34F was a whopping 7 degrees below the low temperature observed at AGC, and even 1F lower than BTP (that's pretty rare). Yet no complaints about the accuracy of those readings. Go figure. -
The funny thing is these are conservative, because they are based on past winters. The climate is not static, it's warming. Therefore, their predictive power is lessened moving forward. If you want a better approximation of what the next decade will look like, you can probably add another half zone across the board.
-
Central PA Autumn 2023
TheClimateChanger replied to Itstrainingtime's topic in Upstate New York/Pennsylvania
The US Department of Agriculture released an update to its plant hardiness zones this morning. Most of south central PA is now in Zone 7A, with southeast Pennsylvania moving up to Zone 7B. Zooming in, I even spotted a small area of Zone 8A in southern Delaware County near the river. Looks like most areas increased at least one half of a zone since the last release. Based on these updates, most areas should expect annual minimum temperatures to average between zero and 5F. Of course, that's an average, so there can still be years where the temperature drops below zero. USDA Plant Hardiness Zone Map | USDA Plant Hardiness Zone Map -
Pittsburgh/Western PA Fall 2023 Discussion
TheClimateChanger replied to Ahoff's topic in Upstate New York/Pennsylvania
The US Department of Agriculture released an update to its plant hardiness zone map this morning. Shows portions of southwest Pennsylvania, along the Monongahela and Ohio Rivers, including downtown Pittsburgh, as Zone 7A for the first time. This corresponds to an average annual minimum temperature of 0 to 5F. The rest of southwest Pennsylvania was bumped to Zone 6B, corresponding to an average annual minimum temperature of -5 to 0F. USDA Plant Hardiness Zone Map | USDA Plant Hardiness Zone Map -
Fascinating. When I brought up plant hardiness zone changes recently, I had no idea USDA was publishing a new update today. I took a look and it has some areas of 7A now in western Pennsylvania along the Ohio River, with a more substantial area extending into southern Ohio. If you compare that to the 2012 map, there were only a few isolated areas of 7A in the lower elevations of southern West Virginia and eastern Kentucky. The solid 7A zone was way down in central and southern Tennessee, so that is a remarkable northward shift over a decade. Would expect it to continue marching northward into northern Ohio by the early 2030s, and probably extending along the lakeshore even further north. I think in the 1990 map, the boundary of Zone 7 was in northern Alabama, perhaps far southern Tennessee. So in just 30 years, we have seen Zone 7's northern terminus shift from northern Alabama into south central Ohio.
-
Pittsburgh/Western PA Fall 2023 Discussion
TheClimateChanger replied to Ahoff's topic in Upstate New York/Pennsylvania
Special Weather Statement National Weather Service Pittsburgh PA 728 AM EST Wed Nov 15 2023 PAZ007>009-013>016-020>022-029-031-073>078-152300- Mercer-Venango-Forest-Lawrence-Butler-Clarion-Jefferson PA-Beaver- Allegheny-Armstrong-Washington-Greene-Westmoreland- Higher Elevations of Westmoreland-Fayette- Higher Elevations of Fayette-Indiana-Higher Elevations of Indiana- Including the cities of Sharon, Hermitage, Grove City, Oil City, Franklin, Tionesta, New Castle, Ellwood City, Butler, Clarion, Punxsutawney, Brookville, Aliquippa, Beaver Falls, Ambridge, Monaca, Pittsburgh Metro Area, Kittanning, Ford City, Washington, Canonsburg, Waynesburg, Murrysville, Greensburg, New Kensington, Lower Burrell, Latrobe, Monessen, Ligonier, Donegal, Uniontown, Champion, Ohiopyle, Indiana, and Armagh 728 AM EST Wed Nov 15 2023 ...ELEVATED RISK OF WILDFIRE SPREAD THIS AFTERNOON... A combination of dry and windy conditions this afternoon will create an elevated risk of wildfire spread across western Pennsylvania, including Allegheny National Forest. Minimum relative humidity values will range from 20 to 30 percent accompanied by wind gusts between 15 and 20 mph. Residents are urged to exercise caution if handling any potential ignition sources, such as machinery, cigarettes, or matches. If dry grasses and tree litter begin to burn, the fire will have the potential to spread rapidly. For more information about wildfire danger and wildfire prevention and education, please visit the Pennsylvania Department of Conservation and Natural Resources website at http://dcnr.pa.gov/Communities/Wildfire. $$ TC


