TheClimateChanger
-
Posts
4,574 -
Joined
-
Last visited
Content Type
Profiles
Blogs
Forums
American Weather
Media Demo
Store
Gallery
Everything posted by TheClimateChanger
-
Pittsburgh, Pa Winter 2023-24 Thread.
TheClimateChanger replied to meatwad's topic in Upstate New York/Pennsylvania
Wow, came in fast. PIT has had 2/3 of an inch of precipitation already in three hours. -
Can't argue with you there. And, my bad, I think the small discrepancy in amounts may have simply been you using calendar years. When I want a mean of a series, I'll often just throw it in NowData which does the math automatically, but it defaults to winter season [water year] for snowfall amounts, rather than calendar year.
-
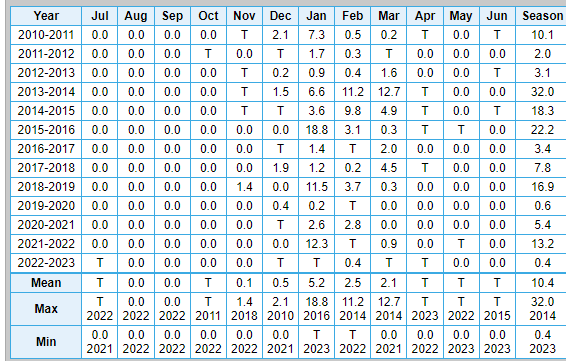
One correction: I believe you are beginning in 2010-2011 [and presumably not counting this winter, which is still early on], that it 13 seasons through 2022-2023. Also, the mean, according to NowData, at DCA is 10.4" not 10.6" over that interval. That's an interesting thought though. If we look at Greensboro, the 1951-1980 and 1961-1990 mean were 10.3 inches. The mean from 2011-2023 is down to 7.0 inches. At Richmond, the 1951-1980 mean was 16.1 inches, and it bumped up to 16.4 inches in 1961-1990. The last 13 seasons, the mean is down to 8.6 inches. At DCA, the 1951-1980 mean was 17.9 inches, which increased to 18.5 inches in 1961-1990. As noted, per NowData, the mean of the past 13 years is just 10.4 inches. I like to do comparisons of 2010-present to the mid and late 20th century normals, because it seems like 2010 was when things really went south. And the 1951-1980/1961-1990 normals give a useful comparison as those were the normals in place when Millenials and younger GenX were youths.
-
Pittsburgh, Pa Winter 2023-24 Thread.
TheClimateChanger replied to meatwad's topic in Upstate New York/Pennsylvania
We could see a bit this weekend too. The GFS suggests a couple inches from wraparound snows are possible. It does turn much colder Saturday afternoon, although I'm kind of doubtful the low stalls out for that long. May be too robust with the wraparound precipitation. -
Pittsburgh, Pa Winter 2023-24 Thread.
TheClimateChanger replied to meatwad's topic in Upstate New York/Pennsylvania
Looks like the European modeling has a snow threat next week for the eastern US, but that's still over a week out. -
Pittsburgh, Pa Winter 2023-24 Thread.
TheClimateChanger replied to meatwad's topic in Upstate New York/Pennsylvania
Looks like a warm & wet to cold & dry pattern for a little while. Doubt we will see much snow for the next week. Even with the recent snowfall, still the 14th lowest seasonal amount (out of 144 years) through January 8. Only 2007, 2016, 1995 & 1966 had less since observations have been taken at KPIT, with one other year (1941) at KAGC. I guess coming off the 8th least seasonal tally last winter, that can be seen as a small improvement. Looking at current averages, we need nearly one-half inch per day just to keep pace with normals at this time of the year. Not sure we do that. If there's one good thing, it looks like the East Coast folks will be even worse off. But the Chicago area looks favored for some heavy snows.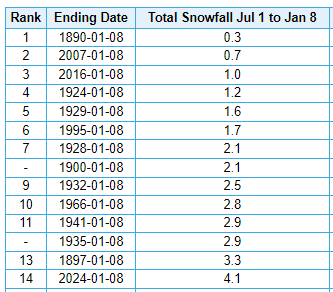
-
Central PA Winter 23/24
TheClimateChanger replied to Voyager's topic in Upstate New York/Pennsylvania
All I remember is the daily pest lists. -
Central PA Winter 23/24
TheClimateChanger replied to Voyager's topic in Upstate New York/Pennsylvania
That's the old usenet group, right? That place was always whack. -
Pittsburgh, Pa Winter 2023-24 Thread.
TheClimateChanger replied to meatwad's topic in Upstate New York/Pennsylvania
Looks like about an inch here. -
Pittsburgh, Pa Winter 2023-24 Thread.
TheClimateChanger replied to meatwad's topic in Upstate New York/Pennsylvania
That’s expected though, no? I clicked on the forecast for Clarksburg and it said heavy rain today. Also, the forecast is down to an inch now for our area. So some disconnect there with the advisory in parts of the region. -
Pittsburgh, Pa Winter 2023-24 Thread.
TheClimateChanger replied to meatwad's topic in Upstate New York/Pennsylvania
Where are they seeing 17 inches? -
Pittsburgh, Pa Winter 2023-24 Thread.
TheClimateChanger replied to meatwad's topic in Upstate New York/Pennsylvania
Could be worse. Through Hour 57, Kuchera is showing 2.0 inches at Pittsburgh (City), and 10:1 ratio is showing 2.7 inches [on the Pivotal Weather site, anyways]. I think most of us would accept a couple of inches at this point. Just a shame we are in the heart of winter and 10:1 ratio is yielding more than Kuchera. I think Kuchera clown maps are a thing of the past. It's just too warm to get it to show those absurb ratios these days. Kuchera ratio snowfall has generally been less than 10:1 ratio this winter. -
Pittsburgh, Pa Winter 2023-24 Thread.
TheClimateChanger replied to meatwad's topic in Upstate New York/Pennsylvania
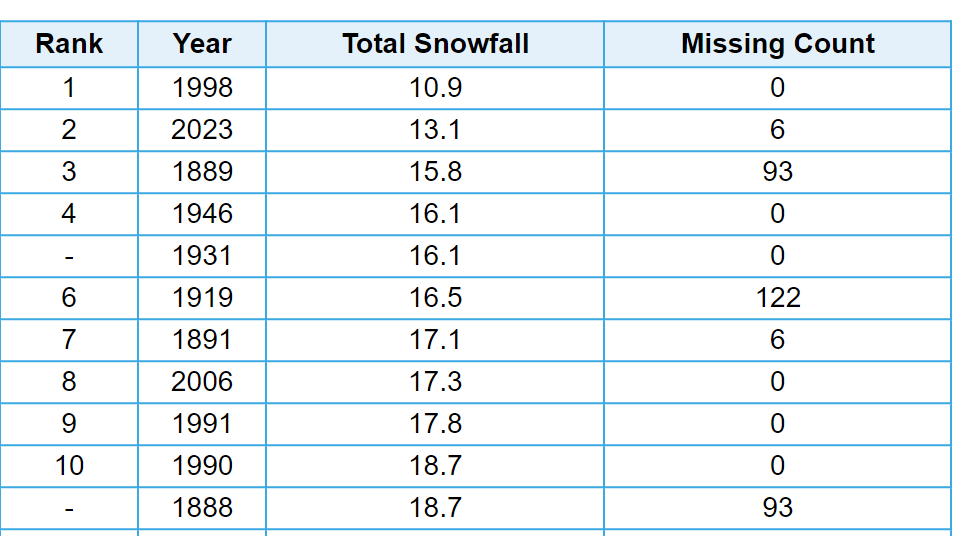
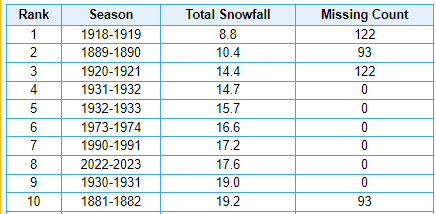
Hard not too, with all the snowfall futility and warm weather records of late. Ninth lowest snowfall to date on record. Several recent years show up, including 2007, 2016 & 2022 with even slower starts. Eighth lowest seasonal snowfall on record last winter [3rd lowest at KPIT]. 1879-1880 shows 10.2 inches, but snowfall records don't begin until 1/1/1880, so I filtered that out. As for the other years showing missing days, typically with multiples of 30/31, it's just warm weather months where they didn't fill in zeroes showing up as missing - but there could be missing data. I did not check. One thing that's interesting is how there's less and less snowfall prior to early January. The total seasonal snowfall continues to be dominated by lower elevation city data, which also far predates the use of a snowboard and 6-hour measurements. Of course, it doesn't matter where or how the snow is measured if there's simply no snow falling (which increasingly appears to be the case before early/mid January). EDIT: NWS Pittsburgh has 1889-1890 at 11.4 inches, not 10.4 inches. All of the other years appear to match the NWS data.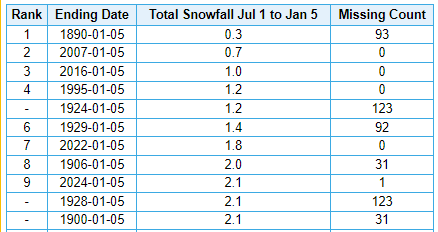
-
Pittsburgh, Pa Winter 2023-24 Thread.
TheClimateChanger replied to meatwad's topic in Upstate New York/Pennsylvania
You may be on to something. 850s are right at freezing on the NAM at hour 30 when some of the heaviest precipitation is falling. Even a fraction of a degree warmer will melt the snow before it reaches the surface. -
Central PA Winter 23/24
TheClimateChanger replied to Voyager's topic in Upstate New York/Pennsylvania
At Williamsport, it was the warmest year on record with a mean temperature of 54.0F: It was also the warmest mean maximum (64.1F) and mean minimum (43.8F) on record. Calendar year snowfall totaled a paltry 12.0 inches, good for second least on record behind 2006. Temperature and snowfall records for Williamsport date back to 1896.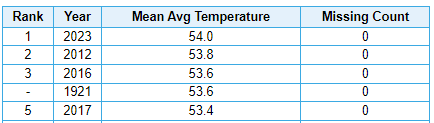
-
Central PA Winter 23/24
TheClimateChanger replied to Voyager's topic in Upstate New York/Pennsylvania
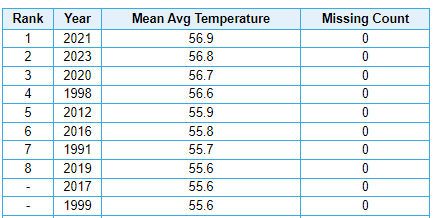
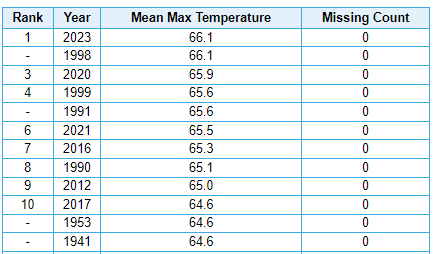
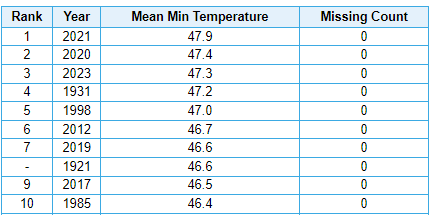
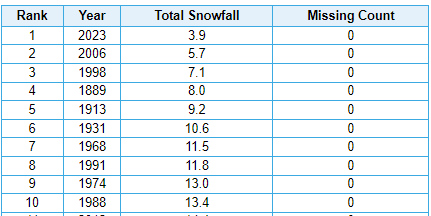
The final numbers are in on an historic year for weather enthusiasts! Here are some notable records from Harrisburg, PA: Mean temperature (averaged by month) tied 2021 for the record of 56.7F. Averaging by day (which is slightly more accurate when, as here, there are no missing days), it was just a hair below 2021: The mean maximum temperature of 66.1F tied 1998 for the record highest value: The mean minimum temperature of 47.3F, was good for third warmest of record behind 2021 & 2020. Also, of note, calendar year snowfall of 3.9 inches, easily bested 2006 for the least amount on record. Temperature and snowfall records date to 1889 for the Harrisburg area.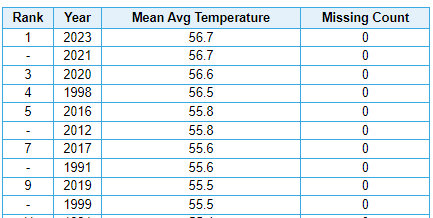
-
Pittsburgh, Pa Winter 2023-24 Thread.
TheClimateChanger replied to meatwad's topic in Upstate New York/Pennsylvania
At least they've got some good college football up there now. -
Yes, sorry. April 26th.
-
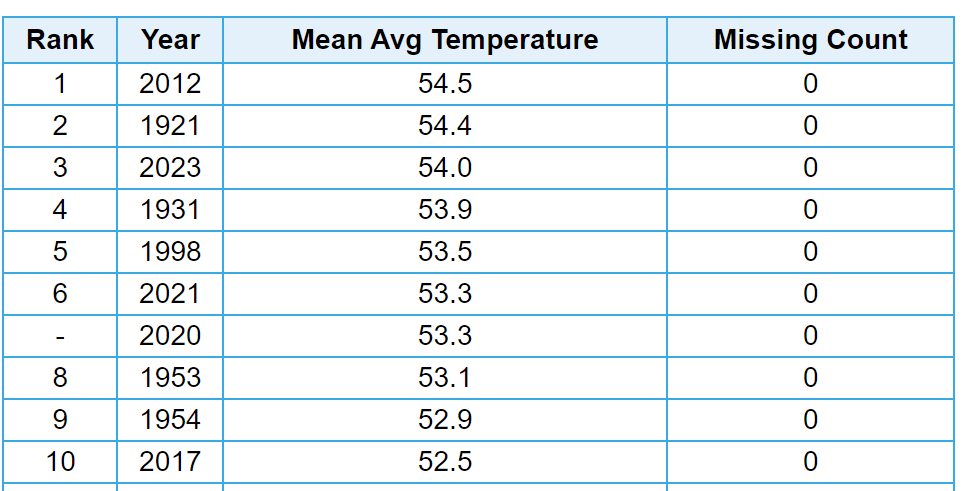
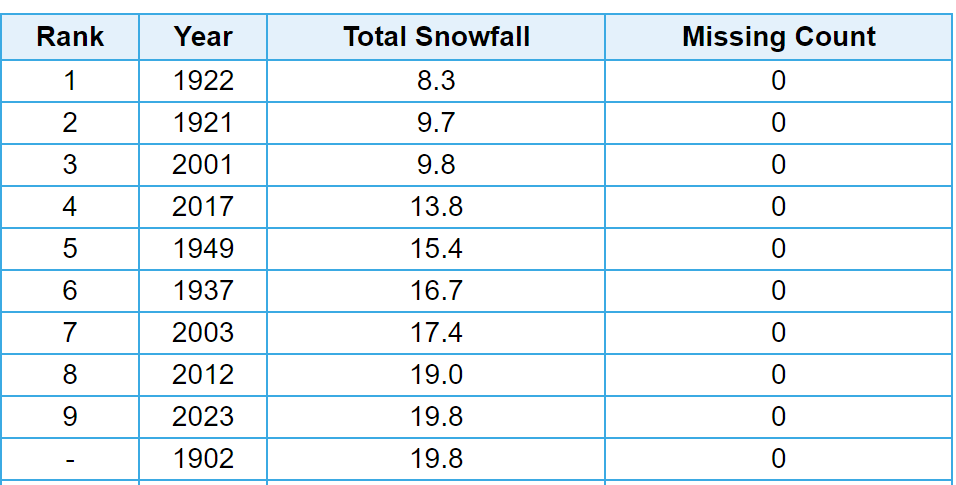
Happy New Year all! 2023 was certainly an historic year on the weather front. Here are some characteristic statistics from Chicago for the year. The annual mean temperature of 54.0F, was the third highest in the threaded records, behind 2012 and 1921. Not shown, but the mean maximum temperature of 62.4F was second warmest on record behind 2012, and the mean minimum temperature of 45.7F was third warmest on record behind 1921 and 1931. Precipitation totaled 33.73 inches, just a bit drier than the median [71st driest of 153 years]. Snowfall for the calendar year totaled 19.8 inches, tying 1902 for the 9th least snowfall in a calendar year. Of note, 6 of the 11 least snowy calendar years have occurred within the past 23 years (2006, is 11th). Notable daily observations: Highest Maximum temperatures [records in bold] 83F, on 4/13 - Highest 83F on 4/14 - Second highest 87F on 5/7 - Highest (tied) 91F on 5/30 - Third highest (tied) 98F on 8/23 - Highest 100F on 8/24 - Highest (tied) 87F on 10/1 - Second highest 87F on 10/3 - Third highest (tied) 83F on 10/24 - Highest (tied) 59F on 12/25 - Second highest Lowest Maximum temperatures [records in bold] None in top three. Lowest Minimum temperatures [records in bold] 31F on 4/26 - Third lowest (tied) Highest Minimum temperatures [records in bold] 39F on 1/3 - Second highest (tied) 38F on 1/11 - Third highest 40F on 1/16 - Third highest 36F on 1/18 - Third highest (tied) 36F on 2/9 - Third highest (tied) 64F on 4/15 - Second highest (tied) 77F on 8/23 - Highest 75F on 8/24 - Second highest (tied) 68F on 10/4 - Third highest (tied) 62F on 10/24 - Third highest 61F on 10/25 - Second highest 65F on 10/26 - Highest 46F on 12/8 - Second highest 41F on 12/16 - Third highest (tied) 48F on 12/24 - Third highest 50F on 12/25 - Highest
-
Still managed 4 of the top ten in the last 27 years. Considering there’s 155 years of records, that’s a fair amount for that time frame.
-
Pittsburgh, Pa Winter 2023-24 Thread.
TheClimateChanger replied to meatwad's topic in Upstate New York/Pennsylvania
Nice surprise here. A little less than an inch. Very picturesque with the snow clinging to all surfaces, except paved surfaces which are just wet. -
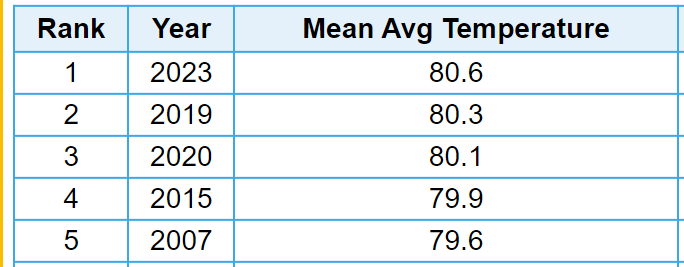
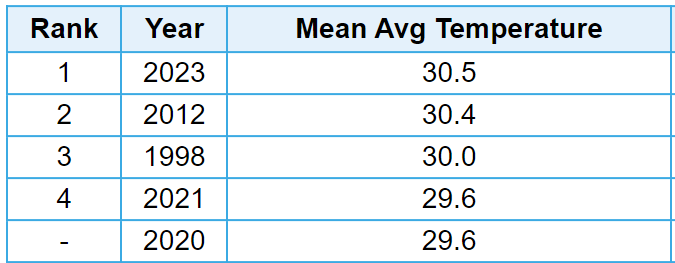
Just an absolutely historic year with record breaking heat from Key West to the top of Mount Washington. Unreal. Nice symmetry there too. One of only three years with a mean average temperature greater than 80F at Key West (2023, 2020, 2019), and one of only three years with a mean average temperature greater than 30F at Mount Washington (2023, 2012, 1998).
-
El Nino 2023-2024
TheClimateChanger replied to George001's topic in Weather Forecasting and Discussion
Yeah, this is what I’ve seen discussed recently on Reddit too. Mold and fungus everywhere. Also, weird bugs replacing the native insect populations. https://www.reddit.com/r/Homesteading/s/tcUBi9rZtS -
Pittsburgh, Pa Winter 2023-24 Thread.
TheClimateChanger replied to meatwad's topic in Upstate New York/Pennsylvania
Look at this cope. 804-hour ensemble mean and control run. I'm old enough to remember when every 384 hour run in the wintertime had more snow than this. For Pittsburgh (and much of the region, for that matter), the ensemble mean looks below average to me. A foot over 35 days in the heart of winter? The control run looks about average, maybe a bit above (16-18 inches around Pittsburgh). Sure this would be a godsend compared to the last couple of years, but it certainly isn't anything unusual outside of the NYC to New England region [which probably won't happen because this is an 804 hour model run]. I love how he focuses on the control run showing 30 inches in NYC - how about it showing an inch in Minneapolis, and only a foot in the UP of Michigan? More snow in west Texas than Marquette? -
Maybe 2024 will be better.