TheClimateChanger
-
Posts
4,574 -
Joined
-
Last visited
Content Type
Profiles
Blogs
Forums
American Weather
Media Demo
Store
Gallery
Everything posted by TheClimateChanger
-
Winter '23-'24 Piss and Moan/Banter Thread
TheClimateChanger replied to IWXwx's topic in Lakes/Ohio Valley
Good stuff. Here's the same comparison, except with the city that fans of old school TWC might recall as "the best location in nation - Cleveland, Ohio." @michsnowfreak put the 2003-04 snow hole out of his memory. Don't know what was going on in 1918-19, it's more than a foot below any other year.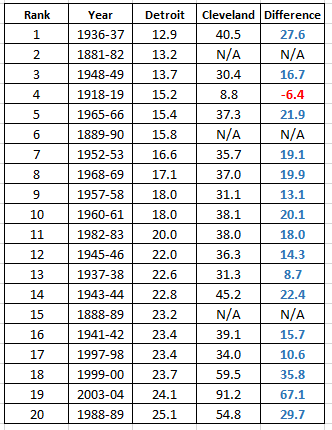
-
-
Let's hope this is erroneous. National Weather Service : Observed Weather for past 3 Days : Stafford, Stafford Regional Airport
-
That's at least 3 monthly records just in the past 12 months - 78+, 1/26/2024; 80F on 2/23/2023; and 100F on 9/6/2023.
-
Wow, incredible stuff. Just blowing away the monthly record.
-
Central PA Winter 23/24
TheClimateChanger replied to Voyager's topic in Upstate New York/Pennsylvania
Nah, DuBois is more central than western. The airport just happens to be over the border in Jefferson County, so it falls within NWS Pittsburgh's CWA. -
Central PA Winter 23/24
TheClimateChanger replied to Voyager's topic in Upstate New York/Pennsylvania
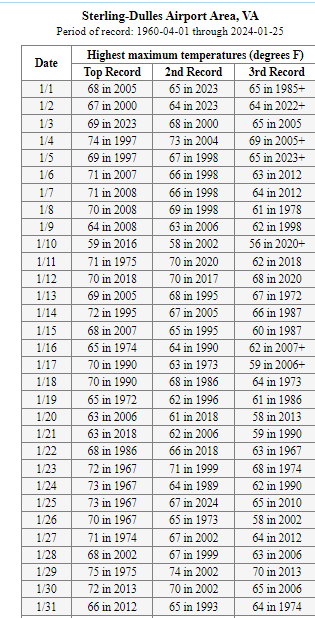
000SXUS71 KPBZ 261057RERDUJRECORD EVENT REPORTNATIONAL WEATHER SERVICE PITTSBURGH PA555 AM EST FRI JAN 26 2024...RECORD HIGH TEMPERATURE SET AT DUBOIS PA...THE TEMPERATURE AT DUBOIS AIRPORT ROSE TO 60F AT 543 AM EST THIS MORNING. THIS IS RECORD HIGH FOR THE DATE. THE PREVIOUS RECORD WAS 55F IN 1973. THE TEMPERATURE MAY RISE FURTHER THIS MORNING SO THIS INFORMATION IS PRELIMINARY. $$CRAVEN -
Central PA Winter 23/24
TheClimateChanger replied to Voyager's topic in Upstate New York/Pennsylvania
MDT struggling. I guess that's what happens when you take temperatures right next to a freezing cold river. -
Pittsburgh, Pa Winter 2023-24 Thread.
TheClimateChanger replied to meatwad's topic in Upstate New York/Pennsylvania
Well, I don't think I chased them to Discord. It was one of the last posts in the thread, because they had already moved to Discord. -
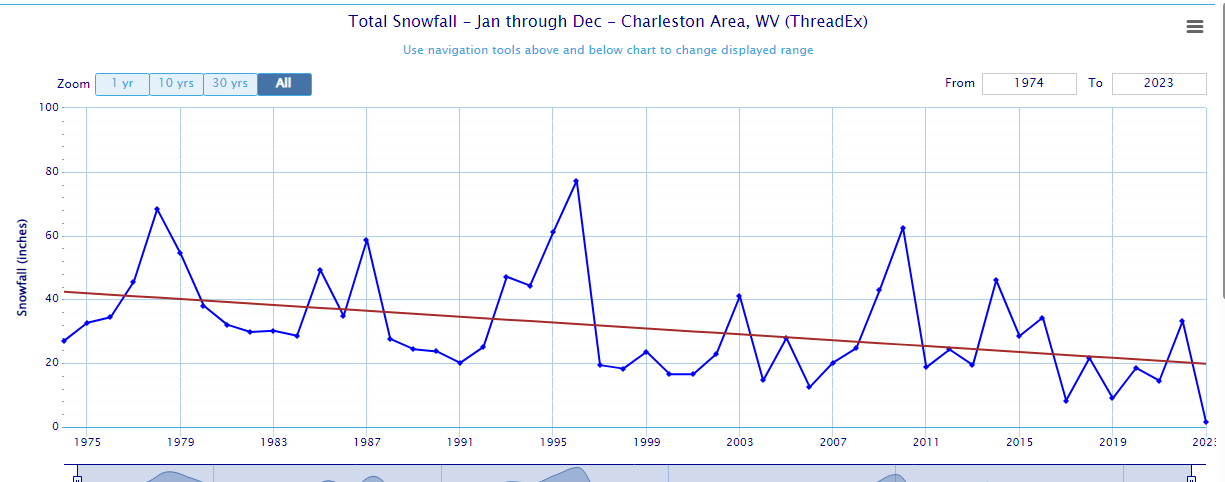
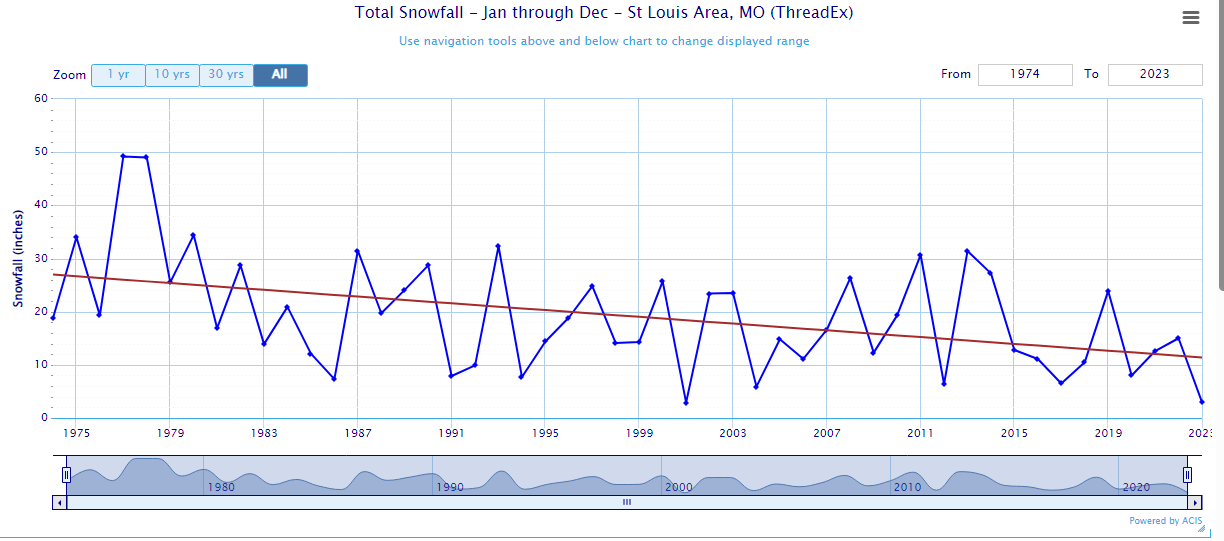
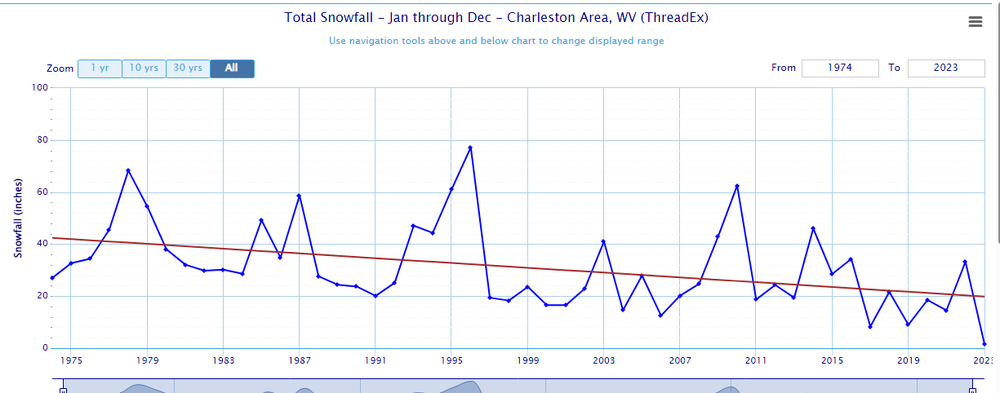
Good thing this is the banter thread. It looks like 40N has been the cutoff between huge drops in seasonal snowfall south of that line, and much smaller changes north. @MikeB_01 got me playing around on xmACIS again. And, man, some places not too much further south have been absolutely hammered over the past 50 years. Charleston, WV St Louis, MO

-
Shows -5 to -25 percent for annual snowfall for Des Moines. Mostly smoothing, I believe. Even using the annual numbers, DSM shows a slight positive trend [almost flat]. But most locations in the midwest show a much stronger negative trend over that period. But yeah, definitely a much higher percentage of snow is falling in meteorological winter - and particularly, January and February - than prior decades, in most locations.
-
Keep in mind that data is subject to smoothing, and there can be variances. The linear regression at PIT over that interval is actually positive, with a slope of +0.05" (or a gain of about 2.5" over 50 years). But most locations around us are negative, and substantially so. Cleveland, for instance, shows a negative slope of -0.29" per year (or a loss of about 14.5" over 50 years). So it's sensitive to start and ending dates - 1973-1974 was a historically bad winter for Pittsburgh, but not as bad elsewhere.
-
Pittsburgh, Pa Winter 2023-24 Thread.
TheClimateChanger replied to meatwad's topic in Upstate New York/Pennsylvania
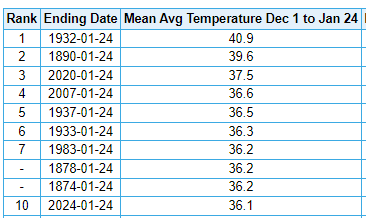
I didn't even bring up climate change, to be honest. I thought it was interesting. It's not some random record for consecutive days above a random temperature... it was noting that, hey, 2/3rds of the way through met. winter and this has been the warmest of any of our lives. We have all lived through some real clunkers, I think it's noteworthy when, with one month remaining in meteorological winter, we are warmest of record at KPIT and warmest overall in the threaded record in 74 years. I think some are just frustrated. For the record, just factoring in yesterday's blowtorch, brings the two-month average up to 37.4F. I mean that's not exactly ideal for winter weather. Hell, the warmest at KPIT from 12-1 to 1-31 currently is 36.4F, set in the winter of 2001-02 so we could potentially blast by that by a full degree. -
Pittsburgh, Pa Winter 2023-24 Thread.
TheClimateChanger replied to meatwad's topic in Upstate New York/Pennsylvania
-
-
The data for PNE are also made up. The real chart is the one @chubbsshared.
-
Central PA Winter 23/24
TheClimateChanger replied to Voyager's topic in Upstate New York/Pennsylvania
He’s popping the champagne to celebrate his forecast. Interesting way to verify a forecast. Instead of using the climatological normal of 11.7 inches, use the significantly lower moving 10- and 20-year averages. Also the 10-year average is 8.8 inches, not 8.1. And the 20 year average doesn’t actually include 20 years as there were no snow observations for much of the 2000s at AVP. And just ignore temperatures altogether. They don’t matter. And forget the entire month of December. Just toss that into the trash. -
Winter '23-'24 Piss and Moan/Banter Thread
TheClimateChanger replied to IWXwx's topic in Lakes/Ohio Valley
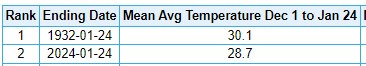
The infamous winter of 1931-32 is well within striking distance for MKE. Can it succumb to the super Nino?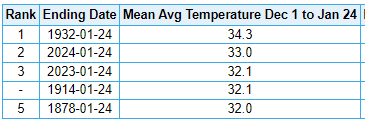
-
Winter '23-'24 Piss and Moan/Banter Thread
TheClimateChanger replied to IWXwx's topic in Lakes/Ohio Valley
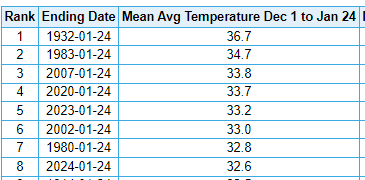
Great weather for the Milwaukee palms this winter, where it has been the second warmest to date and one of only 4 years with a mean temperature above freezing for the 12-1 to 1-24 period. Last year being one of the 4.
-
Central PA Winter 23/24
TheClimateChanger replied to Voyager's topic in Upstate New York/Pennsylvania
How did we manage to do it at the same time? -
Central PA Winter 23/24
TheClimateChanger replied to Voyager's topic in Upstate New York/Pennsylvania
Highs in the mid 40s, with lows barely below freezing, are cold for early February in Chester County? -
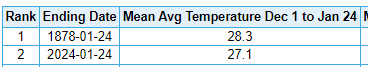
Winter 2023/24 Medium/Long Range Discussion
TheClimateChanger replied to Chicago Storm's topic in Lakes/Ohio Valley
You would have thought we just went through the second coming of January 1994 with all of the media hype, yet everybody is having a top 10 warmest winter so far (with even warmer temperatures occurring now). In fact, record breaking warmth across the north country. -
Winter 2023/24 Medium/Long Range Discussion
TheClimateChanger replied to Chicago Storm's topic in Lakes/Ohio Valley
Winter to date temperatures below for some selected sites in the midwestern United States. Looks like 2023-24 will be moving up on these lists through at least the beginning of February. Detroit (9th warmest) Cleveland (10th warmest) Toledo (10th warmest) Fort Wayne (9th warmest) South Bend (8th warmest) Lansing (6th warmest) Mansfield, Ohio (10th warmest) Marquette (NWS) (warmest) Green Bay (2nd warmest) Minneapolis/St. Paul (2nd warmest) International Falls (warmest)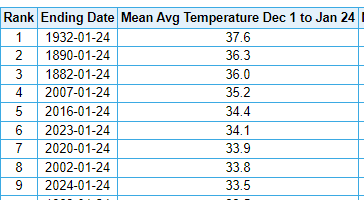

-
Central PA Winter 23/24
TheClimateChanger replied to Voyager's topic in Upstate New York/Pennsylvania
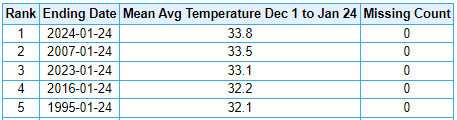
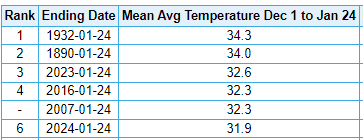
Noted northeast Pennsylvania meteorologist Mark Margavage on X/Twitter predicted lots of cold and snow for the region with a polar vortex warning. So far, this idea has not worked out. This has been the 6th warmest winter to date in the Scranton/Wikes-Barre area, and looks poised to climb over the next week.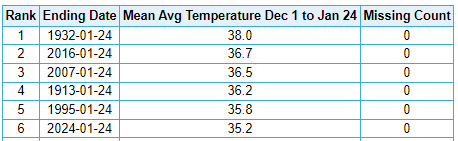
-
Central PA Winter 23/24
TheClimateChanger replied to Voyager's topic in Upstate New York/Pennsylvania
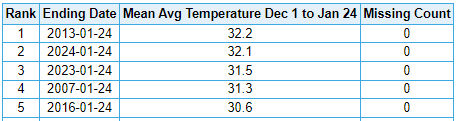
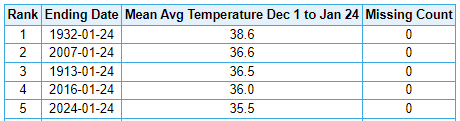
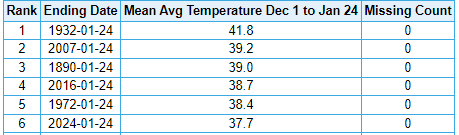
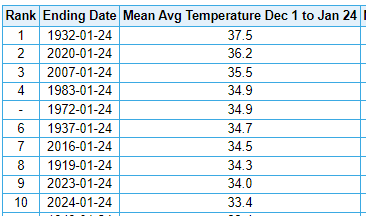
With a big warmup ongoing and looking to have some staying power, here is where we stand temperaturewise for winter to date at some climate locations in central Pennsylvania. DuBois (warmest) Bradford (2nd warmest) Williamsport (5th warmest) Harrisburg (6th warmest)