TheClimateChanger
-
Posts
4,598 -
Joined
-
Last visited
Content Type
Profiles
Blogs
Forums
American Weather
Media Demo
Store
Gallery
Everything posted by TheClimateChanger
-
June 16th-21st (and beyond?) Heatwave
TheClimateChanger replied to Geoboy645's topic in Lakes/Ohio Valley
Thanks for the update. -
Pittsburgh, Pa Summer 2024 Thread.
TheClimateChanger replied to meatwad's topic in Upstate New York/Pennsylvania
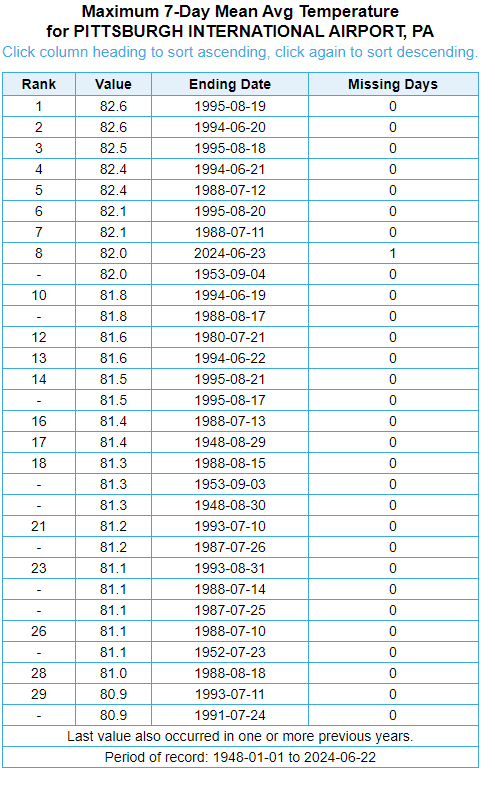
Using the entire threaded record (1875-2024), including the downtown city office records, and the expected value of 81.4F, this will be the hottest 7-day period ever wholly in June behind only 1994 (7-days ending 6-19, 6-20, 6-21, and 6-22). While the magnitude might have been exaggerated, and this might be an unpopular opinion, the NWS did correctly indicate that this would be the hottest stretch in June since 1994 [although it clearly did not exceed 1994, even though they distinctly indicated that was a possibility]. And they made that forecast with several days lead time. Actually, from the above graphic, you can see the 7-day period ending yesterday already on this list with a mean 80.6F, which alone makes it the highest in the month of June behind only the 4 dates from 1994, and one week each in 1888 and 1952 [and tied with the week ending 6/30/1933 & 6/24/1884]. As noted, the 7-day period ending today should be even higher and likely finish around 81.4F.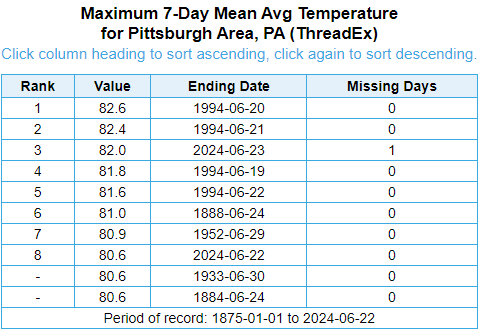
-
Pittsburgh, Pa Summer 2024 Thread.
TheClimateChanger replied to meatwad's topic in Upstate New York/Pennsylvania
Say what you will about the heat wave underperformance but the most recent 7 days will indeed be the hottest 7-day stretch [as measured by average mean temperature] in 29 years at Pittsburgh International Airport. Indeed, the hottest 7-day period since the ASOS has been installed. A lot of these are duplicates, i.e. longer single hot stretches that had multiple different 7-day periods. For context, the 82.0F mean only includes 6 days. But today's high was 86, low so far 75. Estimating the low will drop to 70F by 1 am, we get 82.0 x 6 + 78 = 570 / 7 = 81.4F. Not sure how plausible it is that we had stretches on this list from 1987, 1988, 1991, 1993, 1994 and 1995 in a narrow 10-year window with a known warm biased thermometer, but I'll leave that conspiracy hat off for now. The 1948 & 1952 periods are actually from AGC, even though incorrectly included in this dataset. The only other comparable 7-day means at Pittsburgh International (not in the aforementioned 10-year period) are the 7-days ending 7/21/1980 & 9/3/1953.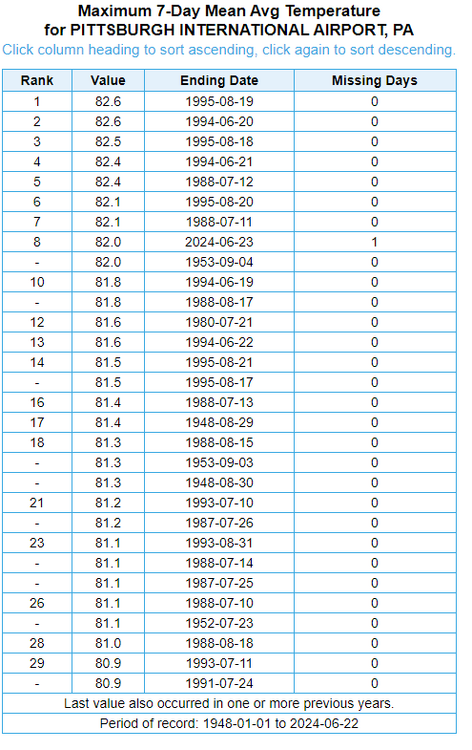
-
Pittsburgh, Pa Summer 2024 Thread.
TheClimateChanger replied to meatwad's topic in Upstate New York/Pennsylvania
80 degrees already. -
Central Pa. Summer 2024
TheClimateChanger replied to mahantango#1's topic in Upstate New York/Pennsylvania
000SXUS71 KPBZ 222127RERDUJRECORD EVENT REPORTNATIONAL WEATHER SERVICE PITTSBURGH PA0525 PM EDT SAT JUN 22 2024...RECORD HIGH TEMPERATURE SET AT DUBOIS PA...A RECORD HIGH TEMPERATURE OF 92 DEGREES WAS SET AT DUBOIS PA TODAY.THIS BREAKS THE OLD RECORD OF 91 DEGREES SET IN 2022. THIS ALSO TIES THE ALL-TIME TEMPERATURE RECORD FOR JUNE.$$MILCAREK -
Central Pa. Summer 2024
TheClimateChanger replied to mahantango#1's topic in Upstate New York/Pennsylvania
Wow! Generational heat in Chester! -
Central Pa. Summer 2024
TheClimateChanger replied to mahantango#1's topic in Upstate New York/Pennsylvania
000SXUS71 KCTP 212125RERIPTRECORD EVENT REPORTNATIONAL WEATHER SERVICE STATE COLLEGE PA0523 PM EDT FRI JUN 21 2024...RECORD HIGH TEMPERATURE SET AT WILLIAMSPORT PA...A RECORD HIGH TEMPERATURE OF 98 DEGREES WAS SET AT WILLIAMSPORT PATODAY. THIS BREAKS THE OLD RECORD OF 97 DEGREES SET IN 1923. -
Pittsburgh, Pa Summer 2024 Thread.
TheClimateChanger replied to meatwad's topic in Upstate New York/Pennsylvania
-
Pittsburgh, Pa Summer 2024 Thread.
TheClimateChanger replied to meatwad's topic in Upstate New York/Pennsylvania
-
Central Pa. Summer 2024
TheClimateChanger replied to mahantango#1's topic in Upstate New York/Pennsylvania
That 57 near East Berlin (Brrr-Lin) looking mighty nice right about now. -
Pittsburgh, Pa Summer 2024 Thread.
TheClimateChanger replied to meatwad's topic in Upstate New York/Pennsylvania
Dewpoint has dropped back into the comfortable 50s. -
Pittsburgh, Pa Summer 2024 Thread.
TheClimateChanger replied to meatwad's topic in Upstate New York/Pennsylvania
Record high of 90F at DuBois - likely to rise higher. That's the fifth consecutive daily record. Even for a relatively small period, very impressive. Good chance of matching or exceeding the monthly record of 92F, set on June 30, 1969, and earlier in this heat stretch (June 18, 2024). That's also 4 90+ readings on the year. For context, only 6 entire years since 1962 have seen more 90+ days, and this is only June 21! Those 6 years are: 1988, with 20; 2020 & 1966, with 8 each; 2010, with 6; and 2016 & 2011, with 5 each. Odd how 1800' elevation is obliterating records from 1988 & 1994, but they claim it was so much hotter in Pittsburgh. Like they are going to toe to toe with the 1994 heat episode, and breaking records set during that stretch by noon every day. Seems strange to me. -
Central Pa. Summer 2024
TheClimateChanger replied to mahantango#1's topic in Upstate New York/Pennsylvania
Record high of 90F at DuBois. That's the fifth consecutive daily record. Even for a relatively small period, very impressive. Good chance of matching or exceeding the monthly record of 92F, set on June 30, 1969, and earlier in this heat stretch (June 18, 2024). That's also 4 90+ readings on the year. For context, only 6 entire years since 1962 have seen more 90+ days, and this is only June 21! Those 6 years are: 1988, with 20; 2020 & 1966, with 8 each; 2010, with 6; and 2016 & 2011, with 5 each. -
Pittsburgh, Pa Summer 2024 Thread.
TheClimateChanger replied to meatwad's topic in Upstate New York/Pennsylvania
Baking today. PIT ASOS popping an 88F at 10:25. -
Central Pa. Summer 2024
TheClimateChanger replied to mahantango#1's topic in Upstate New York/Pennsylvania
Just checked MDT and it's the same story. -
Central Pa. Summer 2024
TheClimateChanger replied to mahantango#1's topic in Upstate New York/Pennsylvania
Yeah, I haven't noticed this phenomenon. At PIT, highs are actually more above normal than lows so far this month, with the diurnal range near 21F. I'm sure rural and outlying areas probably have diurnal ranges on the order of 22-24F this month. -
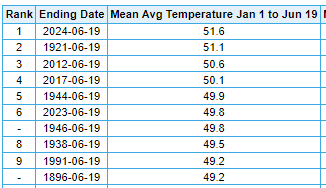
While the thread creator suggesting sticking a fork in the month of June, Dayton International Airport observed its 4th consecutive 90+ reading today [coming off an 89F on Sunday]. The forecast calls for 90+ through Sunday, which, if it were to occur, would be the most 90F readings through June 23rd in any year since 1994. In addition, Dayton continues to impress from a temperature standpoint in 2024. The mean temperature through yesterday stood at 51.6F (and rapidly climbing each day of this heat wave). This is more than 0.5F warmer the second warmest year (2012). Of course, it's worth pointing out that the official observation site was still in the city, which can be as much as 300 feet lower in elevation than the airport, and with a significant urban heat island effect exacerbated by poor siting of the instrument on a building rooftop. Thus, it's likely that 2012 is actually the second warmest, but I digress. Between 1872 & 1996, 15 years at Knoxville saw mean temperatures [through 6-19] equal to or colder than Dayton in the year of our lord 2024. An additional 8 years in that interval were within 0.5F of the Dayton value. Whereas previously Dayton was performing better against Oklahoma City, the very hot summer climate of Oklahoma City is starting to leave Dayton in the dust. However, there were 6 years between 1899 & 1979 that were less than or equal to 51.6F [including one year (1979) that was a whopping 2F colder]. A total of 16 years in that same time interval are no more than 0.5F warmer than 2024 in Dayton. Based on this data, we can conclude that Dayton in 2024 is warmer than 1 out of every 8 years observed in Knoxville during the 19th and 20th century. We can similarly conclude that Dayton is warmer than about 1 in every 13 years in OKC during the first 4/5ths of the 20th century. Although this doesn't tell the full story, since Dayton is relatively warmer in the wintertime and OKC racks up massive numbers in the summertime. As such, it's very unfair to just look straight up since Dayton has a much milder climate overall than OKC.
-
Central Pa. Summer 2024
TheClimateChanger replied to mahantango#1's topic in Upstate New York/Pennsylvania
Pennsylvania is also the new Knoxville, Tennessee. As noted above, KPIT is averaging 51.0F through yesterday [and rapidly climbing each day this heat wave continues]. Downtown Pittsburgh is likely between 52.1F and 54.8F. Just south of the Mason-Dixon line, Morgantown is at 52.4F and Hagerstown, Maryland is at 52.1F. At Knoxville, 6 years between 1885 and 1985 were less than or equal to 51.0F. 23 years between 1873 and 1996 were less than or equal to 52.1F. And 32 years were less than or equal to 52.4F. Using the predicted temperature for downtown Pittsburgh, an incredible 62 years - including as recently as 2013 - were less than or equal to 53.6F. Numerous other years had temperatures close to each of these values. Conclusion: Along the Mason-Dixon line in Pennsylvania, it is currently warmer than about 1 in 3 to 1 in 5 years in Knoxville, Tennessee that occurred in the late 19th and 20th centuries. In suburban Pittsburgh, it's likely warmer than about 1 in every 17 years, but in the urban core perhaps as warm as 1 in every 2-2.5 years. -
Central Pa. Summer 2024
TheClimateChanger replied to mahantango#1's topic in Upstate New York/Pennsylvania
Pennsylvania is the new Charlotte. At Pittsburgh International Airport, the mean temperature for the year through June 19 is 51.0F. Based on 28 years of data (1952-1979), the downtown city office averaged 2.6F warmer than the airport, with a range of +1.1 to +3.8F. Accordingly, we can surmise that the mean temperature in 2024 in downtown Pittsburgh has been approximately 53.6F, with a likely range of 52.1F to 54.8F. For context, KPIT is situated at 1200 feet ASL, whereas downtown Pittsburgh is 700-750 feet ASL [and the urban center of the metropolitan area]. At Charlotte, the mean temperature for the period 1/1 to 6/19 was at or below 53.6F on 17 occasions in the 98 years between 1885 & 1983 - or more than 1 out of every 6 years. An additional 9 years in that same time interval were within 0.5F of that value. Accordingly, we can conclude that the city of Pittsburgh in 2024 is likely warmer than about 1 in every 6 years in Charlotte through the late 20th century.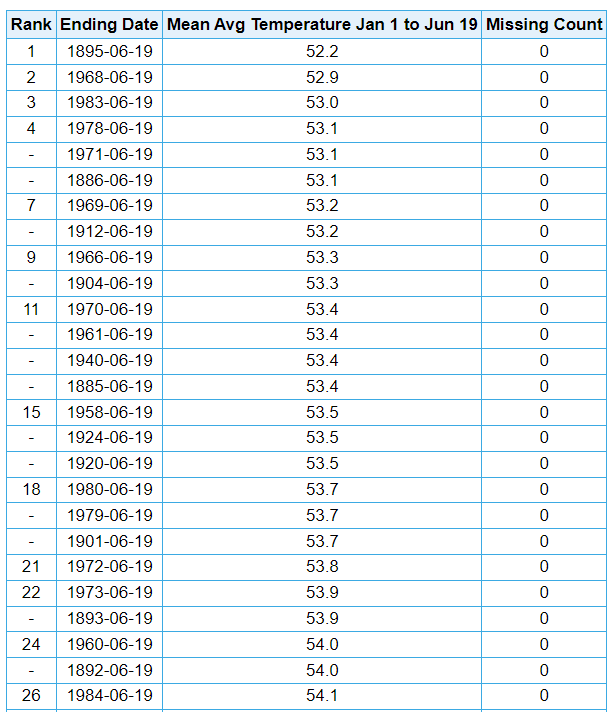
-
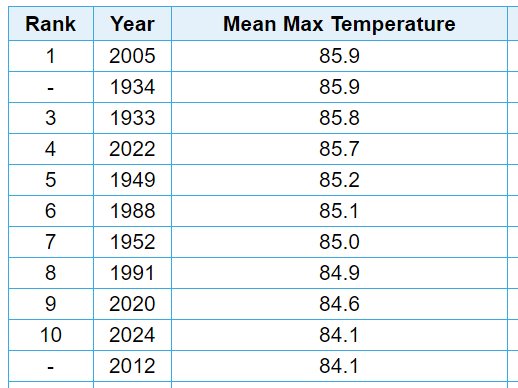
For the record, this analysis is based on the mean maximum temperature. I have been told in the past that it is the low temperatures making the summers warmer and that people judge summer months based on maximum temperatures. With the drought causing unusually large diurnal ranges, I thought maximum temperatures would probably be more appropriate for 2024.
-
Record watch starting again for June. Looks like some locations may see their warmest June on record. At Toledo, the mean maximum for the month stood at 84.1F through yesterday, which would be tenth warmest. With today's 95F factored in, the mean has climbed to 84.6F, placing it in a tie for ninth place. Based on the NWS forecast maximum temperatures, the monthly mean may climb to around 86.2F by the 27th. The current record is 85.9F, set in 1934 & 2005.
-
Pittsburgh, Pa Summer 2024 Thread.
TheClimateChanger replied to meatwad's topic in Upstate New York/Pennsylvania
Sounds like Saturday is going to be a scorcher. 25th percentile NBM temperatures in the mid 90s, with H85 temperatures climbing to 22-24C. 75th-90th percentile temperatures must be pushing triple digits. Record highs are 95 for tomorrow, and 98 for Saturday (also the monthly record). Record max lows are 73F and 75F, respectively. The upper ridge will then begin to retrograde slowly on Saturday but still hold strong enough for one more day providing a continuation of the dangerous heat, and perhaps the hottest day with even the NBM 25th percentile suggesting mid 90s. Ensemble 850 mb temperatures still remain in the 22-24C range. Some records may be challenged. Due to the compounding effects, continued heat indices at and above 100 degrees, and the WPC heat risk tool showing major to extreme impacts, the heat headlines remain in effect through Saturday. That said, as with the past several days, some subtle weaknesses in the flow as the ridge axis pulls south could allow for isolated to scattered afternoon convection to throw wrinkles in the heat, but predictability in coverage and location is low probability at this time range. -
Central Pa. Summer 2024
TheClimateChanger replied to mahantango#1's topic in Upstate New York/Pennsylvania
000SXUS71 KPBZ 202007RERDUJRECORD EVENT REPORTNATIONAL WEATHER SERVICE PITTSBURGH PA406 PM EDT THU JUN 20 2024...RECORD HIGH TEMPERATURE SET AT DUBOIS...A RECORD HIGH TEMPERATURE OF 91 DEGREES WAS SET AT 3:53 PM EDT TODAY AT DUBOIS. THIS BREAKS THE OLD RECORD FOR JUNE 20TH OF 89 DEGREES SET IN 1991. THE TEMPERATURE MIGHT RISE FURTHER AND THIS RECORD REPORT WILL BE UPDATED IF NEEDED. THIS TEMPERATURE IS JUST 1F BELOW THE JUNE RECORD THAT WAS TIED ON JUNE 18, 2024. IN ADDITION, THE LOW THIS MORNING WAS 67F. THE RECORD WARM LOW TEMPERATURE FOR JUNE 20TH IS 66F SET IN 1996. SO UNLESS A THUNDERSTORM FORMS NEARBY AND COOLS THE TEMPERATURE BELOW 66F BEFORE MIDNIGHT, ANOTHER RECORD WOULD BE SET. $$CRAVEN -
Pittsburgh, Pa Summer 2024 Thread.
TheClimateChanger replied to meatwad's topic in Upstate New York/Pennsylvania
Up to 91F at the airport. My home station is baking but I think it gets heat from the balcony rail I have it installed on. Might still reach a respectable 92 or 93 officially today. I still think Saturday will probably wind up being the hottest day of this stretch. Should at least tag an official 3-day heat wave today through Saturday, with Sunday being a toss-up at this point. This area does seem to perform better directly ahead of the cold front, so I think if convection can hold off, we should be able to do it. -
Central Pa. Summer 2024
TheClimateChanger replied to mahantango#1's topic in Upstate New York/Pennsylvania
Site elevation is a big factor in that. A lot of Chester County is several hundred feet higher to as much as 1,000 feet higher in the hills. Would expect most places to be at least a couple degrees cooler to as much as 4-5 degrees in the highest elevations in the northern part of the county. PHL airport is basically at sea level.