TheClimateChanger
-
Posts
4,598 -
Joined
-
Last visited
Content Type
Profiles
Blogs
Forums
American Weather
Media Demo
Store
Gallery
Everything posted by TheClimateChanger
-
It was a passage I had found in a 19th century US climate book, quoting a person who witnessed it.
-
Occasional Thoughts on Climate Change
TheClimateChanger replied to donsutherland1's topic in Climate Change
Here's my little climate tidbit of the day. We can't even imagine how cold it used to be. There was so much ice in the upper lakes following the absolutely frigid winter and spring of 1836-1837, that the Saint Clair River closed to navigation in June as it was flowing downstream. -
On June 1, 1837, the St. Clair River between Lake Huron and Lake Saint Clair closed up with ice. The schooner New York became caught in the ice at Recors Point and was carried downstream. In the same year, ice was harvested from the river until July 4th.
-
Occasional Thoughts on Climate Change
TheClimateChanger replied to donsutherland1's topic in Climate Change
First of all, the digits are Tony's rankings, not percentages. In fact, it looks like 82-83 percent of stations have reached 80F. But more importantly, this is a meaningless statistic for a number of reasons. It's affected by the average elevation, latitude, urban character, etc. of the station mix. If there's a higher percentage of stations in high latitudes and/or higher elevations, you would expect a lower percentage to have recorded an 80F day before the end of May [also, I doubt all of May 2024 has been included in the data -- the month is just now ending]. Further, it's affected by equipment changes. It's well established that a lot of the automated stations report somewhat lower maxima than traditional LiG thermometers housed in a shelter. Even ignoring all this, it's not really meaningful. It looks like pretty much every year at least 80 percent of stations have reached 80F by May 31. There's only about 15 percent or so of stations that vary in a given year - many of which are probably in the same general area [somewhere in the northern US]. Many of these places probably don't see 80+ until late in the spring, so all it would take is a cool spell in May to keep them from reaching that temperature. Meanwhile, the rest of the country could be baking... and even the places that fail to reach 80F might have been way above normal for the majority of the year. -
Central Pa. Spring 2024
TheClimateChanger replied to mahantango#1's topic in Upstate New York/Pennsylvania
Oh we’re you saying “too long, didn’t read” - I thought it was some sort of city or county abbreviation but couldn’t figure out what it could possibly be. -
Central Pa. Spring 2024
TheClimateChanger replied to mahantango#1's topic in Upstate New York/Pennsylvania
What? I don’t know what TL or DR means, but those monthly anomalies would result in one of the hottest summers on record surely. -
-
Occasional Thoughts on Climate Change
TheClimateChanger replied to donsutherland1's topic in Climate Change
-
Occasional Thoughts on Climate Change
TheClimateChanger replied to donsutherland1's topic in Climate Change
-
Occasional Thoughts on Climate Change
TheClimateChanger replied to donsutherland1's topic in Climate Change
I must have missed all the nukes flying when the NordStream 2 blew itself up. -
Pittsburgh/Western PA Spring 2024
TheClimateChanger replied to Ahoff's topic in Upstate New York/Pennsylvania
-
Occasional Thoughts on Climate Change
TheClimateChanger replied to donsutherland1's topic in Climate Change
Overall, an interesting post. Had to truncate the end due to lack of upload space. Must say I'm not sure what all the relevance to Trump is, some of these people just can't post anything without blabbing out Trump. Apparently, a Mormon Mitt, Nimrata Randhawa Haley, Dick-less Cheney, "Dubya" or Ronnie Reagan Republican party would have been so much better.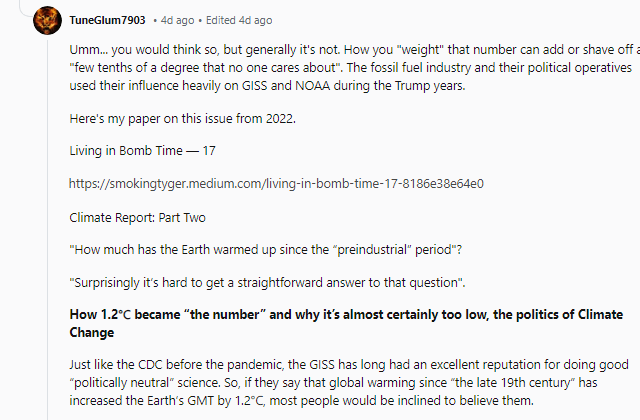
-
Occasional Thoughts on Climate Change
TheClimateChanger replied to donsutherland1's topic in Climate Change
Umm, no. Retaining the tree rings for that era makes the warming more pronounced. But even the very selection of start date was carefully crafted to minimize the warming. Take a look at this interesting Reddit post from user u/TuneGlum7903: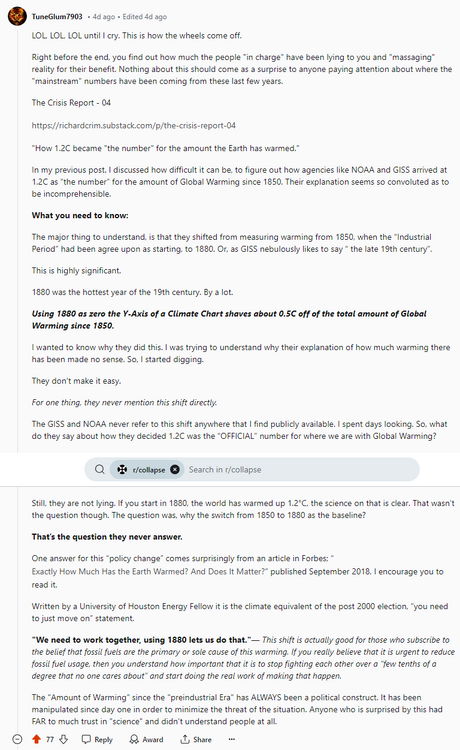
-
Occasional Thoughts on Climate Change
TheClimateChanger replied to donsutherland1's topic in Climate Change
It's more about projecting strength than anything. Sometimes the carrot on the stick doesn't work, and you have to be a little more aggressive. -
Occasional Thoughts on Climate Change
TheClimateChanger replied to donsutherland1's topic in Climate Change
Hi @AdMC, this was my advice to President Trump several years ago: -
Occasional Thoughts on Climate Change
TheClimateChanger replied to donsutherland1's topic in Climate Change
I mean we are almost 2 1/2 years from that eruption. How many more years are these people going to attempt to attribute the global heat wave to that volcano? -
Occasional Thoughts on Climate Change
TheClimateChanger replied to donsutherland1's topic in Climate Change
More tired recycling of the same nonsense. When La Nina begins later this year, can we finally put this nonsense to bed? -
Interesting link I found on reddit [r/minnesota]. It's a report from the Minnesota DNR about the state of the climate, which was just released a few days. This is a Google Drive link to a powerpoint presentation made by the DNR, which is not available elsewhere. Link: State of Climate_MN_May24.pdf - Google Drive
-
Occasional Thoughts on Climate Change
TheClimateChanger replied to donsutherland1's topic in Climate Change
Looks like you were right @ChescoWx, they are lying about the temperature increase. Just in the opposite direction that you claim. -
Occasional Thoughts on Climate Change
TheClimateChanger replied to donsutherland1's topic in Climate Change
-
Occasional Thoughts on Climate Change
TheClimateChanger replied to donsutherland1's topic in Climate Change
Perhaps somewhat surprisingly, based on the chart you shared, his data seems legit. But if it starts to deviate substantially from NOAA, I'm not going to believe him that there is a conspiracy to produce warming, I'm going to assume he is manipulating his readings. -
Occasional Thoughts on Climate Change
TheClimateChanger replied to donsutherland1's topic in Climate Change
To be honest, I don't really trust Chesco's weather data. With all the outlandish things he posts, it would be very easy for someone of his predilections to manipulate the data to show less warming. Holding a block of ice under the sensor on a couple of mornings each month to produce spuriously cool data, and gradually increasing the frequency of such manipulations, could largely erase the warming trend. I know, in the past, he has admitted these temperatures were measured from different devices over time. Now he claims the same equipment has been in place for two decades. -
Occasional Thoughts on Climate Change
TheClimateChanger replied to donsutherland1's topic in Climate Change
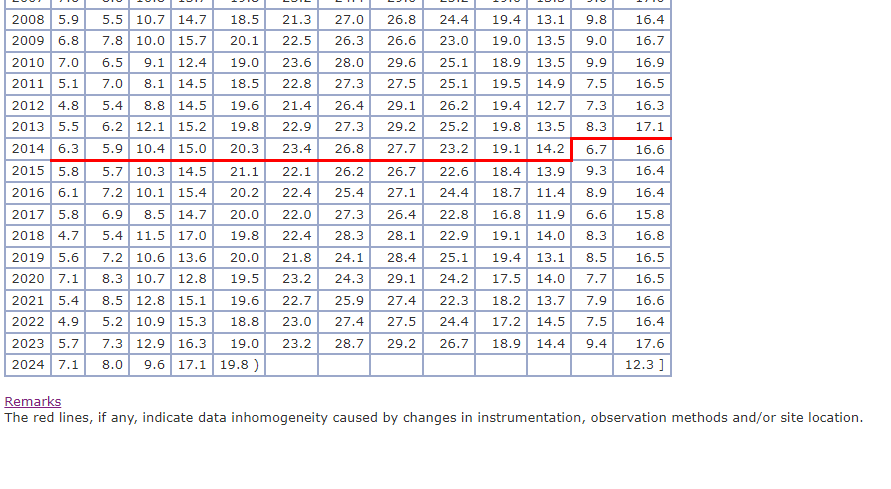
Just for the record, this is the actual raw, unadjusted data. Nice of Tony to stop his analysis in 2021, but 2023 was warmest of record even with no adjustment for the recent site change. 2024 is shaping up to be the same. The reality is the adjustment looks substantial with two cherrypicked dates over a short timeframe but would almost certainly be negligible over the whole period of record. That's why he doesn't show the whole period of record.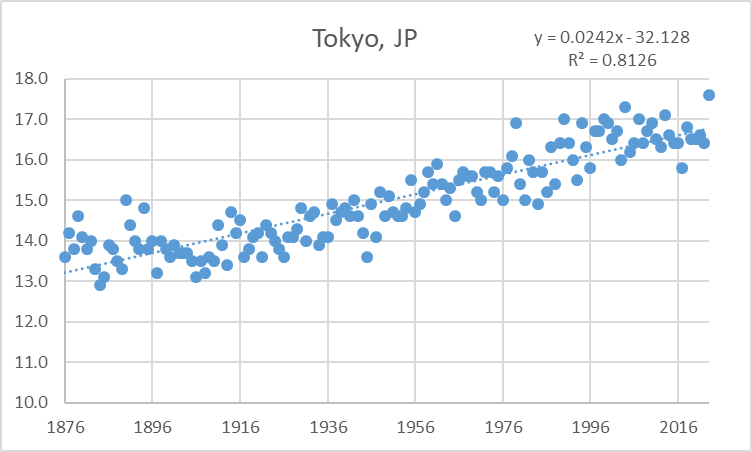
-
Occasional Thoughts on Climate Change
TheClimateChanger replied to donsutherland1's topic in Climate Change
Regardless, we can make a big hullabaloo over some adjustments to the recent record due to a site change. Or we can look at the bigger picture, and see an alarming warming trend of 2.4 degrees Celsius per century dating back to the 19th century.
-
Occasional Thoughts on Climate Change
TheClimateChanger replied to donsutherland1's topic in Climate Change
Just what I suspected! There was a change in site location in 2015, where the inflection point occurs.