

TheClimateChanger
-
Posts
4,574 -
Joined
-
Last visited
Content Type
Profiles
Blogs
Forums
American Weather
Media Demo
Store
Gallery
Everything posted by TheClimateChanger
-
Pittsburgh/Western PA Spring 2024
TheClimateChanger replied to Ahoff's topic in Upstate New York/Pennsylvania
Current forecast would make the first week of May sixth warmest in the threaded record, and second only to 2012 at the airport. -
Best climate. Looking like another historically warm year across the region. Pretty much all long-term climate sites are in the top 5 for YTD through the first 1/3rd of 2024. If this outlook for May is correct, looks like some locations may climb even higher in the record books [especially in the eastern parts of the subforum]. Here is Dayton: Let's hope this continues through the summer and you get to ring up some high double-digit 90+ days!
-
April 2024 General Discussion
TheClimateChanger replied to PositiveEPOEnjoyer's topic in Lakes/Ohio Valley
Detroit finished as 5th warmest on record.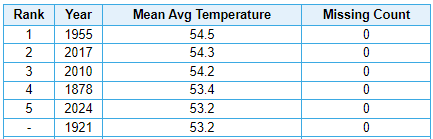
-
April 2024 General Discussion
TheClimateChanger replied to PositiveEPOEnjoyer's topic in Lakes/Ohio Valley
-
Pittsburgh/Western PA Spring 2024
TheClimateChanger replied to Ahoff's topic in Upstate New York/Pennsylvania
Looking forward to May, odds favor above normal temperatures with equal odds of above, below or near normal precipitation, per the CPC. -
Pittsburgh/Western PA Spring 2024
TheClimateChanger replied to Ahoff's topic in Upstate New York/Pennsylvania
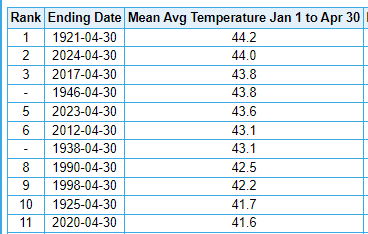
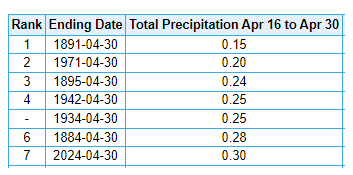
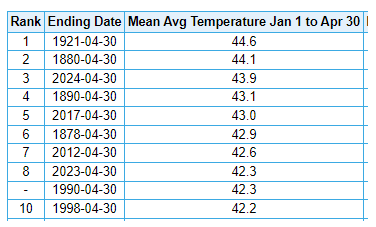
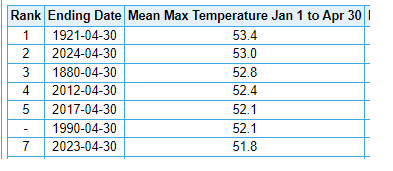
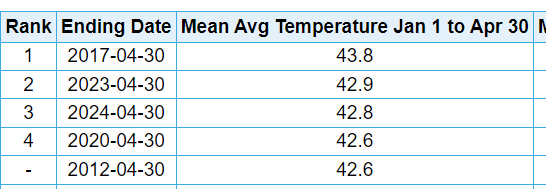
April finished off as 5th warmest and 2nd wettest on record [3rd wettest if you include the Allegheny Arsenal records back to 1836 - there was reportedly over 9 inches in 1852]. While the month finished off in a solid 5th place for temperature, it was quite close to the record high, finishing just 0.4F below 2017. Precipitation fell in an interesting pattern, with the first half of the month easily the wettest on record. The second half of the month was actually the 7th driest such period with just 0.30" of precipitation. For the first 1/3 of the year, the mean temperature is 3rd warmest in the threaded record. Easily warmest at the airport site, being nearly a full degree warmer than 2017. The average high temperature for the year to date is 2nd warmest in the threaded record.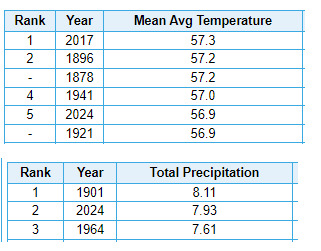
-
Central Pa. Spring 2024
TheClimateChanger replied to mahantango#1's topic in Upstate New York/Pennsylvania
Sorry, meant to post in the western Pennsylvania thread. -
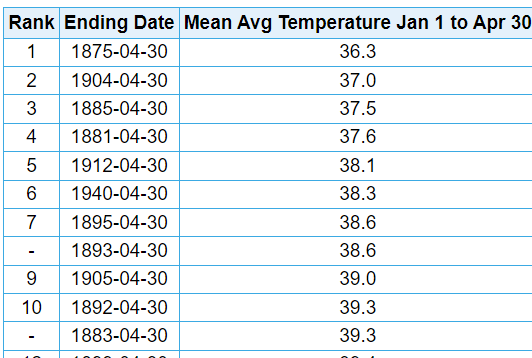
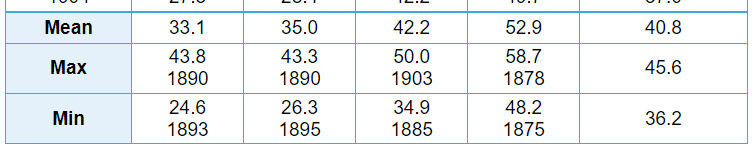
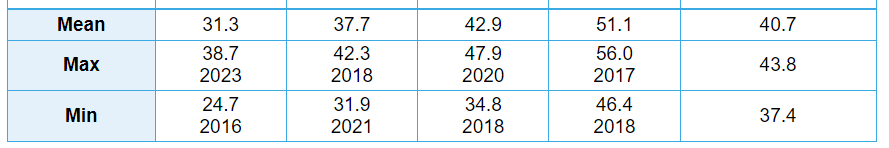
Gets even more depressing when you look at the cold years. It used to be common for the first 4 months of the year to average 36-39F in the 19th century and early 20th century. This isn't too dissimilar to recent years in Bradford, Pennsylvania. Elevation over 2000 feet on the border with New York surrounded by the Allegheny National Forest, with an average snowfall over 100 inches per year. A better comparison might be to Elkins, West Virginia, which is at a similar latitude but near 2000 feet of elevation. Many recent years have been several degrees warmer in the winter and early spring than many of these early years in Washington, DC. I don't think anyone would believe if you said the ridges are now several degrees warmer than DC used to be in the winter and early spring. But that is in fact what the actual data reveals. Obviously, a bit misleading to just look at specific years. But the most recent 9 years at Elkins - a location with an average annual snowfall of nearly 70 inches - matches the 30-year average from 1875 to 1904 in Washington, DC. DC (1875-1904) Elkins, WV (last 9 years) Obviously some of the warming at DC might be attributable to urban heat island effect. But there is no UHI in Bradford or Elkins. There were far, far more people living in DC in 1900 than there are in the entirety of Randolph County, West Virginia (pop: 27k) or McKean County, Pennsylvania (pop: 40k) in the year of our lord 2024. So really if anything the old DC numbers would be inflated relative to the readings at these locations today.
-
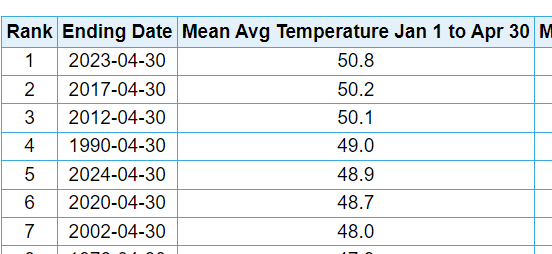
Also 4th warmest first 4 months on record. This shows 5th but doesn't include today. With today factored in, it will increase by at least the requisite 0.1F. I didn't run the numbers myself, so I don't know the exact number. But it will certainly increase to at least 49.0F. On the same token, it's only 4th warmest in the past 13 years.
-
The bad thing is like every other month, 4 warmer Aprils have occurred from 2010. So it's only the 5th warmest in the last 15 years. 2009 or earlier, this would have been 6th warmest and certainly would have got a prominent mention on the NWS website and Facebook. Now it probably won't even get noted. And recent transplants just think it's normal because 4 recent years have been even warmer.
-
Central Pa. Spring 2024
TheClimateChanger replied to mahantango#1's topic in Upstate New York/Pennsylvania
For the record, DuBois also set a record high yesterday. 000SXUS71 KPBZ 300540RERDUJRECORD EVENT REPORTNATIONAL WEATHER SERVICE PITTSBURGH PA0137 AM EDT TUE APR 30 2024...RECORD HIGH TEMPERATURE SET AT DUBOIS...A RECORD HIGH TEMPERATURE OF 82 DEGREES WAS SET AT DUBOIS YESTERDAY.THIS BREAKS THE OLD RECORD OF 80 DEGREES SET IN 1970.$$TC -
Pittsburgh/Western PA Spring 2024
TheClimateChanger replied to Ahoff's topic in Upstate New York/Pennsylvania
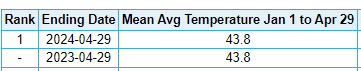
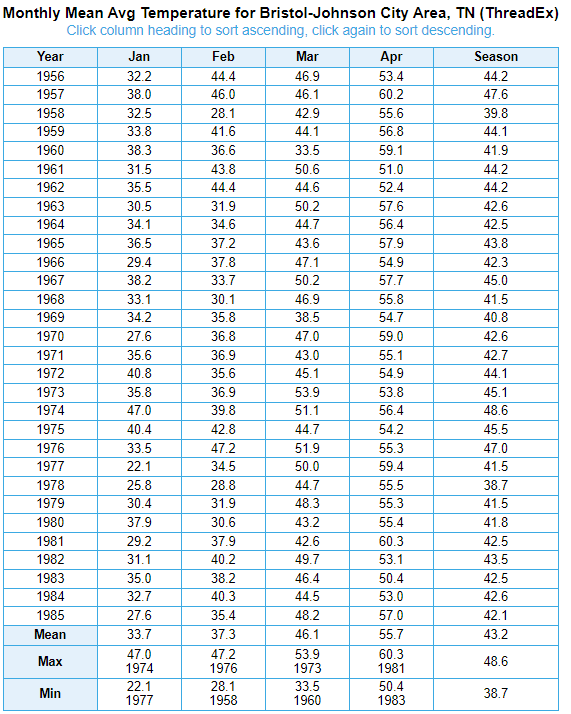
Yeah, maybe I'm misremembering, but I never recall sustained 70s and 80s like this until June growing up. I remember going up to Erie regularly on Memorial Day and it would be freezing every time. Like 55F and cold breeze off the frigid water. What I don't get is there's many - not in this thread - but elsewhere saying this is normal April weather. I don't get it. And don't get me started on the Redditors still complaining about clouds. I mean Pittsburgh basically has a 20th century northern Sun Belt climate now, except with somewhat milder summers. These are through yesterday. Will probably come up a bit when today is factored in. Can you imagine if they still took temperature records downtown? Probably on par with mid to late 20th Century Knoxville over the past two years. PIT AGC Bristol / Johnson City, Tennessee (1956-1985)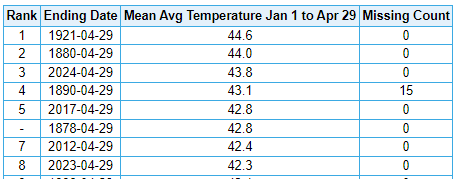
-
Occasional Thoughts on Climate Change
TheClimateChanger replied to donsutherland1's topic in Climate Change
Wait a second. Why do they artificially warm old Canadian temperatures? Is there an explanation for this? -
2024-2025 La Nina
TheClimateChanger replied to George001's topic in Weather Forecasting and Discussion
Agreed. Looks very reasonable. -
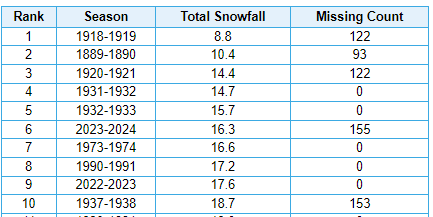
Looks like 6th least among complete seasons, officially. YMMV. 1879-1880 only includes snowfall records from January onwards. Also, the least snowiest on record at Pittsburgh International Airport, and least snowiest overall in the threaded record since the winter of 1932-1933 (when official observations were still taken downtown). That period (1931-32 & 1932-33) is also the only analog for back-to-back futility like the last two winters.
-
Surprisingly, the low on April 25, 1960 was a relatively chilly 48F. DCA was 95/58 on the same date.
-
Monthly record at IAD is 93F, set on April 6, 2010, April 17, 2002 and April 25, 1960. Will likely come up short today, but it's within reach. Even if it falls short of the monthly record, still fairly rarefied air here. Last 90F+ in the month of April occurred in 2010. IAD has done exceptionally well with monthly records over the last 16 months. The 79F on January 26, 2024 shattered the previous monthly record of 75F from 1/29/1975. The 80F reading on February 23, 2023, tied the previous monthly record set on February 21, 2018. The 100F reading on September 6, 2023 set a monthly record, with the three preceding days each tying the prior monthly record of 99F.
-
April 2024 General Discussion
TheClimateChanger replied to PositiveEPOEnjoyer's topic in Lakes/Ohio Valley
Reached 80 again at Detroit. That's the fourth 80+ reading of the month. From a historical standpoint, nothing too crazy. But it is true that there have only been 8 years with more 80+ days in April over the last 152 years of record, so it is fairly uncommon to see that many readings in the 80s in the month of April. One thing I do find interesting is the incidence of 80+ days in April has changed markedly since the turn of this century. It used to be the case that the VAST majority of Aprils failed to attain 80F or better in Detroit. Indeed, through 2000, 83 of 127 years failed to reach 80F. By contrast, in the most recent 24 years, only 5 have failed to reach 80F at least once. As a percentage, that means 65.4% of the first 127 years failed to reach 80F in the month of April. In the most recent 24 years, only 20.8% have failed to reach 80F. Not sure if this trend is significant but is a marked change. Perhaps @michsnowfreakcould weigh in with his thoughts? -
Pittsburgh/Western PA Spring 2024
TheClimateChanger replied to Ahoff's topic in Upstate New York/Pennsylvania
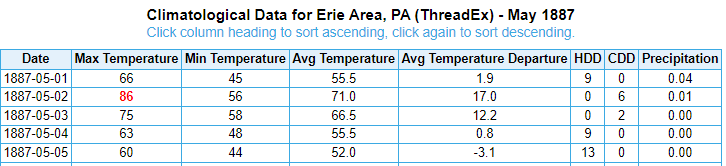
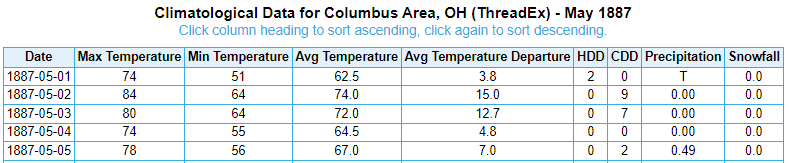
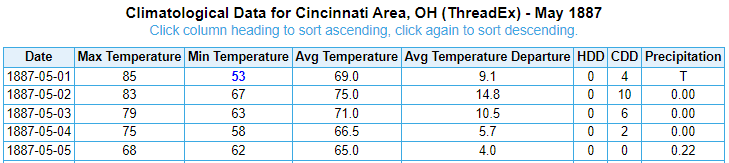
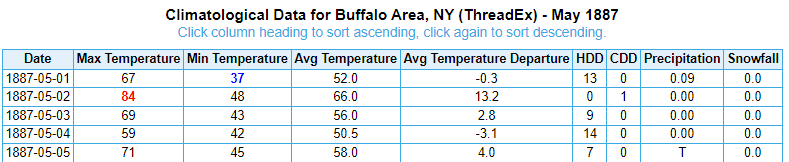
It was a warm day but the 95F readings look to be exaggerated. I just went through the Ohio weather review for May 1887, and the hottest on those dates in the entire state was 90.6F on the 2nd and 92.5F on the 3rd in Meigs County (far south). No other station was 90F or better on either date. The second hottest was also the closest to Pittsburgh, in Jefferson County at 89.0F and 88.0F. All of the other sites in eastern Ohio were mainly in the mid 80s. Given the data, a 90/91F might be believable in the urban area, but 95F seems like a warm biased reading. -
Pittsburgh/Western PA Spring 2024
TheClimateChanger replied to Ahoff's topic in Upstate New York/Pennsylvania
Yeah, those sure seem bogus. Looks like the heat wave only hit Pittsburgh. It was a warm 2-3 days for early May, but no other location in the region with records that old was anywhere near as hot on those dates.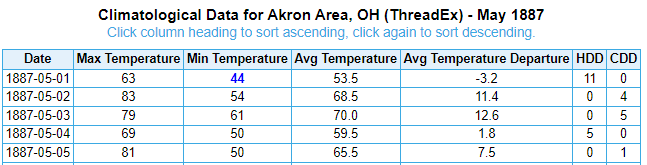
-
Occasional Thoughts on Climate Change
TheClimateChanger replied to donsutherland1's topic in Climate Change
His goal is not to produce a reliable record. His goal is to show less warming, which is why he rejects any adjustment. The adjustments are there to eliminate KNOWN biases. Why would you instead use biased data? The argument is always made - why do all of the adjustments increase warming? Most biases produce spuriously warm temperatures! Admittedly, time of observation could go either way. But, in this case, many co-operative stations reset thermometers at 5 or 6 pm prior to the 1960s. This produces warming relative to a day based on a morning or midnight observation schedule. He's previously said this doesn't impact the temperature record - patently absurd! Most days it wouldn't change things, but you wind up double counting highs whenever a cold front passes. You also miss numerous 11:59 pm lows, which are actually quite common - even in the summer. I don't know how many times, I've woke up to a ridiculously warm low in the mid/upper 70s and said "wow, that would be a daily maximum if it holds." It NEVER holds - a cool front passes, or thundershowers pop up. Imagine one day, there's a high of 97F. At 5 pm, it's still 95F. A cool front passes and the next day, the afternoon high is 84F, but goes in the record books as 95F. That alone tacks on more than 1/3 of a degree to the monthly mean high temperature. -
Pittsburgh/Western PA Spring 2024
TheClimateChanger replied to Ahoff's topic in Upstate New York/Pennsylvania
Second half of April has actually been among the driest of record thus far. -
April 2024 General Discussion
TheClimateChanger replied to PositiveEPOEnjoyer's topic in Lakes/Ohio Valley
I suppose if a typical April is record-breaking heat? -
April 2024 General Discussion
TheClimateChanger replied to PositiveEPOEnjoyer's topic in Lakes/Ohio Valley
At Detroit, I am now projecting the monthly mean temperature to clock in around 53.3F, which would be good for 5th warmest on the threaded list. It's unfortunate that City Airport (KDET) is not the official reporting station as it was in the middle of the 20th century. The mean there just through yesterday was already 53.2F. Would probably be looking at a new monthly record there. Also would have had a new record high minimum and mean today. Either way, good chance DET (with continuous records to 1934) establishes a new monthly high. Elsewhere around the lower lakes, much the same. Many areas should see a top five warmest April, with perhaps some widely scattered record-breaking readings. -
April 2024 General Discussion
TheClimateChanger replied to PositiveEPOEnjoyer's topic in Lakes/Ohio Valley
Absolute scorcher out there today. At Cleveland, the low of 68F and the mean of 74.5F both set daily record highs. The low was just two degrees shy of the monthly high minimum reading of 70F, set on April 25, 2009. At Detroit, the low of 63F was one shy of the daily record high set way back in 1899. The mean of 71.5F also fell just shy of the record of 72.0F, also set in 1899. At Mansfield, Ohio, the low of 65F was just two shy of the daily record high of 67F set in 1974, which is also the monthly record high. The mean temperature of 73F was just 0.5F below the daily record high of 73.5F, set in 1974, and just 2.5F below the all-time monthly record high of 75.5F set on April 24, 1925. At Youngstown, Ohio, the low of 66F set a new daily record high and tied the monthly record high minimum reading, set on April 17, 2002 & April 25, 2009. The mean temperature of 73.5F was just 0.5F shy of the daily record set in 1990, and just 2.5F below the all-time record high mean of 76F set on April 25, 2009. Tl;dr: About as hot as it gets in late April, and some of these locations will likely be even warmer tomorrow!

