

TheClimateChanger
-
Posts
4,598 -
Joined
-
Last visited
Content Type
Profiles
Blogs
Forums
American Weather
Media Demo
Store
Gallery
Everything posted by TheClimateChanger
-
Wow! Not the earliest 90F+ reading on record, but only 4 years (since 1871) have seen an earlier 90F+ reading at Cleveland. 1953: May 10, 90F; 1959: May 6, 92F, May 20, 91F 1962: May 14, 91F; May 18, 91F; and May 20, 91F 2017: May 17, 90F
-
Occasional Thoughts on Climate Change
TheClimateChanger replied to donsutherland1's topic in Climate Change
The mean temperature at Philadelphia would have to be like 60F already if there was a 12F UHI. That's a bunch of nonsense. -
Occasional Thoughts on Climate Change
TheClimateChanger replied to donsutherland1's topic in Climate Change
Lol. 12 degrees of urban heat island effect in Philly. Yet it's only 7 degrees warmer than the coldest spot in the entire state, at over 2,000 feet elevation near the New York border. Maybe if you are measuring the temperature of asphalt and rooftop, but I'm still having trouble verifying this from actual data. I can believe your article or I can look at actual data that shows it is BS. Bradford Philadelphia

-
Occasional Thoughts on Climate Change
TheClimateChanger replied to donsutherland1's topic in Climate Change
I'm just not seeing it. Here is some data for the year to date from the Mid Atlantic. It's almost like temperatures vary pretty consistently with latitude and elevation, and any impact from population is pretty small (maybe a degree or so). Population figures given are for the county or district in which the airport is located [I used Loudon County for IAD, which spans two counties]. Where is this 3 to 12C figure coming from?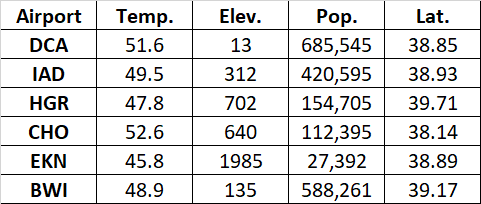
-
Occasional Thoughts on Climate Change
TheClimateChanger replied to donsutherland1's topic in Climate Change
Can somebody help me find the 3-12C urban heat island effect? I'm having a lot of trouble finding it in the actual data. -
Occasional Thoughts on Climate Change
TheClimateChanger replied to donsutherland1's topic in Climate Change
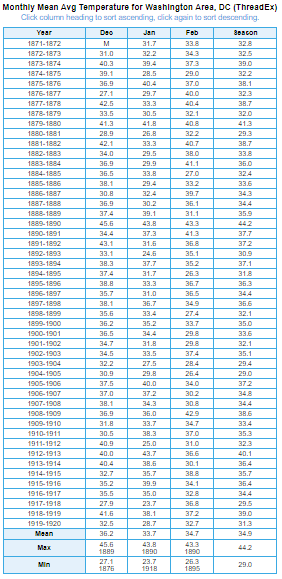
We really need to cut all the urban heat island nonsense out. When Elkins, West Virginia, a remote, very rural town at 2,000 feet elevation and a location that historically averages 80" of snow each year, has average winter temperatures that easily exceed those of 19th Century and early 20th century Washington, D.C. [basically sea level], urban heat island effect is not a significant factor.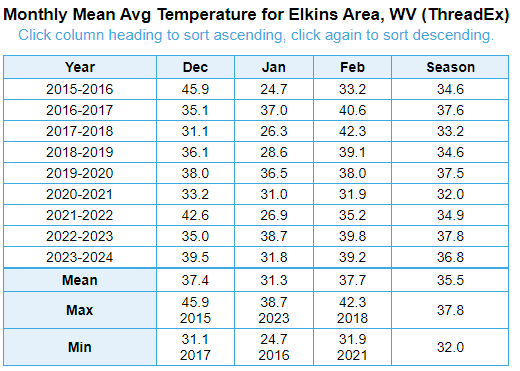
-
Spring 2024 Medium/Long Range Discussion
TheClimateChanger replied to IWXwx's topic in Lakes/Ohio Valley
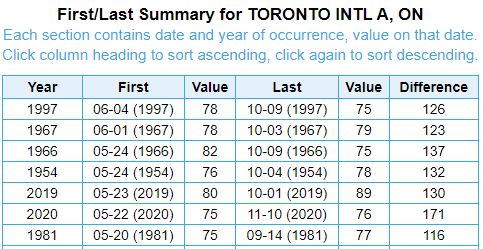
At Pearson International Airport in more recent years. The first 75F in 2019 occurred on May 23, and in 2020 on May 22. Latest is June 4, 1997.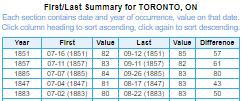
-
Spring 2024 Medium/Long Range Discussion
TheClimateChanger replied to IWXwx's topic in Lakes/Ohio Valley
Interestingly, there were 5 years in the first 48 years of record in which the first 80F did not occur until July. This implies a historical odds of such an event being a bit more common than 1 in every 10 years. The latest first 80F reading at Toronto is July 16, 1851, when the mercury climbed to 82F.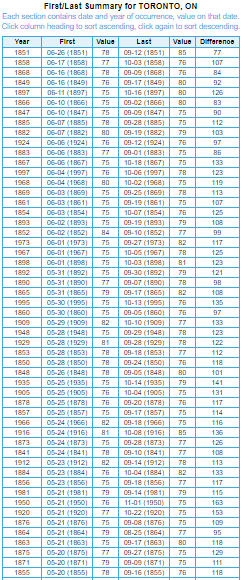
-
Spring 2024 Medium/Long Range Discussion
TheClimateChanger replied to IWXwx's topic in Lakes/Ohio Valley
Not too uncommon. These are all the years at downtown Toronto in which the first reading of 75F occurred on or after today's date (May 20). The temperature shown is the temperature on the date of the first 75F+ reading. Particularly in the 19th century, it was fairly common for the first 75F reading to hold off until June. The latest first 75F+ reading occurred on June 26, 1851, when the mercury climbed to 78F.
-
Pittsburgh/Western PA Spring 2024
TheClimateChanger replied to Ahoff's topic in Upstate New York/Pennsylvania
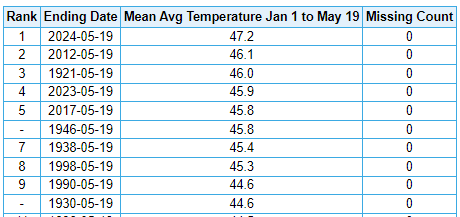
If you look at a place like Oklahoma City, the comparison is even starker. Fully 32 years, almost all from prior to the 21st century, were as cool or cooler than Morgantown in 2024 for the period from January 1 through May 19. And 45 years, no more than 0.5F warmer. So at those levels, 2024 in Morgantown has seen temperatures that would have been expected about once every three years historically in OKC, and nearly every other year if you include years within 1/2 degree Fahrenheit.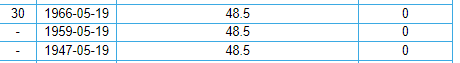

-
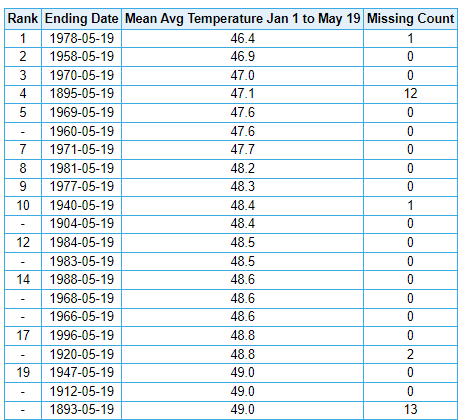
Pittsburgh/Western PA Spring 2024
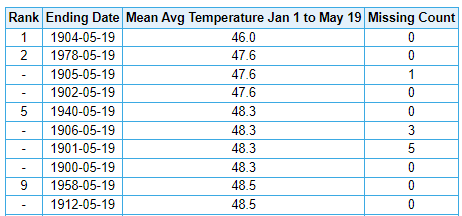
TheClimateChanger replied to Ahoff's topic in Upstate New York/Pennsylvania
It will be interesting to see if we can sustain this. At Morgantown, the mean temperature so far this year has been 48.5F. If you look at a place like Raleigh-Durham, NC, you can see 13 years were as cool or cooler, and 21 years within 0.5F of that figure, clustered generally within a 100-year period. Temperatures that low no longer occur in Raleigh-Durham, so including the full nearly 140 years of data would produce a incidence far below what the historical incidence. You can see that when the airport opened in that time frame from the late 1950s through 1980s, temperatures as low or lower than 2024 in Morgantown would have occurred about 1 in 4 years. Even Greenville-Spartanburg, South Carolina has had 10 years as cool or cooler. While there's nearly 130 years of record, they were all clustered in the first 80 or so years of the POR, implying a historical incidence of about 1 in 8 years. While still below the median, you can see temperatures like those at Morgantown so far this year were still fairly common in the 20th century in the Carolinas. Definitely within the envelope of a normal 20th century climate of the Carolinas, and about normal for 20th century Oklahoma City [albeit with cooler highs & warmer lows - less continentality].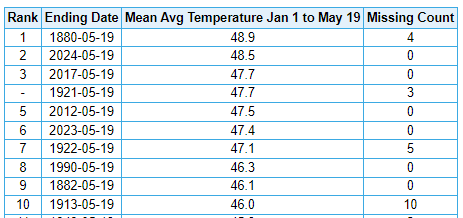
-
Pittsburgh/Western PA Spring 2024
TheClimateChanger replied to Ahoff's topic in Upstate New York/Pennsylvania
I think all the Canadian wildfire smoke screwed us in May and June last year. Even when it wasn't noticeable on the surface, there was almost always some concentration in the atmosphere. The next strong El Nino should be interesting. -
Spring 2024 Medium/Long Range Discussion
TheClimateChanger replied to IWXwx's topic in Lakes/Ohio Valley
7th warmest May on record to date at Dayton, with very warm weather forecast over the next week or so. Plenty of room to climb on this list. Still solidly in first place on the year to date, more than a degree warmer than 2012.
-
Central Pa. Spring 2024
TheClimateChanger replied to mahantango#1's topic in Upstate New York/Pennsylvania
Weird. We paid just under 400k in 2018, and ours is $10k a year between city, county and school. -
Central Pa. Spring 2024
TheClimateChanger replied to mahantango#1's topic in Upstate New York/Pennsylvania
Wow, more affordable than I would have thought. Our property taxes alone dwarf that. -
Pittsburgh/Western PA Spring 2024
TheClimateChanger replied to Ahoff's topic in Upstate New York/Pennsylvania
Well we managed three below normal days (officially). I don’t really see many opportunities for below normal temps over the next 7-10 days. Looks well above normal through Wednesday, and then cooler but likely still above normal late next week into the start of the holiday weekend. -
Pittsburgh/Western PA Spring 2024
TheClimateChanger replied to Ahoff's topic in Upstate New York/Pennsylvania
https://twitter.com/nwspittsburgh/status/1791577628924912053?s=46 -
Pittsburgh/Western PA Spring 2024
TheClimateChanger replied to Ahoff's topic in Upstate New York/Pennsylvania
Interesting. NOAA says heightened odds of warmer than normal temperatures this summer, but the Almanac says cool and dry. Kinda weird how Erie is hot and wet, but SW PA is cool and dry. -
Pittsburgh/Western PA Spring 2024
TheClimateChanger replied to Ahoff's topic in Upstate New York/Pennsylvania
-
Central Pa. Spring 2024
TheClimateChanger replied to mahantango#1's topic in Upstate New York/Pennsylvania
Wrong. CXY had a mean of 58.1F last year.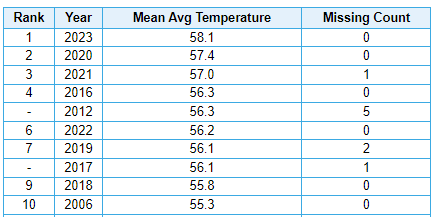
-
Central Pa. Spring 2024
TheClimateChanger replied to mahantango#1's topic in Upstate New York/Pennsylvania
Looks like relative to CXY, those values are warmer through 2016 and then recent years are the same or slightly less, which would have the effect of decreasing the trend over that period. Either way, the bigger concern is NOAA indicates Harrisburg saw a 58.1F annual mean temperature last year. That's warmer than the historical annual mean temperature of Richmond, Virginia, and within a couple of degrees of places like Charlotte and Raleigh in North Carolina. -
Central Pa. Spring 2024
TheClimateChanger replied to mahantango#1's topic in Upstate New York/Pennsylvania
How does moving the station around to a cooler location and "threading" them together amplify warming? -
Central Pa. Spring 2024
TheClimateChanger replied to mahantango#1's topic in Upstate New York/Pennsylvania
Looks like those are based primarily off CXY, which makes sense since it used to be the official station in Harrisburg. MDT is about a degree or so cooler. It's a trick NOAA does to hide the warming. Repeatedly switch the "official" station to ever cooler locations to mask some of the warming trend. From a downtown windowsill to a downtown rooftop to an urban airport on the outskirts of town and then to a much larger airport in a rural-suburban area either surrounded by water or at a higher elevation, and then thread them all together! Also to hide even more warming switch the data source from a warmer LiG thermometer housed in CRS to an automated weather station (MMTS/ASOS). And then have trolls complain about any adjustments that are made. -
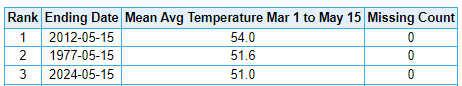
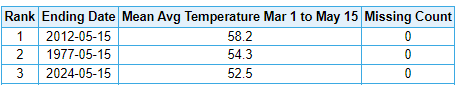
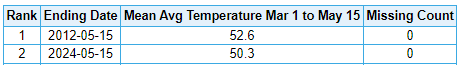
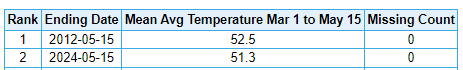
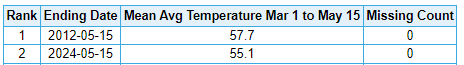
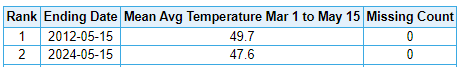
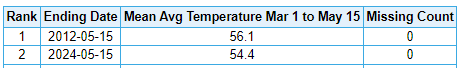
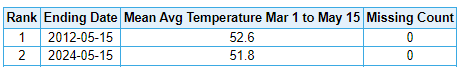
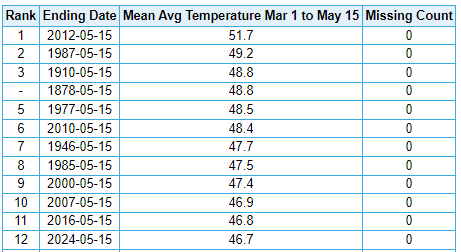
Not bad, but 2012 saw a much warmer spring in most locations. Data below are for the period 3/1 to 5/15. Second warmest in most places in the southern parts of the subforum [1977 was warmer at ORD & DSM], but not as warm in the north. Only 12th mildest at MSP. MKE ORD DSM DTW TOL IND CMH CLE MSP
-
It sounds like Dr. Hansen believes this is the peak of this El Niño cycle. Although it’s not all good news, as he also thinks we have surpassed 1.5C for all practical purposes.

