

TheClimateChanger
-
Posts
4,598 -
Joined
-
Last visited
Content Type
Profiles
Blogs
Forums
American Weather
Media Demo
Store
Gallery
Everything posted by TheClimateChanger
-
Pittsburgh, Pa Summer 2024 Thread.
TheClimateChanger replied to meatwad's topic in Upstate New York/Pennsylvania
Those HRRR temperatures though... -
Pittsburgh, Pa Summer 2024 Thread.
TheClimateChanger replied to meatwad's topic in Upstate New York/Pennsylvania
Very comfortable dewpoints tomorrow. Most guidance in mid to upper 50s, but HRRR brings it down to upper 40s to around 50 area wide. -
Central Pa. Summer 2024
TheClimateChanger replied to mahantango#1's topic in Upstate New York/Pennsylvania
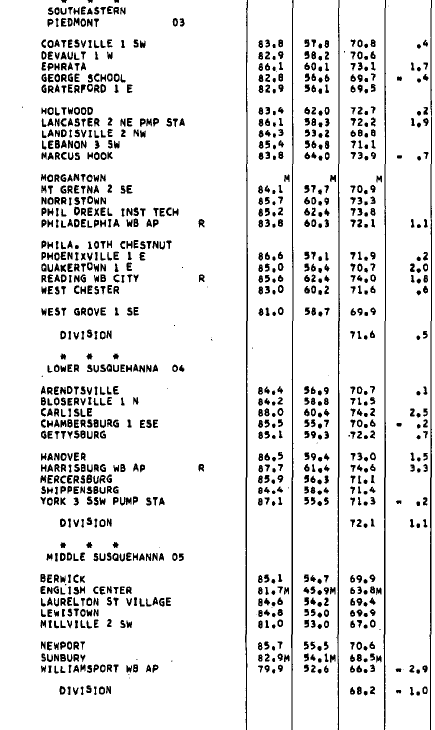
Well, for one, it was at CXY, which is usually warmer for maximum temperatures than MDT. We can see 2024 is a lot closer if we compare CXY records. And two, it was way out of line compared to surrounding observations that summer. June 1966 was fairly close to normal in most of the region, but +3.3F at Harrisburg?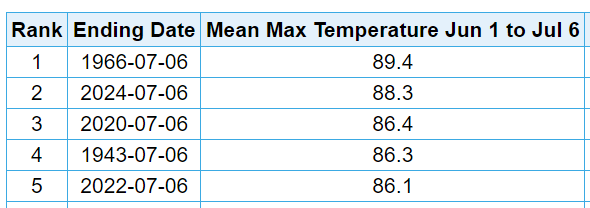
-
I'll admit though, these numbers feel off since it's really not that much warmer than many recent summers. So I propose a better way is to compare current summers in Newark to historical summers in Raleigh-Durham. And recent summers at the park in New York City to historical summers in Richmond, Virginia. But in each case, we should limit the comparisons to years before 2001, since those locations have been putting up video game numbers in recent years. When we do that, we see New York City is currently in 36th place [out of 105 years]. And Newark is currently in 14th place [out of 115 years]. Alternatively, we can use a computer model to simulate future years between 2050 and 2100, and limit our comparison to the simulated data, and this very well might be the coldest summer of record.
-
Through yesterday, third warmest start to the summer at NYC and warmest on record for EWR. NYC EWR 1993 & 1994 deserves an asterisk, due to defective HO-83 hygrothermometer.
-
Central Pa. Summer 2024
TheClimateChanger replied to mahantango#1's topic in Upstate New York/Pennsylvania
120 in Vegas today, shattered all-time record by 3F. -
Phoenix Experiences its Hottest June on Record
TheClimateChanger replied to donsutherland1's topic in Climate Change
-
Pittsburgh, Pa Summer 2024 Thread.
TheClimateChanger replied to meatwad's topic in Upstate New York/Pennsylvania
Today is a good example of how difficult it is to have a month warmer than 77F. Warm day - 89/65, but that’s only a mean of 77F. Much easier to do when the low is 70+. Also considering it hit 89 today, the next two days look like sure 90+. -
Occasional Thoughts on Climate Change
TheClimateChanger replied to donsutherland1's topic in Climate Change
How about a hot multi-millennial scale tsunami? I think that might be the better analogy. -
Central Pa. Summer 2024
TheClimateChanger replied to mahantango#1's topic in Upstate New York/Pennsylvania
After further thought, I think with these Madden numbers, we should compare recent summers to historical summers in Richmond, Virginia, instead of historical summers in Harrisburg. If we do that, we see it's only tied for 24th warmest [of 128 years]. But because Richmond has also been throwing up Madden numbers in recent decades, we should limit the rankings to 2001. If we do that, we see it's been warmer than all but 12 summers [out of 105 years] in Richmond that occurred between 1897 & 2001. -
Central Pa. Summer 2024
TheClimateChanger replied to mahantango#1's topic in Upstate New York/Pennsylvania
Wow, almost hit the big 90 in East Nantmeal. What did the non-shaded sensor on the roof read? I think we need asterisks by the partially shaded readings. They are not compliant with siting standards, which are supposed to be taken in full sun free of obstructions. -
Pittsburgh, Pa Summer 2024 Thread.
TheClimateChanger replied to meatwad's topic in Upstate New York/Pennsylvania
Actually after further analysis, I think a record hot summer in the entire threaded record is still possible - albeit remote. But in 2024, I wouldn't toss it out as a possibility. I feel like, despite the warm start, this is probably the cool period of July and the rest of the month might be even hotter. We are currently 1.5F above 1995 to date, which ended up 0.7F cooler than the mythical summer of 1900. Obviously, expecting another August 1995 is a longshot. But I do think July this year is looking like it could put up a number like August 1995 or July 2020, when all is said and done. -
Central Pa. Summer 2024
TheClimateChanger replied to mahantango#1's topic in Upstate New York/Pennsylvania
I mean summer of 1982 had a mean temperature below the average low temperature of 2024 so far at Harrisburg, and a bunch of other years saw mean temperatures within 2-4 degrees of the average low temperature of 2024. So when we include low temperatures in the year 2024, it's like playing Madden on easy mode. And we can't do that. -
Central Pa. Summer 2024
TheClimateChanger replied to mahantango#1's topic in Upstate New York/Pennsylvania
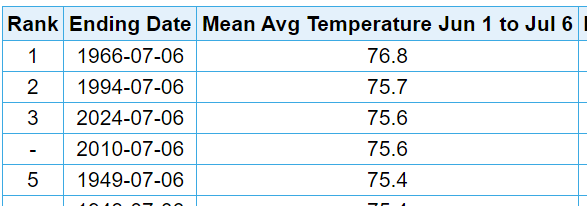
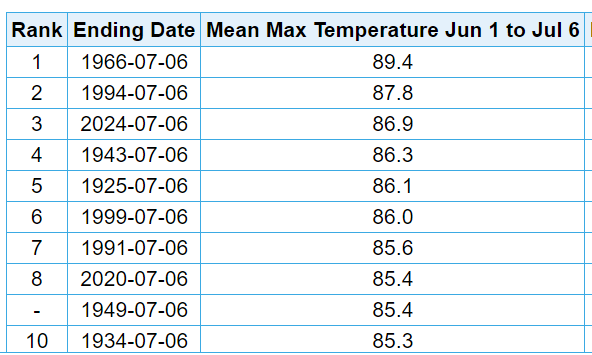
I have been told lows and humidity don't count. People judge summer warmth by max temperature. So it might feel like this summer is in the running for one of the hottest summers of record, but it's just your imagination playing tricks on you. At Harrisburg, we can see meteorological summer is in second place by mean temperature to date, just a fraction of a degree below 1994. But we can see, when we consider only max temperatures, we can see it drops to a CHILLY third place behind 1994 & inflated 1966 records from Capital City Airport when it was throwing up 107s like it was nothing.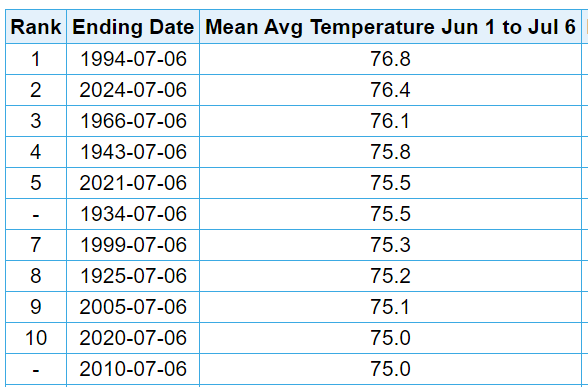
-
Pittsburgh, Pa Summer 2024 Thread.
TheClimateChanger replied to meatwad's topic in Upstate New York/Pennsylvania
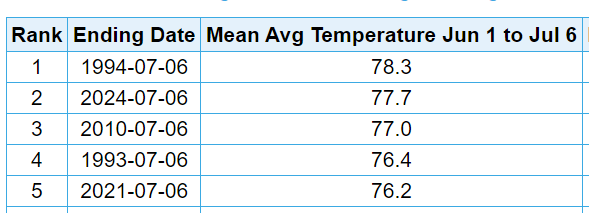
With the warm start to July, met summer to date is up to 73.2F, which is 11th warmest in the threaded record, tied with 1994, 1991 and a couple of earlier years. Tied for warmest at Pittsburgh International Airport with 1994 & 1991, and warmest overall since 1943. Looking at the forecast for the next couple weeks, I think we have a shot at the hottest summer on record at the airport. Not going to be able to unseat any of those old city office records most likely. Lots of heat out west and east. Raleigh / Durham reached an all-time record of 106F yesterday. -
Pittsburgh, Pa Summer 2024 Thread.
TheClimateChanger replied to meatwad's topic in Upstate New York/Pennsylvania
6th day of 90+. Most through July 3 since 2012 (10). Only seven years have had more at Pittsburgh International Airport: 1966, 14 2012, 10 1994, 9 1991, 8 1988, 8 1967, 8 1962, 8 -
July 2024 General Discussion
TheClimateChanger replied to Chicago Storm's topic in Lakes/Ohio Valley
URGENT - WEATHER MESSAGE National Weather Service Wilmington OH 257 AM EDT Wed Jul 3 2024 INZ050-058-059-066-073>075-080-KYZ089>100-OHZ053>056-060>065-070>074- 077>082-088-031500- /O.NEW.KILN.HT.Y.0002.240703T1600Z-240704T0000Z/ Wayne-Fayette-Union-Franklin-Ripley-Dearborn-Ohio-Switzerland- Carroll-Gallatin-Boone-Kenton-Campbell-Owen-Grant-Pendleton- Bracken-Robertson-Mason-Lewis-Clark-Madison-Franklin-Licking- Preble-Montgomery-Greene-Fayette-Pickaway-Fairfield-Butler-Warren- Clinton-Ross-Hocking-Hamilton-Clermont-Brown-Highland-Adams-Pike- Scioto- Including the cities of Brooksville, Manchester, London, Springboro, Washington Court House, Carrollton, Camden, Summerside, Withamsville, Eaton, Crittenden, Milford, Newport, Blanchester, Burlington, Downtown Columbus, Rising Sun, Mount Repose, Georgetown, Hamilton, Fort Thomas, Falmouth, Lebanon, Chillicothe, Dayton, Warsaw, Piketon, Versailles, Florence, Bright, Dry Ridge, Wheelersburg, Vevay, Circleville, Seaman, Plain City, Butler, Richmond, Peebles, Bellevue, Liberty, Williamstown, Fairborn, Connersville, Logan, Batesville, Mount Orab, Maysville, Downtown Dayton, Mount Carmel, Camp Dix, Osgood, West Union, Dillsboro, Head Of Grassy, Waverly, West College Corner, Springfield, Pike Lake, Tollesboro, Aberdeen, Kettering, Erlanger, Brookville, Milan, Xenia, Alexandria, Greendale, Augusta, Franklin, Portsmouth, Fairfield, Owenton, Oxford, Lawrenceburg, Beavercreek, Aurora, Greenfield, Covington, Mulberry, Independence, Oakbrook, Winchester, Lancaster, Landen, Mason, Hidden Valley, Highland Heights, Downtown Cincinnati, Vanceburg, Pickerington, West Jefferson, Day Heights, Hillsboro, Wilmington, Middletown, Mount Olivet, Ripley, and Newark 257 AM EDT Wed Jul 3 2024 ...HEAT ADVISORY IN EFFECT FROM NOON TODAY TO 8 PM EDT THIS EVENING... * WHAT...Heat index values between 100 and 104. * WHERE...Portions of east central and southeast Indiana, northeast and northern Kentucky, and central, south central, southwest, and west central Ohio. * WHEN...From noon today to 8 PM EDT this evening. * IMPACTS...Hot temperatures and high humidity may cause heat illnesses. PRECAUTIONARY/PREPAREDNESS ACTIONS... Drink plenty of fluids, stay in air-conditioned rooms, stay out of the sun, and check up on relatives and neighbors. Take extra precautions when outside. Wear lightweight and loose fitting clothing. Try to limit strenuous activities to early morning or evening. Take action when you see symptoms of heat exhaustion and heat stroke. && $$ Hickman -
UAH in at +0.80C, which might not sound too bad but you’ve got to love that choice of base period. Those of us who were alive in the 1990s know it was considered to be unusually hot, with all the deniers saying it’s only a cyclical warm period. That so-called cyclical warm period now looks like an unusually cold period on UAH, outside of the super El Niño. I guess it doesn’t look so bad when you turn one of the hottest decades on record into a cold period. You can’t make this stuff up.
-
-
Occasional Thoughts on Climate Change
TheClimateChanger replied to donsutherland1's topic in Climate Change
I think it might work on Mobile - not sure if it’s still messed up on the PC. Anyways, those are a bunch of straw men questions. I have never said the climate of 1850 is superior or preferable. And rarely if ever address those political questions about addressing the issue. I usually just post statistics to track and compare changes in the climate over time. It seems simply stating or discussing data about climate change makes one an “alarmist” or “doomer” in your opinion. But to answer your questions… in some ways, climate change has probably been beneficial to an extent. But it does seem like with the recent increases in wildfires, floods, and other extreme weather events, we may be pushing that boundary. Of far greater concern is future warming which, if nothing is done to address the causes, could be of a magnitude far greater than the warming experienced to date. -
Phoenix Experiences its Hottest June on Record
TheClimateChanger replied to donsutherland1's topic in Climate Change
Is it just me or did @ChescoWx's last post accidentally glitch out the "Occasional Thoughts on Climate Change" thread? The "submit reply" button will not work for me in that thread, and there's like a strange black box with part of his signature in it at the bottom of the thread. No idea what happened. -
Occasional Thoughts on Climate Change
TheClimateChanger replied to donsutherland1's topic in Climate Change
The overall impact can be proven. Even Judith Curry addressed it in a guest post by Zeke Hausfather, who analyzed all USCRN [climate reference network, i.e. the top tier sites] between 2004 & 2014 to determine the impact by starting the "climate day" at different hours relative to midnight to midnight. It's not like they just pulled it out of a hat. Understanding Time of Observation Bias | Climate Etc. (judithcurry.com)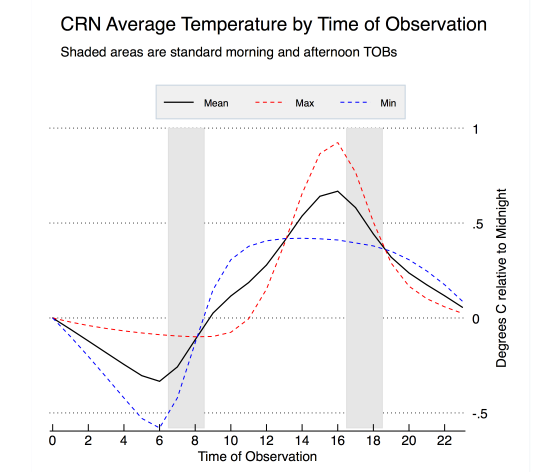
-
Occasional Thoughts on Climate Change
TheClimateChanger replied to donsutherland1's topic in Climate Change
-
Occasional Thoughts on Climate Change
TheClimateChanger replied to donsutherland1's topic in Climate Change
I always cringe when they trot out these old state records that make no climatological sense. Today, we have to analyze every record with a fine tooth comb, but take everything in the past as absolute fact - even when it's completely out of line with all other stations. I always find it funny how these EXTREME temperatures always avoided the WBAN sites [weather bureau, army, navy] that would have been especially well maintained, despite the fact that many of the WBAN sites were in center cities and on biased rooftops. 111F on July 9 and 10th, 1936 at Phoenixville, but 103F on both dates at Harrisburg [WBAN] and 103F and 104F at Philadelphia [WBAN]. 103F & 105F at West Chester. Someone might object and say "oh, well it was 110F at Corry on July 14, 1936." That temperature is so ridiculous and off, I bet the observer [a local fire hall] just made it up for clout and to try to get a mention in the local media. Corry should be one of the coldest locations in the state... the town is situated at about 1400 feet, with 1700 feet plus hills just off to the east, in the far northwest corner just downwind of Lake Erie. The nearest stations had highs that day of: 92, Erie WB; 98, Titusville; 98, Warren; 95, at Jamestown, NY. The "112F" state record at Martinsburg on July 11, 1936. It was 98F at Hagerstown, Maryland, no more than 20 miles away, on the same date. Nonetheless, always trotted out to minimize climate change and fool the people. Don't get me wrong, the 1936 heat wave was insanely hot with widespread temperatures in the upper 90s and low to mid 100s. But a lot of these crazy high records from that era are certainly questionable. -
Occasional Thoughts on Climate Change
TheClimateChanger replied to donsutherland1's topic in Climate Change
The temperature can rise after 4 pm, you know? The high on both of those days was 1F higher than the reset, whereas the 4 pm observation the day of the reading was several degrees lower without any rain. 4 pm is near peak heating. It is not uncommon at all for the temperature to rise at some point after 4 pm particularly if there is varying cloud cover. Moreover, at 1F, it could have been the same reading just rounded in different directions. If it was in between 92 and 93, he may have called it 92 and then looked at it the next day and called it 93. These were being read off a mercury thermometer. Or it could have been just slightly higher than 92, warmed even a couple of tenths, exceeding 92.5F and then called 93 when read the following day. Either way, it is not at all uncommon for temperatures to vary by a few tenths or even a degree or so after 4 pm. Including only days when the temperature was exactly the same as the reported reset temperature is not a reasonable assumption in this case.

