TheClimateChanger
-
Posts
4,593 -
Joined
-
Last visited
Content Type
Profiles
Blogs
Forums
American Weather
Media Demo
Store
Gallery
Everything posted by TheClimateChanger
-
Central Pa. Summer 2024
TheClimateChanger replied to mahantango#1's topic in Upstate New York/Pennsylvania
2011-2024 is only 14 years, so that means nearly half of them were among the top 14 warmest of 130 years. Widening out ever so slightly, and 8 of the top 20 have occurred in the past 15 years.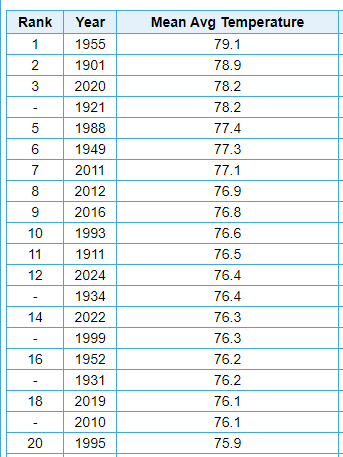
-
Phoenix Experiences its Hottest June on Record
TheClimateChanger replied to donsutherland1's topic in Climate Change
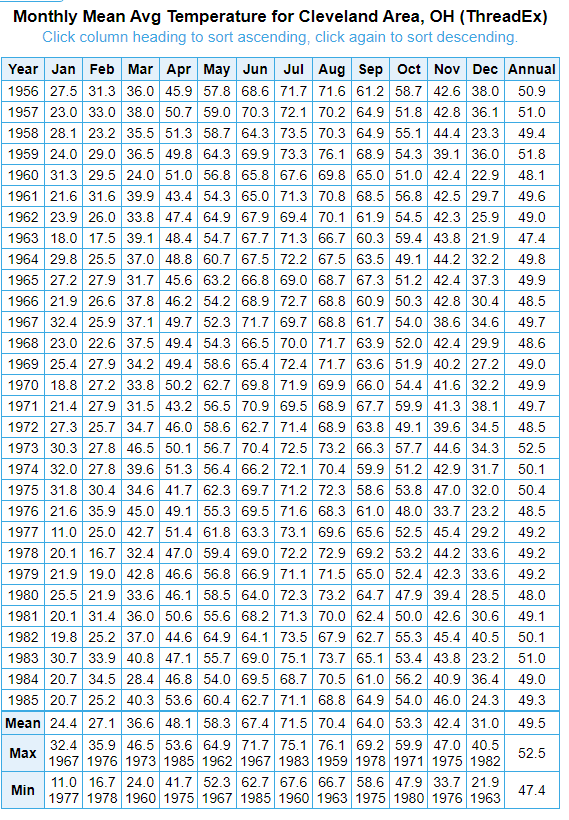
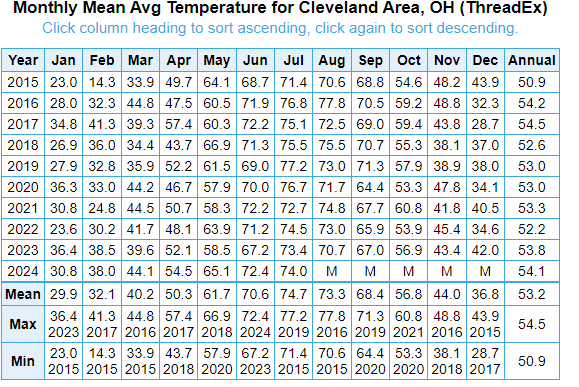
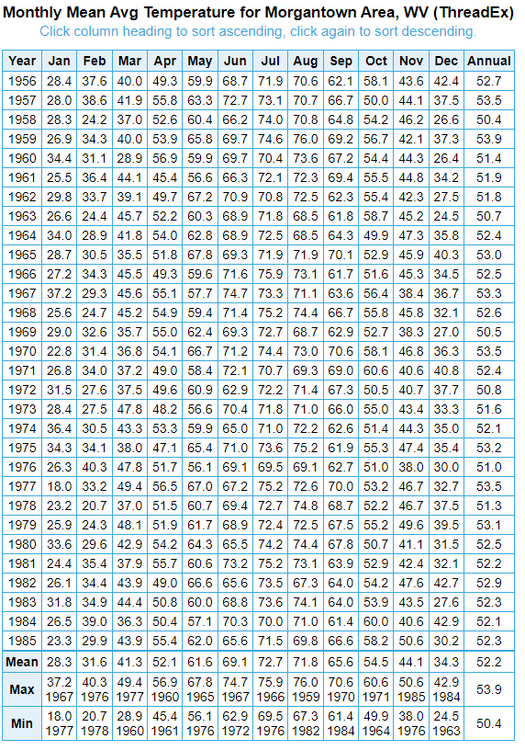
It's always surprising to me how much colder Chicago is than Cleveland in the wintertime. Being upwind versus downwind of the Great Lakes makes a huge difference. 1956-1985 at CLE (Dfb, bordering on Dfa): Last 10 years below. Very solidly Dfa. The mean of the coldest month is 1.6F warmer than the mean of the coldest month at Morgantown, West Virginia, from 1956-1985. Looks to be on the same path as PIT. Likely Cfa by mid-century using 0C definition.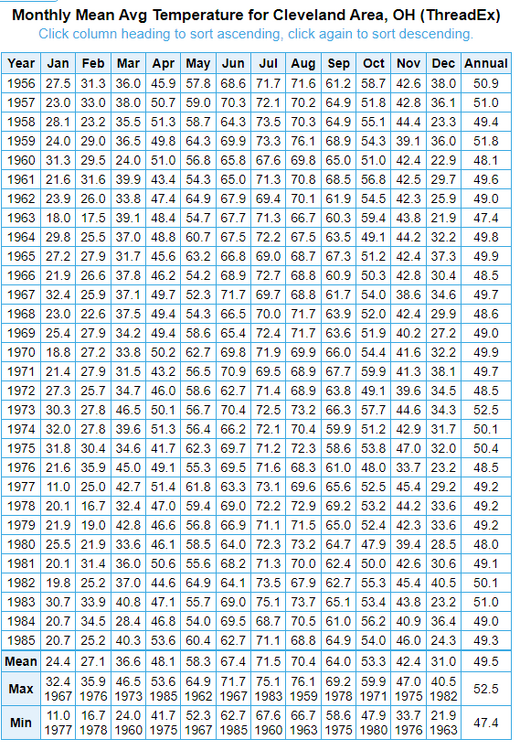
-
Phoenix Experiences its Hottest June on Record
TheClimateChanger replied to donsutherland1's topic in Climate Change
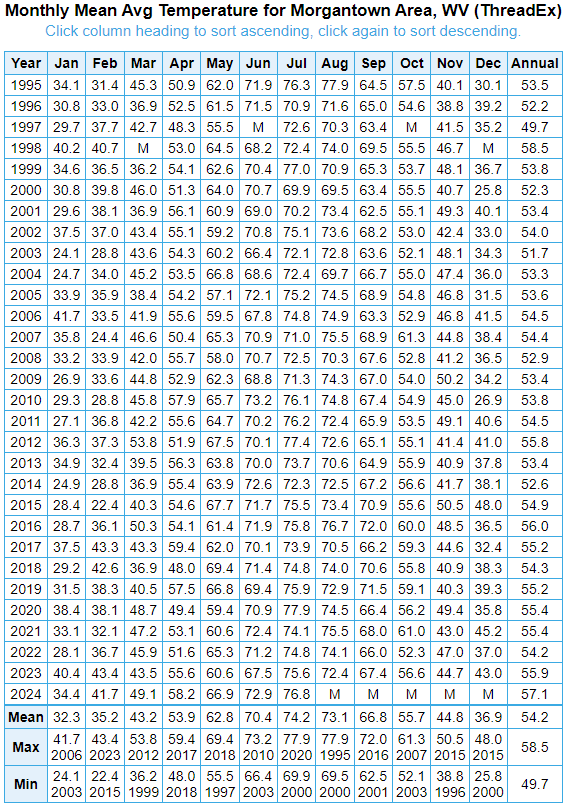
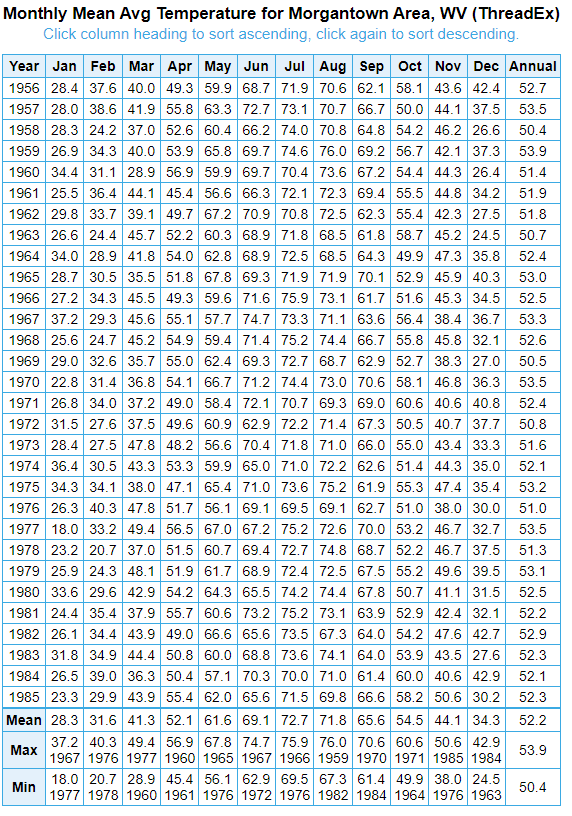
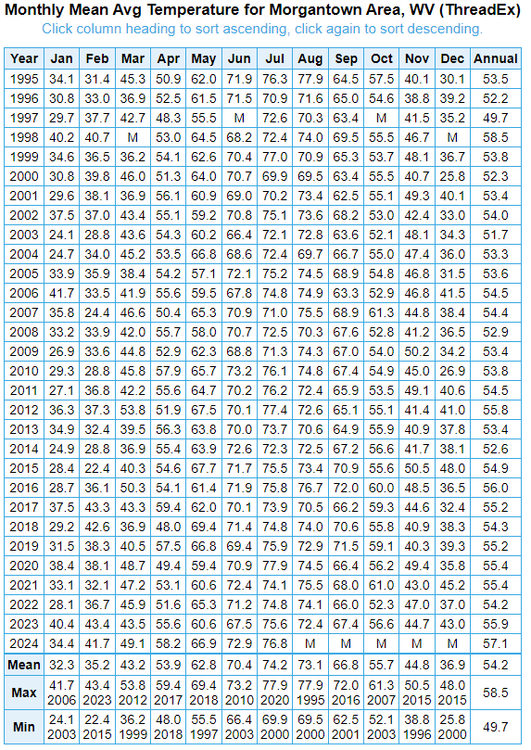
Looks like the border between warm summer and hot summer subtypes is actually 22C, which is 71.6F. Looking at historical data, the "normal" July mean at PIT (Pittsburgh International) was 71.9F in the 1960s and in the 1980s climatology. The 1960s climatology was based, in part, on a smaller POR and comparative data to infill since records didn't begin until 1952. I believe the 1970s climatology had the mean at 72.3F. Technically hot summer continental (Dfa), albeit bordering on warm summer continental (Dfb). Today is solidly hot summer continental (Dfb). The more significant change coming soon - at least as far as the Koppen classification is concerned - will be the transition to humid subtropical climate (Cfa). Based on the data presented below, I would surmise that this transition will occur within the next 20-25 years (extrapolating from trends over recent decades). Looking at data for the last 10 years, we can see the mean of the coldest month is 29.9F over that period. Above the traditional -3C criteria, but still below the 0C criteria typically used for North American climates. 60 miles to the south, we can see Morgantown, WV has averaged 32.3F in its coldest month over the past 30 years, making it fully Cfa by all metrics. By contrast, the 30-year mean from 1956 to 1985 was 28.3F, so that's a 4F rise in just 40 years. Heck, even February was colder than recent Januarys back then. Interestingly, it that period, even Morgantown was only about 0.5C above the border for warm summer continental (Dfb).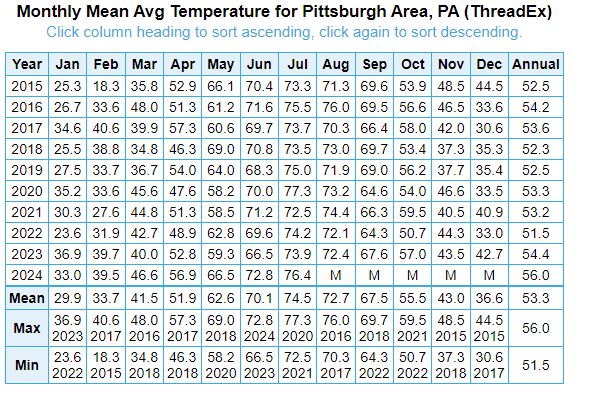
-
Central Pa. Summer 2024
TheClimateChanger replied to mahantango#1's topic in Upstate New York/Pennsylvania
I think this is something lost on a lot of people. Some like to point to a few scattered years in the historical records and say "look, it's been hotter." But they ignore the fact, that also scattered in the mix were many summers that were far colder than any recent summer. Like 2003 & 2004 at KPIT, the highest temperature was 88F in that 2-year stretch. What are the odds of that recurring any time soon? -
Central Pa. Summer 2024
TheClimateChanger replied to mahantango#1's topic in Upstate New York/Pennsylvania
Good luck on that one. I suspect 2003 & 2004 were the last mild summers on record. By mild, I mean in a historical sense. Obviously, there will always be cooler than normal summers [like last year], but due to the rising means, those wind up nowhere near historically cold summers.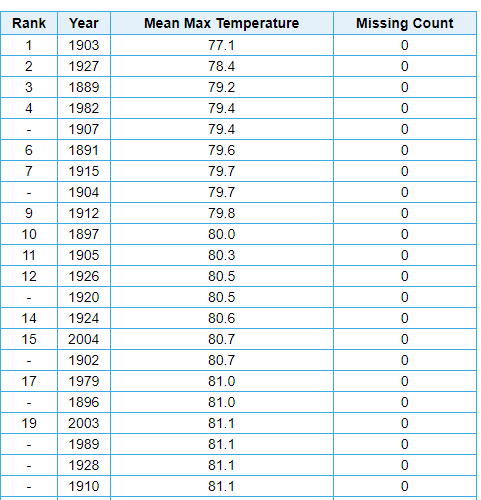
-
Central Pa. Summer 2024
TheClimateChanger replied to mahantango#1's topic in Upstate New York/Pennsylvania
I mean 6 of the top 14 [and 5 of the Top 10, for that matter] in the last 14 years with records dating to the 1800s is still pretty dominant. -
It's a good thing we have objective data to analyze this instead of one's feelings. Probably when you were a kid, you were out in the heat and now as an adult have to work in an air conditioned setting. Even sorted by mean maximum temperature, the top 4 hottest summers at DCA have all occurred since 2010. Obviously, 2024 is not over but it certainly appears destined to place in the Top 5, which would mean the Top 5 have occurred in a 15-year span. Further, there's a good reason to believe the values from 1986 to 1995 at DCA [and all other first order sites] were inflated relative to readings before and after that era [which included several summers with high maximum temperatures - 1987, 1988, 1991, 1993, 1994 and 1995]. Even so, each of the summers from 2010-2012 and 2016 surpassed those levels [and 2024 seems poised to do so as well]. Sources: climo_rpt_96_2.pdf (colostate.edu) - Study of 79 first-order climate sites between 1994 & 1995 found an average annual max temperature bias of +1.16F, and an average annual low temperature bias of +0.95F from the HO-83 relative to the ASOS installation. Comparison of ASOS and HO-83 temperatures at Lincoln, Nebraska from November 1991 through October 1992 (noaa.gov) - 12-month study from Lincoln, Nebraska study 1991-92. ASOS was from 1.4 to 2.6F cooler for maximum temperatures every month, and from 0.7 to 2.5F cooler for minimum temperatures. An Investigation of Temperature Discontinuities Introduced by the Installation of the HO-83 Thermometer in: Journal of Climate Volume 8 Issue 5 (1995) (ametsoc.org) - Another study, somewhat smaller estimate of 0.6C bias - actually suggests less bias in summer, but not sure that is correct. Ironically, I learned about this decades ago from climate change deniers. At that time, they were blaming climate change (in part) on this faulty sensor. Obviously, a ridiculous argument since U.S. first order airport sites make up a very small fraction of the USHCN sites, and almost zero percent of the global climate stations [the majority of which is water, after all]. But I correctly guessed it would turn to pointing to these same years as being evidence it wasn't warming as much as they said. The HO-83 Hygro- thermometer « Climate Audit - cites some more sources, particularly about Tuscon and how the NWS could not confirm a global warming signal in the deadly Chicago heat wave of 1995 because the readings were likely inflated by instrument bias
-
Pittsburgh, Pa Summer 2024 Thread.
TheClimateChanger replied to meatwad's topic in Upstate New York/Pennsylvania
Surprisingly made it up to 91F at Butler Regional (BTP) today [a typically cooler part of the metro area], where there's been significantly more sun and the lower dewpoints held off. Only 85 at KPIT, with some scattered showers starting to move into the region. -
Pittsburgh, Pa Summer 2024 Thread.
TheClimateChanger replied to meatwad's topic in Upstate New York/Pennsylvania
92/51, as of 4 pm. One thing you had pointed out, all of the 90+ readings this year have been 91F or better. Historically, a disproportionate number of 90+ days have topped out at exactly 90F. It makes a pretty substantial difference if you rank years by days with a high temperature greater than 90F [i.e., 91F or higher]. By that metric, only 9 years in the threaded record had more days strictly above 90F. And only 3 years since 1894 (1988, 20; 1966, 18; and 1952, 17). 2012, 1933 and 1901 also had 15 such days by July 28. -
Pittsburgh, Pa Summer 2024 Thread.
TheClimateChanger replied to meatwad's topic in Upstate New York/Pennsylvania
Additionally, today was the 67th day at or above 80F. That matches 1934 for the second most 80+ readings by this point in the calendar year. Only 1991 had more, with 74 such days. -
Pittsburgh, Pa Summer 2024 Thread.
TheClimateChanger replied to meatwad's topic in Upstate New York/Pennsylvania
Another 90+ reading at PIT... 15th on the year. Technically, 20th most in the threaded record; however, most of those are from the 19th century and suspect. Since 1901, only 8 years have seen more days of 90+ at this point in the summer: 1988, 23 1966, 23 1952, 20 1934, 20 2012, 18 1936, 17 1933, 16 1911, 16 -
Occasional Thoughts on Climate Change
TheClimateChanger replied to donsutherland1's topic in Climate Change
Very nice couplet on radar. -
Occasional Thoughts on Climate Change
TheClimateChanger replied to donsutherland1's topic in Climate Change
Interesting fire behavior from the Park Fire in California, with a fire tornado spawned by pyroCb. -
Pittsburgh, Pa Summer 2024 Thread.
TheClimateChanger replied to meatwad's topic in Upstate New York/Pennsylvania
-
Based on current trends, it appears likely that DCA will see some months reach mean temperature levels never observed outside of Death Valley prior to the 21st century by the end of this century.
-
Perhaps more impressive, the current monthly mean temperature of 84.5F would tie for 16th warmest July in the ENTIRE period of record at Miami. Higher July mean temperatures were never observed prior to 1981, and only 4 times prior to 2005 [1981, 1983, 1992 (Pinatubo be damned) and 1998]. The highest pre-1980 mean was 84.0F, set in 1969.
-
Yeah, 110F with 15-20% humidity, a 20-mph breeze, and a thick pall of acrid smoke greatly dimming the sun/solar radiation probably would not feel that bad tbh.
-
Summer 2024 Medium/Long Range Discussion
TheClimateChanger replied to Chicago Storm's topic in Lakes/Ohio Valley
Saw this on my X feed. Had to share here. -
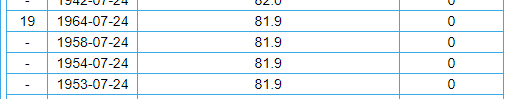
At Miami, the mean of 81.9F would tie for 19th warmest of the 89 years of record in the interval from 1896 to 1986 [inclusive]. So, yeah, even Miami is not a good comparison. Temperatures for the summer to date in DC in 2024 would be well above the median 20th century value for Miami for the period ending July 24. Prior to the very end of the 20th century, heat similar to that experienced in DC would only be expected in Miami a little more than twice a decade.
-
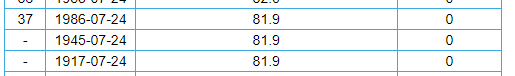
While still well above the median 18th & 19th century summer to date values for Orlando, Florida... a much more pedestrian ranking. This summer would tie for 37th warmest on record between 1892 & 1997.
-
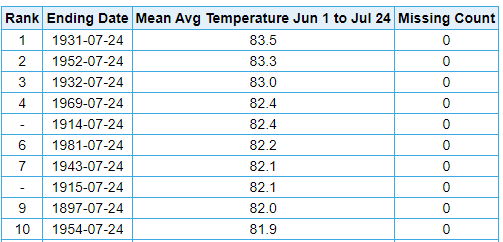
Similarly, in the 106-year period beginning in 1892 and ending in 1997 [inclusive], this value was exceeded in only 9 summers at Tallahassee, Florida.

-
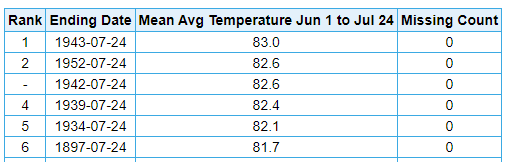
The mean temperature at DCA has been 81.9F for the summer to date. In the 93-year period beginning in 1884 and ending in 1976 [inclusive], this value was exceeded on only 5 occasions in Savannah, Georgia. Those being the summers of 1934, 1939, 1942, 1943 and 1952.
-
Central Pa. Summer 2024
TheClimateChanger replied to mahantango#1's topic in Upstate New York/Pennsylvania
70% chance of 90+ by Sunday for valleys and urban areas. The usual hot spots out your way will probably approach 95F. -
Central Pa. Summer 2024
TheClimateChanger replied to mahantango#1's topic in Upstate New York/Pennsylvania
The latest PBZ AFD highlighting some of the weather items I discussed yesterday. .LONG TERM /SUNDAY THROUGH WEDNESDAY/... KEY MESSAGES: - Warmer and more humid on Sunday. - A few rounds of disturbances pass to close out the weekend into the middle of next week. - Moderate risk of excessive heat beginning in August. ------------------------------------------------------------------- Further modification of the airmass continues on Sunday which will likely be the warmest day of the forecast period as probabilities sit up to 70% for >90F in the urban areas and valleys, though upper cloud coverage will increase from the southwest and could keep highs a little cooler. Ensemble clusters all absorb a cutoff upper low across the deep South back into the southwest flow aloft and show good agreement on its track through the Ohio Valley, but differ some on the amplification. This will return a more unsettled pattern to close out the end of the weekend into the beginning of next week as a few more disturbances pass through. Thereafter, ensembles still show notably good agreement by mid week in central CONUS ridging which would place our area in northwest flow aloft. While these patterns tend to be dry on average, they are also supportive of rounds of severe weather chances as we experienced in a similar pattern last week. Machine learning does paint a broad-brushed potential for a severe threat by mid week, but details won`t become clear for several more days. In addition, heat concerns return. Accordingly, CPC has issued another moderate risk of excessive heat from August 1st through August 7th. Lastly, with flow aloft extending downstream of the Canadian Rockies, wildfire smoke could make its debut to the Pittsburgh region this year. -
Pittsburgh, Pa Summer 2024 Thread.
TheClimateChanger replied to meatwad's topic in Upstate New York/Pennsylvania
.LONG TERM /SUNDAY THROUGH WEDNESDAY/... KEY MESSAGES: - Warmer and more humid on Sunday. - A few rounds of disturbances pass to close out the weekend into the middle of next week. - Moderate risk of excessive heat beginning in August. ------------------------------------------------------------------- Further modification of the airmass continues on Sunday which will likely be the warmest day of the forecast period as probabilities sit up to 70% for >90F in the urban areas and valleys, though upper cloud coverage will increase from the southwest and could keep highs a little cooler. Ensemble clusters all absorb a cutoff upper low across the deep South back into the southwest flow aloft and show good agreement on its track through the Ohio Valley, but differ some on the amplification. This will return a more unsettled pattern to close out the end of the weekend into the beginning of next week as a few more disturbances pass through. Thereafter, ensembles still show notably good agreement by mid week in central CONUS ridging which would place our area in northwest flow aloft. While these patterns tend to be dry on average, they are also supportive of rounds of severe weather chances as we experienced in a similar pattern last week. Machine learning does paint a broad-brushed potential for a severe threat by mid week, but details won`t become clear for several more days. In addition, heat concerns return. Accordingly, CPC has issued another moderate risk of excessive heat from August 1st through August 7th. Lastly, with flow aloft extending downstream of the Canadian Rockies, wildfire smoke could make its debut to the Pittsburgh region this year.