TheClimateChanger
-
Posts
4,593 -
Joined
-
Last visited
Content Type
Profiles
Blogs
Forums
American Weather
Media Demo
Store
Gallery
Everything posted by TheClimateChanger
-
Pittsburgh, Pa Summer 2024 Thread.
TheClimateChanger replied to meatwad's topic in Upstate New York/Pennsylvania
KPIT is up to 91F again. Still suspect we'll make a run for hottest of the year, probably 93-95F range for the high temperature. -
Not quite up to last year's historically high August heat indices in most places, but not far off. Here's Moline's highest heat index readings by hour in the month of August [1929-present]. The 10 a.m. reading of 100F is 5F shy of August 23, 2023.
-
Looking through the climate numbers for the day and one of the more notable readings was 97F at Traverse City. That was the highest reading there since June 30, 2018, when it reached 98F. It was the highest reading in the month of August since August 8, 2001, when it reached 98F. Furthermore, since 1968, there have only been two days in the month of August on which it was as warm or warmer than today's reading - August 2, 1988, when it reached 98F, and the aforementioned date in 2001.
-
Pittsburgh, Pa Summer 2024 Thread.
TheClimateChanger replied to meatwad's topic in Upstate New York/Pennsylvania
Wasn't super unexpected to me, although admittedly the official forecast had mid 80s for Allegheny County today. I commented yesterday that it would likely be close to 90F today, based on a review of the models - most of which were showing upper 80s, with the HRRR in the low 90s - and upstream observations with widespread low to mid 90s the prior day. NWS has 92F at the airport each of the next two days... personally, Wednesday looks like the hottest day of the year to me on the short-range modeling. Not sure why the NWS is going so much lower than they did with the June heat wave - maybe concern about clouds and convection, I'm guessing? A number of models have mid to upper 90s for Wednesday, and upstream observations are supportive. 96F in New Philadelphia was a new record, and just 3F shy of the monthly record. Reached at least 98F at Parkersburg, W. Va. for the second straight daily record high, and only 3 or 4F shy of the monthly record. Regardless, if we do 90+ tomorrow, Wednesday and Friday, as per the official forecast, PIT would have 23 90+ days in meteorological summer. That would tie 1966, 1901 & 1884 for 12th most on record. Excluding the suspect 19th century data, only 2 met. summers had more 90+ days since 1900 - 1988 (37) and 1995 (26). -
Pittsburgh, Pa Summer 2024 Thread.
TheClimateChanger replied to meatwad's topic in Upstate New York/Pennsylvania
-
Pittsburgh, Pa Summer 2024 Thread.
TheClimateChanger replied to meatwad's topic in Upstate New York/Pennsylvania
No need to wait now. Up to 90, as of the top of the hour. -
Pittsburgh, Pa Summer 2024 Thread.
TheClimateChanger replied to meatwad's topic in Upstate New York/Pennsylvania
Just wait until gets into the HRRR range. -
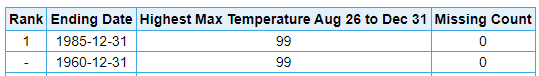
Seems pretty unreasonable to me. There are 4 dates later in the season with 100F+, 3 of which were observed when the official observations were taken at Midway Airport: 101, on 9/1/1953; 101, on 9/2/1953; 100 on 9/7/1960; and 100 on 9/7/1939. Looks like the highest temperature observed at O'Hare Airport on or after today's date is 99F in 1960 & 1985: Not to say it can't happen, but it would almost be without historical precedent.
-
Is that the same mechanism by which the Saharan dust inhibits tropical storms? Warming aloft from absorbed solar radiation and modest cooling at the surface lowering the lapse rate and resulting in a more stable atmospheric profile?
- 1,764 replies
-
- 1
-

-
- hurricanes
- tropics
- (and 5 more)
-
Pittsburgh, Pa Summer 2024 Thread.
TheClimateChanger replied to meatwad's topic in Upstate New York/Pennsylvania
Off topic, but one hell of a two-week period weatherwise there. Current forecast would suggest the high reaches at least 95F for six consecutive days, which would only be the 3rd time on record it reached 95 or better on 6 or more consecutive days there.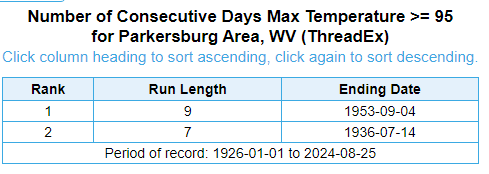
-
September's data on there hasn't been updated since 2021.

-
Pittsburgh, Pa Summer 2024 Thread.
TheClimateChanger replied to meatwad's topic in Upstate New York/Pennsylvania
For the record, yes, that was indeed a weathergami at Parkersburg, WV yesterday. Edit: Actually that was Friday’s 89/49. Yesterday’s 94/53 allegedly occurred on two other dates. -
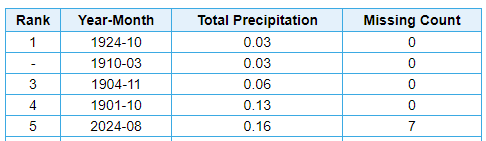
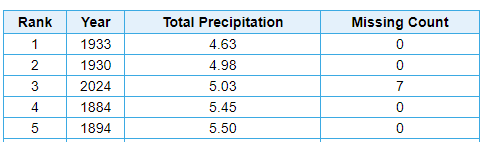
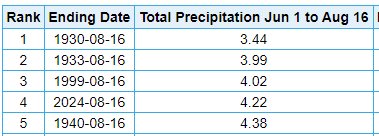
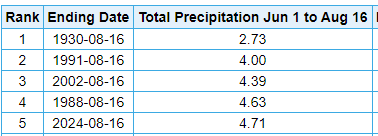
On the drought, Zanesville still at 0.16" for the month with 6 days to go. If no rain falls this week, it would be the 5th driest of any month [driest in about 100 years] and easily the driest summer month there. Columbus still at 3rd driest summer [1930, only 0.05" less] and driest since 1933.
-
Pittsburgh, Pa Summer 2024 Thread.
TheClimateChanger replied to meatwad's topic in Upstate New York/Pennsylvania
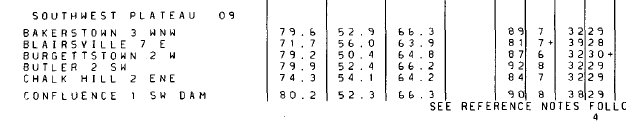
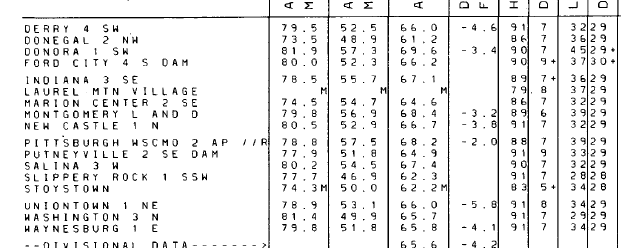
Looks like it could be close to 90 tomorrow. Tuesday and Wednesday may approach the hottest temperature of the summer. Wheeling reached 92F both yesterday and today. Zanesville was 94F today, and New Philadelphia reached 93F. Parkersburg had a record high of 96F today, after reaching record lows Wednesday through Friday in the mid to upper 40s. Actually, yesterday was pretty close to both the record high (missed by 2F) and record low (missed by 4F). I'm guessing that had to be a weathergami. -
-
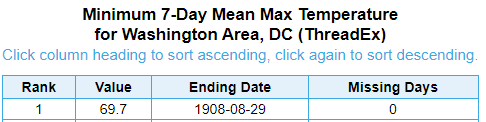
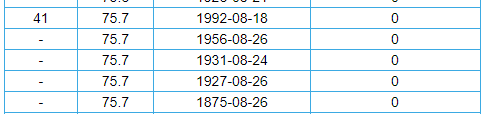
Probably many. There have been 7-day stretches entirely in the month of August in DC where the average maximum over that stretch was less than 70F. As recently as 1992, there was a 7-day stretch with an average maximum lower than yesterday's 76F.
-
I think he's ranking by unique values, which I've seen @bluewave do in the past. The poster corrected it to 10th place in a follow-up. If so, that's true. There's only 9 lower unique values on record - 67, 68, 69, 70, 71, 72, 73, 74 and 75. Although many of these lower values have been reached scores of times, including multiple times in many prior Augusts. So yes, ties for 10th lowest unique value max temperature, but lower maximum temperatures [between 67 & 75] have occurred on hundreds of dates in the month of August.
-
Ninth coldest what? I can't figure out what he's talking about. Does he mean the 9th coldest August 20th daily high at National Airport (1945-2024)? Because if that's what he means, even that's incorrect. It tied 1986 & 2000 for the 8th coldest high on August 20th since records were kept at the airport. In the entire threaded record, it ties 1986 & 2000 for 14th chilliest August 20th maximum temperature. It's nowhere near a monthly record. There have been well over 100 days with a max temperature at or below 71F in the month of August in the threaded record - probably several hundreds of days at or below 76F. Since records were kept at the airport (1945-present), it ties numerous other years for 99th coldest August maximum temperature. Where is 9th coldest all-time coming from?
-
Pittsburgh, Pa Summer 2024 Thread.
TheClimateChanger replied to meatwad's topic in Upstate New York/Pennsylvania
Looks like it already hit 70 in the early hours today. Not sure if it gets back there this afternoon. If we get any sunny intervals, then I think it could hit 71-73F. But if stays overcast and drizzly, then it might hover in the upper 60s the remainder of the day. -
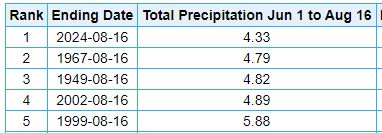
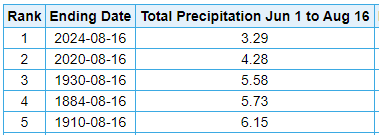
Looks like some much-needed rain to hit parts of central and southeast Ohio over the weekend. Has been one of the driest summers on record to date in that part of the subforum, and it looks like dry weather returns after this weekend. Columbus, Ohio [4th driest to date] Zanesville, Ohio [5th driest to date] New Philadelphia, Ohio [driest on record - since 1948] Wheeling, West Virginia [driest on record]
-
Pittsburgh, Pa Summer 2024 Thread.
TheClimateChanger replied to meatwad's topic in Upstate New York/Pennsylvania
Also, despite the recent cooldown, still in 8th place overall in the threaded record in terms of summer temps to date with only 2 warmer years since 1901 (1934 & 1949). Given the forecast for the next week or so, we will be dropping in these rankings. Pretty much a done deal - barring incredible heat at the end of the month - that we will finish below 1995, and probably even 2016. Edit: Actually looking at yesterday's 8-14 day outlook, CPC gives us slightly elevated odds for below normal continuing right into week 2 [August 22-28]. I do suspect we'll see at least one more heat wave at the tail end of August or in September.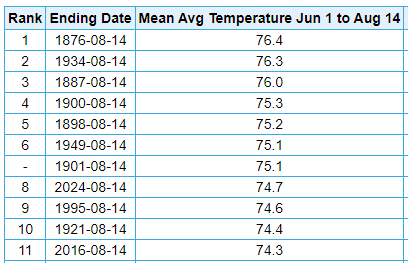
-
Pittsburgh, Pa Summer 2024 Thread.
TheClimateChanger replied to meatwad's topic in Upstate New York/Pennsylvania
The iPhone weather app would suggest we approach 70 for a high for a few days early next week. Doubt we get there though, as the NWS forecast is generally more moderate with mid 70s, which seems reasonable with the sunshine on Tuesday & Wednesday, and warm/muggy start on Monday. Otherwise, wildfire smoke has created more haze than I would have thought the last couple days. Didn't look too impressive on modeling but it's been hanging low in the atmosphere. Seems thicker up in New England. -
It's funny. I don't see all the "it's just summer" commenters on X chiming in like you would see in response to a forecast of +10 for several days. When it's 2 or 3 degrees below normal [and that's with the highest normals which have been jacked up ~2F in the past 30 years] for a handful of days, isn't it literally just summer?
- 1,764 replies
-
- 1
-

-
- hurricanes
- tropics
- (and 5 more)
-
Pittsburgh, Pa Summer 2024 Thread.
TheClimateChanger replied to meatwad's topic in Upstate New York/Pennsylvania
-
Central Pa. Summer 2024
TheClimateChanger replied to mahantango#1's topic in Upstate New York/Pennsylvania
Oh no, it's oh so cold! I guess climate change really is a hoax! Wake me up when most of southwest Pennsylvania is at or below freezing... Even the heat island at the PIT airport is in the 30s, and outlying areas have mean monthly lows in the 40s. Because this is what actual cold weather in August looks like. It looks like 1982.