TheClimateChanger
-
Posts
4,598 -
Joined
-
Last visited
Content Type
Profiles
Blogs
Forums
American Weather
Media Demo
Store
Gallery
Everything posted by TheClimateChanger
-
Pittsburgh, Pa Summer 2024 Thread.
TheClimateChanger replied to meatwad's topic in Upstate New York/Pennsylvania
-
Pittsburgh, Pa Summer 2024 Thread.
TheClimateChanger replied to meatwad's topic in Upstate New York/Pennsylvania
-
Pittsburgh, Pa Summer 2024 Thread.
TheClimateChanger replied to meatwad's topic in Upstate New York/Pennsylvania
Severe Weather Statement National Weather Service Pittsburgh PA 731 PM EDT Wed Jun 26 2024 PAC003-270000- /O.CON.KPBZ.TO.W.0025.000000T0000Z-240627T0000Z/ Allegheny PA- 731 PM EDT Wed Jun 26 2024 ...TORNADO WARNING REMAINS IN EFFECT UNTIL 8 PM EDT FOR CENTRAL ALLEGHENY COUNTY... At 731 PM EDT, severe thunderstorms capable of producing both tornadoes and extensive straight line wind damage were located over Imperial, or 7 miles south of Moon Township, moving east at 40 mph. HAZARD...Tornado. SOURCE...Radar indicated rotation. IMPACT...Flying debris will be dangerous to those caught without shelter. Mobile homes will be damaged or destroyed. Damage to roofs, windows and vehicles will occur. Tree damage is likely. Locations impacted include... Pittsburgh, Penn Hills, Mount Lebanon, West Mifflin, North Side Pittsburgh, Baldwin, Scott Township, Wilkinsburg, Robinson Township, Munhall, Brentwood, Swissvale, Dormont, Carnegie, Crafton, Green Tree, Mount Oliver, Ingram, Homestead and Edgewood. PRECAUTIONARY/PREPAREDNESS ACTIONS... Move to an interior room on the lowest floor of a well-built building away from windows. If you are outdoors, in a mobile home, or in a vehicle, move to the closest substantial shelter and protect yourself from flying debris. && LAT...LON 4043 8028 4047 7988 4038 7989 4040 8026 TIME...MOT...LOC 2328Z 272DEG 33KT 4042 8029 TORNADO...RADAR INDICATED MAX HAIL SIZE...0.00 IN $$ Bookbinder -
Occasional Thoughts on Climate Change
TheClimateChanger replied to donsutherland1's topic in Climate Change
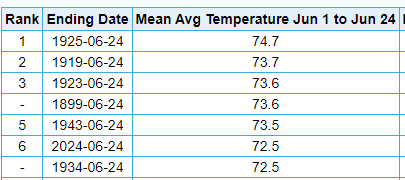
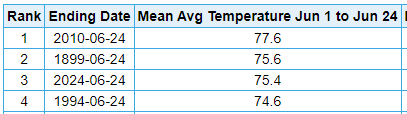
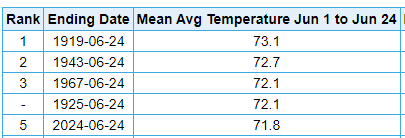
What's interesting is, unlike many months, in many cases, it has been many decades since these longer POR stations had a warmer June. 1994, 1967, 1943, 1925 & 1919 show up a lot on the list of warm Junes in the commonwealth. -
Occasional Thoughts on Climate Change
TheClimateChanger replied to donsutherland1's topic in Climate Change
NWS has 98 as the forecast high for downtown Atlanta and KATL. I believe that forecast is for downtown Atlanta. Actually, comparing the two point-click forecasts, KATL is the same or a degree warmer every period. -
Occasional Thoughts on Climate Change
TheClimateChanger replied to donsutherland1's topic in Climate Change
Interesting. It looks warmer than the IEM estimate, but I'm not sure what data they are drawing off of that... also, the inclusion of May 31 data (7 am) draws it down a bit relative to a 24-hour day. Guess we'll have to wait and see what NCEI shows. Of course, most of the record warm sites have short PORs. But I'd still say the first order climate sites would suggest a top 10 warm June, and probably top 5. -
Occasional Thoughts on Climate Change
TheClimateChanger replied to donsutherland1's topic in Climate Change
Also, for the urban heat enthusiasts, find the so-called UHI in this set of data. We have one very large city, surrounded by rural areas and small. Urban heat theory would say the city is the hottest spot by far. For the record: I don't doubt UHI exists, this is for the bozos who say it's the cause of the warming and way overplay its impact - especially on trend. Like UHI warms the local environment relative to forests or farmland [mostly w.r.t. overnight lows], but it doesn't cause a never-ending warming trend. Or start warming areas outside of the city and/or oceans. That makes zero sense. If you listen to some of these bozos, the city should be 10F+ warmer. -
Occasional Thoughts on Climate Change
TheClimateChanger replied to donsutherland1's topic in Climate Change
Ah, interesting. Looks like it's doing an excellent job today as well, with widespread temperatures already between 95 & 100. Dewpoints have dropped back into the 50s in most areas, already see a couple of 40s showing up (KWRB - 99/49; and KOPN 93/41). Might even see some Tds drop into the 30s if this keeps up. Must be a big relief for those of you in the southeast to see those kinds of dewpoints at this time of the year. -
Occasional Thoughts on Climate Change
TheClimateChanger replied to donsutherland1's topic in Climate Change
If anything, NOAA consistently underplays how much warming has taken place. Just look at this map, and then compare it to the actual rankings of the various first order climate sites. This discrepancy grows more each and every year. And it has nothing to do with UHI, because the trend is the same for rural sites. Every site in the state of Pennsylvania is having a top 10 warmest June, with the exception maybe of Pittsburgh. I think it's top 12, but that's heavily influenced by the fact that the downtown station was nearly 500' lower in elevation. Plus, it goes back to 1874, not 1893 as this map. Several locations are near their warmest Junes on record. Yet NOAA claims it's not been warm at all. Top 15-25 - which is where they have most of the state - is not warm in this era. No idea what data they are looking at. -
Central Pa. Summer 2024
TheClimateChanger replied to mahantango#1's topic in Upstate New York/Pennsylvania
-
Pittsburgh, Pa Summer 2024 Thread.
TheClimateChanger replied to meatwad's topic in Upstate New York/Pennsylvania
It could be SPC that’s asleep at the wheel. -
Pittsburgh, Pa Summer 2024 Thread.
TheClimateChanger replied to meatwad's topic in Upstate New York/Pennsylvania
Rare to see them trot out the "t" word, especially with SPC not even giving us a 2% chance. -
Pittsburgh, Pa Summer 2024 Thread.
TheClimateChanger replied to meatwad's topic in Upstate New York/Pennsylvania
Rest Of Today Partly sunny late this morning, then mostly cloudy with scattered thunderstorms this afternoon. Some thunderstorms may be severe with damaging winds, small hail, heavy rainfall, and tornadoes. Highs in the mid 80s. Southwest winds 10 to 15 mph. Chance of precipitation 50 percent. Tonight Considerable cloudiness. Thunderstorms and showers likely in the evening, then a slight chance of showers and thunderstorms after midnight. Patchy fog. Some thunderstorms may produce damaging winds, small hail, heavy rainfall, and tornadoes in the evening. Humid with lows in the lower 60s. Northwest winds 10 to 15 mph, becoming west around 5 mph after midnight. Chance of rain 70 percent. -
Looking like some very comfortable dews in the 50s today for the District.
-
Occasional Thoughts on Climate Change
TheClimateChanger replied to donsutherland1's topic in Climate Change
Nice graphic. This depicts exactly what I had said months ago. I know it's not all of the stations, but you've picked a pretty representative 5-site sample, and demonstrated how every station could have a defined warming trend within a certain time frame but the average of all available stations can show a fake cooling trend if warmer stations are replaced over time by cooler ones [or even if simply more "cooler" stations are added to the station mix over time]. -
Occasional Thoughts on Climate Change
TheClimateChanger replied to donsutherland1's topic in Climate Change
And it looks like dewpoints did in fact drop into the 40s and 50s, at least in the places I looked at. Good work by the HRRR! -
Occasional Thoughts on Climate Change
TheClimateChanger replied to donsutherland1's topic in Climate Change
Looks like the models did pretty well. Lots of triple digits. I saw a cousin was in Birmingham and posted a picture of his car thermometer reading 110! -
Occasional Thoughts on Climate Change
TheClimateChanger replied to donsutherland1's topic in Climate Change
-
Central Pa. Summer 2024
TheClimateChanger replied to mahantango#1's topic in Upstate New York/Pennsylvania
Very solid numbers statewide, with many locations in the midst of their warmest June in many decades. Harrisburg [3rd warmest to date, warmest since 1943] Williamsport [6th warmest to date, warmest since 1943] Hagerstown, Maryland [just over the border] [3rd warmest to date] Bradford [shorter POR - 1958] [warmest to date] Dubois [shorter POR - 1963] [2nd warmest to date, behind 1967] Scranton/Wilkes-Barre Area [5th warmest, warmest since 1967]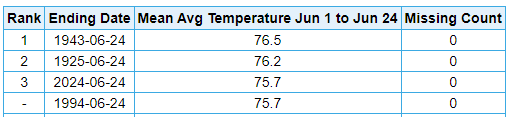
-
Central Pa. Summer 2024
TheClimateChanger replied to mahantango#1's topic in Upstate New York/Pennsylvania
I guess it depends on the level of rarity you wish to achieve. There have been 13 of those at MDT since 2000 - or a little more frequent than once every other year. 5 days of 90+ would be a little more than once every year. But either is better than the traditional 3 days of 90+. -
Central Pa. Summer 2024
TheClimateChanger replied to mahantango#1's topic in Upstate New York/Pennsylvania
There's a fine line between rare and climatologically impossible. -
Central Pa. Summer 2024
TheClimateChanger replied to mahantango#1's topic in Upstate New York/Pennsylvania
IMO, the 3-day threshold is more appropriate for places like Pittsburgh, Cleveland, Detroit, Buffalo, Albany, Boston, etc. Not sure why it became the standard in Harrisburg. -
Central Pa. Summer 2024
TheClimateChanger replied to mahantango#1's topic in Upstate New York/Pennsylvania
The 3-day definition was never intended for very hot climates like Harrisburg. Pittsburgh has had 26 stretches of 3 or more 90F readings in a row since 2000 - an average of about once per year. When people think of a heat wave, they think of a period of heat that is expected to occur about once a year more or less. Harrisburg, on the other hand, has had 75 stretches of 3 or more 90F readings since 2000 - an average of about 3 per year. To get it to that once per year sweet spot, you should be using 5+ days of 90F or more. There have been 28 of those, or just a little more than once per year. -
Central Pa. Summer 2024
TheClimateChanger replied to mahantango#1's topic in Upstate New York/Pennsylvania
Nobody uses that definition, nor should they. You realize there are only 6 overnight lows of 80F+ in Harrisburg weather history? None on back-to-back nights. -
Pittsburgh, Pa Summer 2024 Thread.
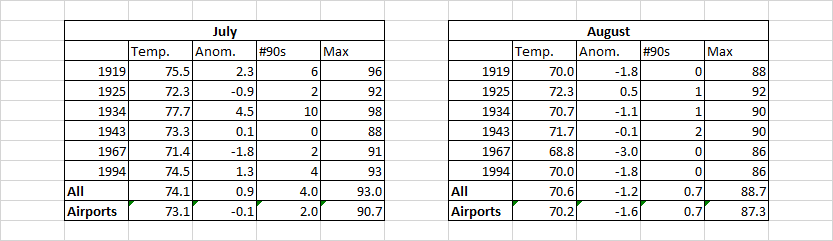
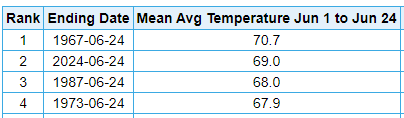
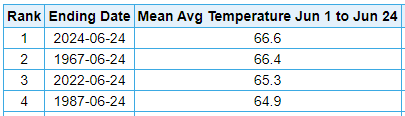
TheClimateChanger replied to meatwad's topic in Upstate New York/Pennsylvania
Well, Mark Margavage says unlikely, but I'm not too convinced by the logic employed to reach that conclusion. I did a little more analysis, looking at years with similar or warmer Junes over the past 100 years or so [excluding any 19th century records]. Specifically, I looked at 1919, 1925, 1934 (downtown city office), 1943 (AGC), and 1967 & 1994 (PIT). You could make the case for 1988 - it had 8 90+ days in June - but it was characteristically different than the other years. In fact, it was decidedly cooler than the present normal for June and nearly 4F cooler than this year on a to-date basis. So despite the periods of extreme heat, it wasn't a particularly warm month overall. Obviously, 1988 would somewhat buck the trends presented and instead look like a more extreme version of 1934 that carried straight through August. Overall, the historical data following very warm Junes would, in fact, suggest the worst is probably over. 1919 & 1934 both saw one impressive heat wave in July. There were four days of 90+ in a row from 7/2/1919 to 7/5/1919, and 7 of 8 in 1934 from the 19th to 26th. That was regarded as one of the worst heat waves ever for much of the country with widespread 100s, but downtown Pittsburgh topped off at 98 on the 24th, and in classic fashion, had an 89 right in the middle disrupt what could have been an 8-day heat wave. Overall, July looked fairly typical other than 1934. The city office means and maximum temperatures from that era are no doubt elevated relative to what would be observed at the airport locations. August was decidedly cooler than modern normals, with no extreme heat in any of the months. In fact, only 4 days of 90+ spread across the 6 years [and only 1 day that actually exceeded the 90 degree mark]. In any event, historically, very warm Junes in Pittsburgh have not served as a prelude to a non-stop blazing inferno the rest of the summer. In fact, the majority of years, temperatures were relatively moderate, with at most one more stretch of extreme heat seen.