vortex95
-
Posts
2,208 -
Joined
Content Type
Profiles
Blogs
Forums
American Weather
Media Demo
Store
Gallery
Everything posted by vortex95
-
Worth it? You might think differently when you do not have power for a month!
-
2026 Atlantic Hurricane Season
vortex95 replied to Stormchaserchuck1's topic in Tropical Headquarters
The ACE value CSU found for 1933 comes from HURDAT2 reanalysis. They noted an increase in ACE from 213 (original HURDAT) to 259 (reanalyzed HURDAT2). See here: https://journals.ametsoc.org/view/journals/bams/102/3/BAMS-D-19-0330.1.xml -
Here is a short paper I cam across recently that was eye-opening to me. It shows that it goes beyond just absolute SST values and OHC depth for TC RI. Paper attached. Why Do Eastern North Pacific Hurricanes Intensify More and Faster than Their Western-Counterpart Typhoons with Less Ocean Energy? We show that eastern North Pacific hurricanes reach a given intensity 15% faster on average than western North Pacific typhoons despite having half the available ocean heat content. Eastern North Pacific hurricanes also intensify on average 16% more with a given ocean energy (i.e., air–sea enthalpy flux) than western North Pacific typhoons. As efficient intensifiers, eastern Pacific hurricanes remain small during their intensification period, tend to stay at lower latitudes, and are affected by relatively lower vertical wind shear, a colder troposphere, and a drier boundary layer. Despite a shallower warm upper-ocean layer in the eastern North Pacific, average hurricane-induced sea surface cooling there is only slightly larger than in the western North Pacific due to the opposing influences of stronger density stratification, smaller size, and related wave-interaction effects. In contrast, western North Pacific typhoons encounter a more favorable oceanic environment for development, but several factors cause typhoons to greatly increase their size during intensification, resulting in a slow and inefficient intensification process. The NW Pac has the most widespread high SSTs and high OHC than anywhere else on the globe, yet the ern Pac "beats" it in the TC RI dept! The takeaway I got from an overall perspective, you can't always treat atmospheric phenomena and the system as linear and intuitive. Complex systems do not work that way. Also, the more you learn, the more you realize there is a lot to learn! That is accurate, and a good thing. No matter how long you are in a field and well-versed, there is always more. bams-BAMS-D-21-0131.1.pdf
-
The line: in the X post: Totally normal things happening in the Pacific Hard to say if this is being facetious or serious, as if their is something "wrong" b/c the Pacific is so active for TC. What @TheDreamTraveler says is correct in a global pattern sense. How? It has long been observed, regardless of ENSO, when the Atlantic is active, the Pacific is not, and vice versa. Of course, it is not always like this, but nothing is in the wx patterns and what happens is 100%, just noting it occurs most of the time in a given NHEMI TC season. Note: You do not have to take my word for it, you can go here and crunch the numbers yourself! https://tropical.atmos.colostate.edu/Realtime/ During the inactive period the Atlantic had 1970-94, the Pacific was very active. Since the active period started in the Atlantic in 1995, the Pacific overall net activity has been significantly down, esp. in the NW Pacific, which constitutes 38% of avg annual ACE globally (more than double any other TC basin). Look at this stat: For the NW Pacific, 2020-2025 was below average ACE each year, as low as 51% for ACE in 2020. In fact, the total ACE for this 6-year period was only 66% of average, which is the lowest 6-year ACE on record for this basin going back to 1950. Getting more specific as to individual years, it has long been observed when El Nino exists, the Atlantic TC activity for that season that El Nino starts is suppressed, and the Pacific is active, and the stronger the El Nino, the more pronounced it is in each basin. So what is going on in 2026 exactly matches empirical observations of the past is an completely normal as far as sensible wx. Yes, it is an extreme at both ends here, but that does not mean something is "wrong" w/ the wx or global pattern. I see a trend here and there that the presence of any big swings or extremes in wx is somehow unusual and not supposed to happen *at all*. That is ridiculous and represents a fundamental misunderstanding as to how the Earth's system works naturally. Don't get me wrong, very strong El Nino does some wild things to the global pattern and sensible wx, but it is par for the course in the large picture. And such wild El Ninos are nothing new. Look up the 1877-78 one. Also in recent decades, the base state of the ENSO region has trended more La Nina overall, and that partially explains why the Atlantic has been so active since 1995. Atlantic activity is also tied to the phase of the AMO, which has been favorable. If things hold to the AMO cycle since the mid-19th century, the AMO flip should occur within the next 10 years and we should see a reduction overall in TC activity in the Atlantic. One more item, it is rare to have all TC basins the world to all be suppressed (below avg) in a given year. It has happened a few times, like in 1977 and 2009, but usually at least one is active (above avg), so again what @TheDreamTraveler said is valid -- "that energy has to go somewhere!" It is all connected the end, just not always easy to see how in a given year, and thus what will happen overall!
-
Fallacious argument. The trouble w/ the "ppl are dying!" argument is that it essentially dictates that anything less than death is trivial and not worth discussing. That is among the most vapid and intellectually lazy rebuttals around. Can you objectively say these fatalities would not have occurred anyway if there were more reaonsble and less-hyped warnings? Not every fatality is due to not enough warnings or alerts. Many ppl will ignore warnings and go out/take risks despite warnings b/c they have become apathetic to the relentless hype. Some ppl just plain resist authority/being told what to do. And some do take warnings seriously, stay home, and a tree crashes into their home, causing a fatality. All the warnings in the world is not going to prevent something like that from happening. So I would avoid the high-horse, virtue signaling here and understand that more is not always better and things are not a simple 1-1 correlation when it comes to complex societal issues.
-

-
@jconsor good questions! It got close to subtropical status ydy. Saying it had no characteristics of that is incorrect. Not enough to call it a named ST storm, but not a whiff either. And despite being shallow warm core, it is *strong* warm core w/ thickness that high. Saw 23 C and 850, 14 C at 700 , and -3 C at 500 on the ECMWF analysis earlier on in the storm. That is a common temp profile in a strong TS in the tropics or a hybrid system farther N, Those 925-500 temps I just listed is what Sandy had per recon when it underwent a solid warm seclusion and became more tropical offshore the day of landfall (as a Cat 2), like the Perfect Storm did late in its existence. A warm seclusion is the first step to ST or T transition, so why that it is said a "mere warm seclusion" is odd. Yes, many, many occluded cyclones get a warm seclusion, but not all are the same or stop there. And in this case, SSTs plenty warm for a ST or even T transition. 26 C as a cut off is overrated. You can get legit ST systems w/ SSTs as low as 15 C. Look at the Jan 2023 event off the Mid-Atlantic -- it was just a little bit farther offshore than this event, but that made all the difference I think. I posted on that earlier on this thread along w/ a sat loop that shows a remarkable hurricane for time of year and location! NHC ignored it operationally and called it s 60 kt STS later, but I do not agree. 65 kt HU easy. Subtropical storms do not have a persistent defined eye w/ a solid ringeven of mdtly-deep convection. Find me a baroclinic strong coastal storm in which the sfc low started S of the 576 thk line and wrapped, creating a closed pool of 582 thk over the center. That's practically unheard of, at least in this part of the world. So an outlier case, and that's why you can't treat it as "only" this or that typical. The thing that prevented this storm from becoming total ST is that is was just a bit too close to land. You want to see such a system 150 mi or more away from sig land b/c otherwise cooler/drier continental air keeps funneling in. But given this storm was fcst such an outlier event climo-wise, I was cautious as to something unexpected happening here.
-
Awareness is a two way street. You don't need to be relentlessly reminded on how "dangerous" it out out there, esp. when it is not that "dangerous" overall. Constant negative like that wears on society, promotes anxiety, and impacts zeitgeist, among other things. You start viewing the world as worse that is actually is, and many ppl think the wx is worse and unlike anything society has ever experienced before b/c of wx hype and the ordinary is constantly turned into the extraordinary That is not good. Decisions and policy are made from such false perceptions, never mind needless cancellations, as a couple of examples.
-
I have noticed more hype wording over times. You will see "powerful" and "dangerous" used a lot. This kind of wording was used much more sparingly through the 90s, and was reserved for the truly high-end events. I got news you, all Nor'easters (and hurricanes for that matter) are powerful and dangerous. Redundant wording. This hurts business and commerce overall to the point we are being held hostage by the wx. That is not good. More is not always better. Using "better safe than sorry" is a cop out, get-out-of-jail-free, weasel excuse. But you have pander to the lowest common denominator these days. But at the same it insults those would know the deal and are responsible when it comes to wx and promotes distrust in authority b/c they clang the alarm bell relentlessly. And now supermarkets are crowded for a Nor'easter that has zero snow? WTF? You see the problem here. Unnecessary panic and fear is instilled every time of inclement wx now. And don't get me started on the use of "catastrophic" That is abused big time. The problem is that it is used by default. Impact/damage is never severe, disastrous, moderate, minor, or anything else other than "catastrophic" these days. Ever notice that? There is no scaling or quantification of it all anymore.
-
What about the swath of tree damage in GHG from the Bliz of 13? Legendary you talk about that!
-
T-bone frontal fracture. That's a Sharpio-Keyser cyclone, the ones that have the crazy winds on the backside. Dec 9, 2005 is perhaps the best one in SNE.
-
When you say the weenie in Welfleet is 100 ft. Is that is ground elevation or the anemometer height? I say this b/c as long as the anemometer height is 10 m, it doesn't matter what the ground elevation is. Yes, of course ground elevation relative to surrounding elevation needs to be considered, but ppl and infrastructure are still there! If one happens to live on a ridge/bluff, that doesn't discount it. The former CHH radar/RAOB site sits on a bluff, and I recall comparing obs here to the CQX airport, Night and day! CQX is not that windy of location. HYA/FMH/PVC do much better. Here is the BID airport. Despite it's elevation, it is far enough inland and surrounding by trees that you are going to have sig differences to the shoreline. I've seen this numerous times going E on 286 to Seabrook MA. Once you get out of the trees and into the salt marshes, holy cow!

-
I was just thinking of Dec 11-12, 1992...the one @CoastalWx likes to forget b/c he got royally screwed in Brockton when so many others basked in white glory, getting their biggest snowfall in nearly 10 years! That even started w/ sig wind well before the pcpn started (reminded me of he Bliz of 78). You know you are in for it when that happens! Then a full day of R+ in ern MA, that turned to S+ predawn the next day and I got 18" in Woburn. To get that much rain first and that much snow in a single event is practically unheard of. Woonsocket RI had 7" total pcpn (20" of that snow). That is huge amount of pcpn in the NEUS for a nor'easter in a winter month. And it was not that extreme as far as low/high combo. 985 low stalled E of the Delmarva and a 1035 high in Quebec. Yet coastal flooding was epic.
-
This was always going to be "takes its time" type storm, but in the end everything will verify. Not every storm comes in hot and heavy like the Bliz of 93. @CoastalWx take note...
-
BOS G50KT. How is that cancel? BED G40KT, G61 KT Welfleet and on Block Island. Exactly as fcst and what the HRRR showed. Next thing you'll do is "we cancel the rain" Pfft! You do realize this is duration event and the rain does not end in ern sections until close to sunrise Tue.
-
Yes, and the memes and cliches on TV and social media would have been out of control!
-
2026 Atlantic Hurricane Season
vortex95 replied to Stormchaserchuck1's topic in Tropical Headquarters
Despite the suppressed activity, what has happened has been a bit odd. For instance, it is not often you have a TS form E of the Cabo Verde islands and dissipate in the same general area! And you have Fay that won't go away and has been moving WSW at an unusually high latitude for a few days now. Bertha at one point so ridiculously sheared w/ the low-level and mid-level displaced in the Gulf but an incredible MCC w/ an enormous amount of CGs -
Another item, MQE ended up w/ 5.76" of rain for the Perfect Storm in 1991, far more than any model showed. Of course, no hires models then, but what the ECMWF is showing does makes sense when you have extended duration big ENE fetch moist flow.
-
But give it some "TYME!!!" It has lots of it to meander "down there."
-
What about 99 bottles of BEER on the wall?
-
Sct embedded tstms likely. CAPE not bad in SNE for a Nor'easter today and Sunday. So bring down those winds as @ineedsnow would say!
-
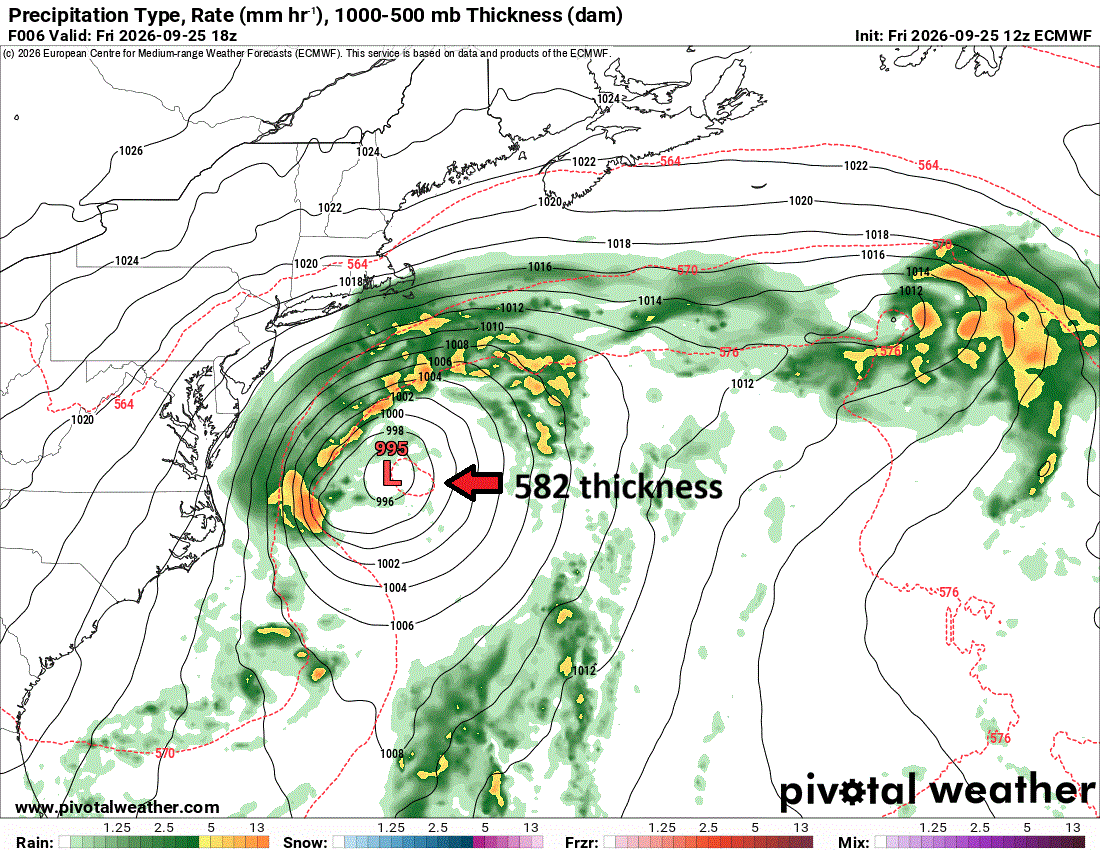
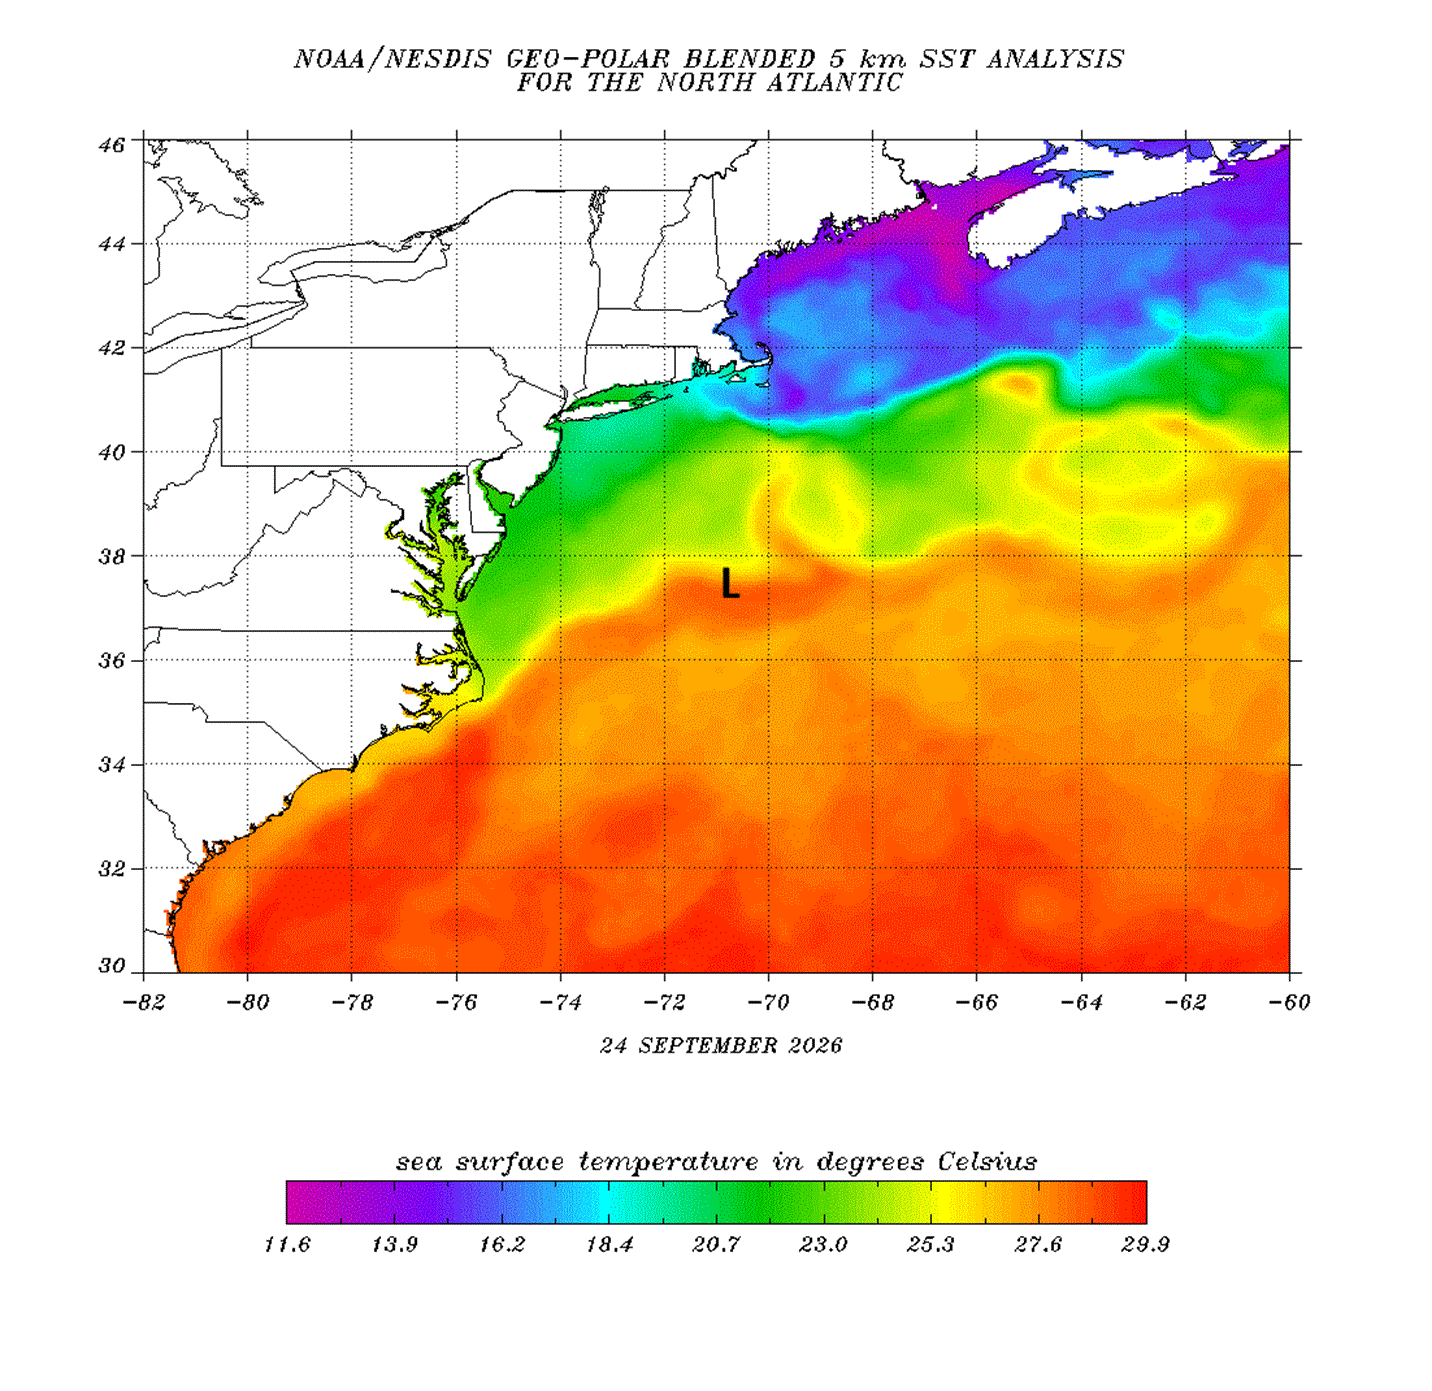
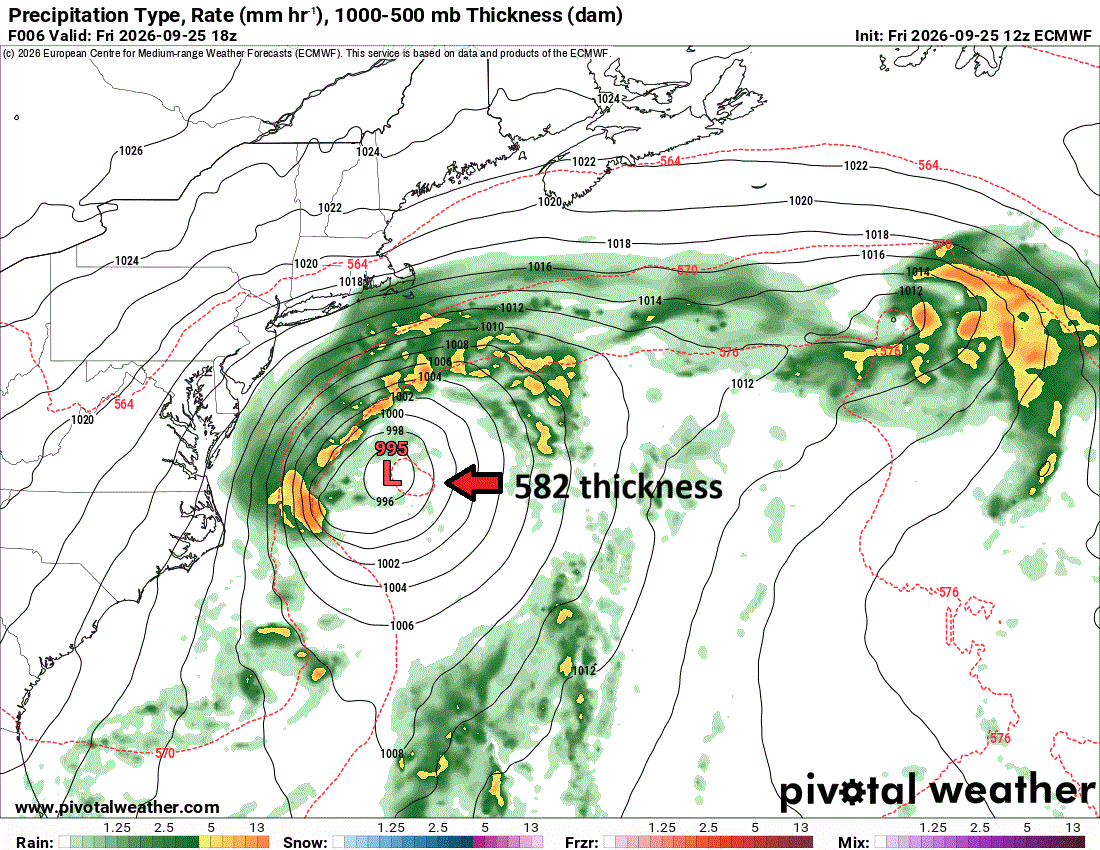
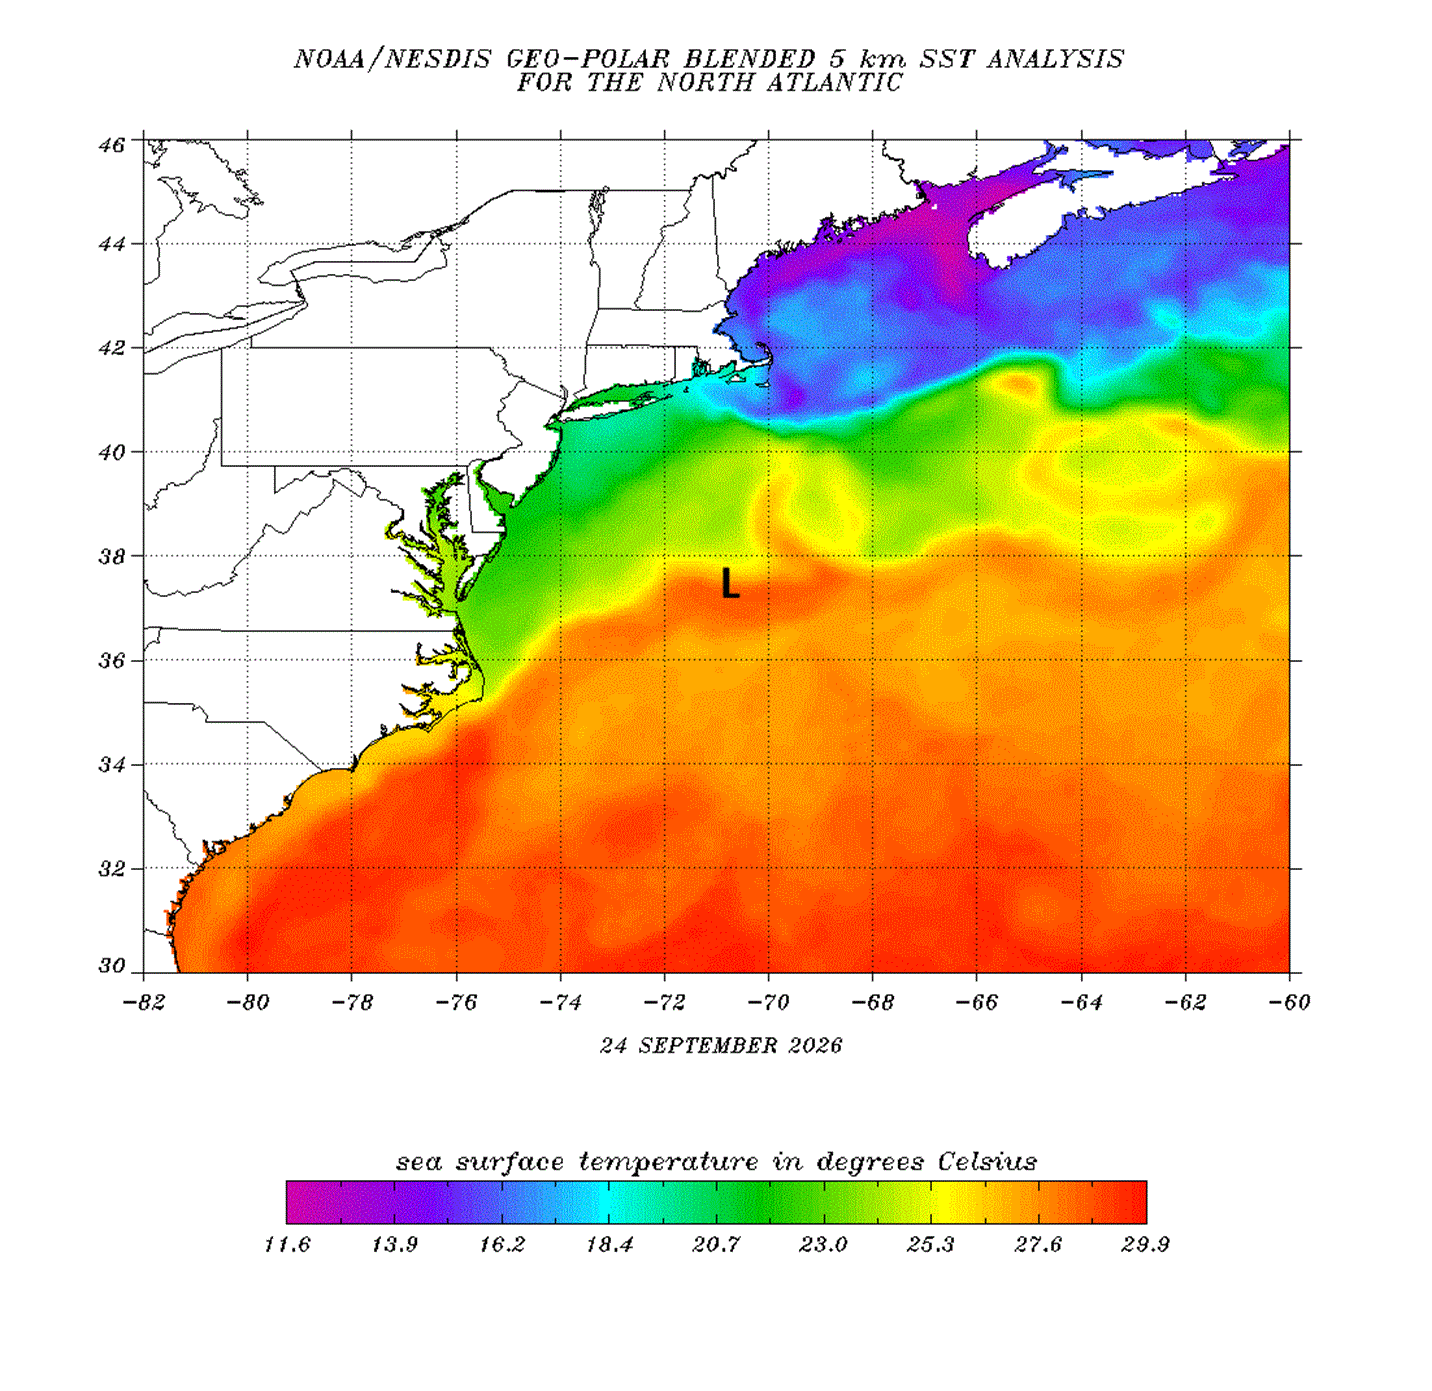
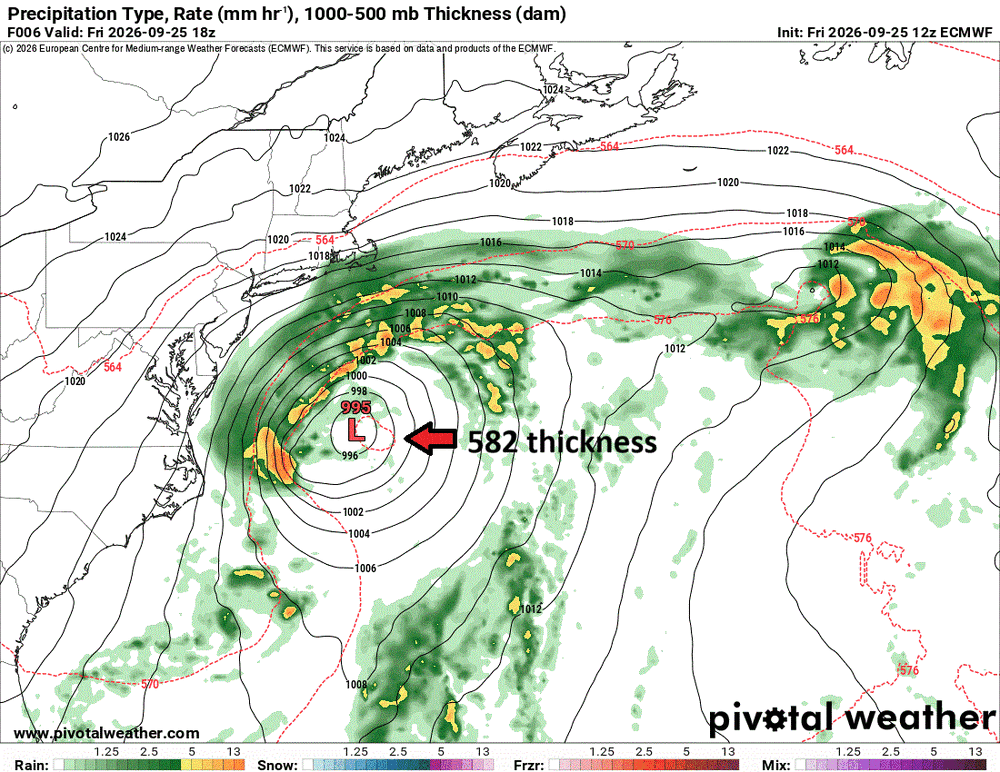
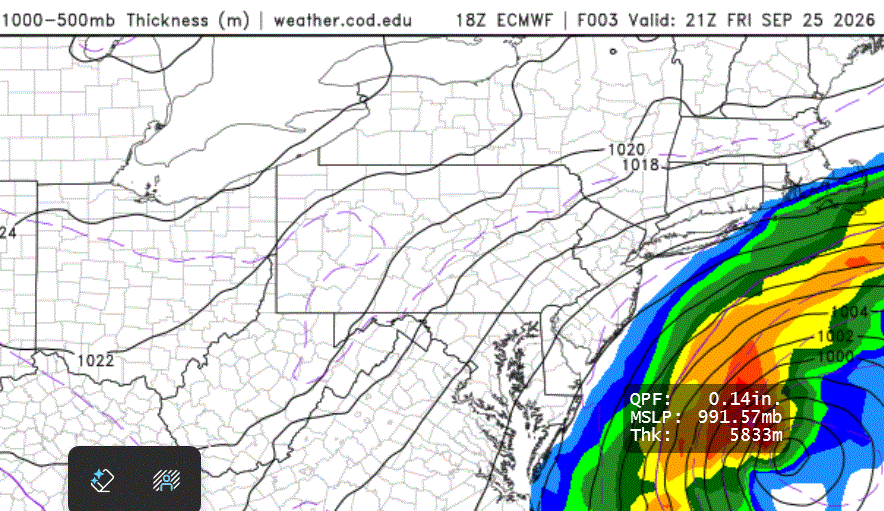
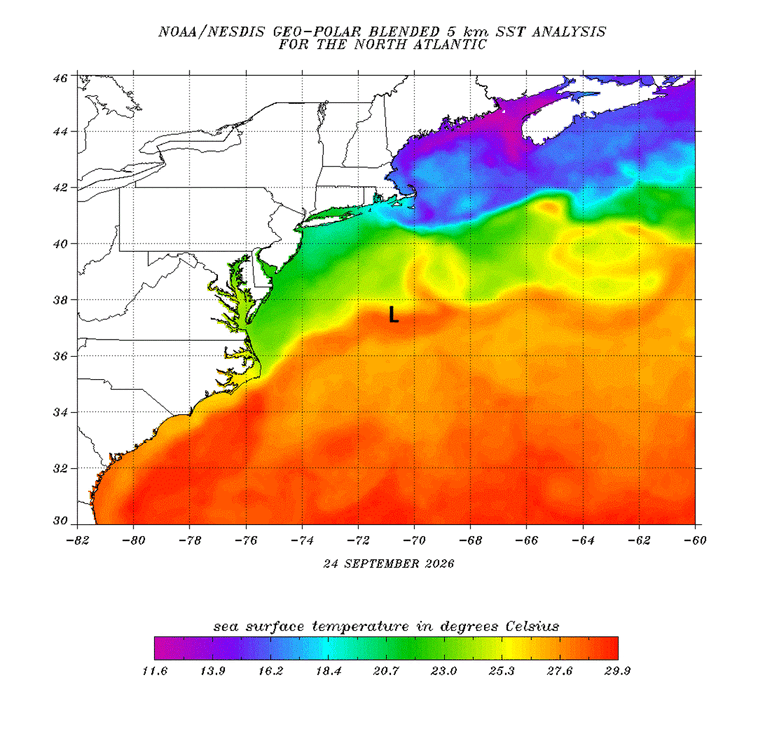
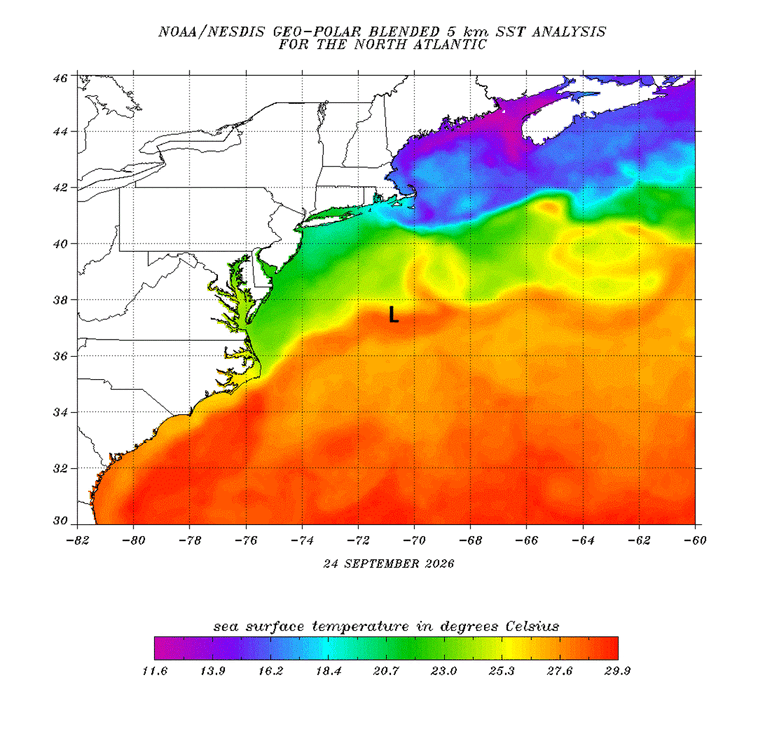
This is not your typical "cold" ET storm evolution. The initial surface low development was S of the 576 dm 1000-500 thickness line and by 25/18z, a small 582 closed thickness pool had formed over the low center (see ECMWF 12z 06 hr and 18z 03 hr forecast attached). This is a much higher thickness than what you would find in a typical strong ET storm development near 37N in late September in this region off the U.S. East Coast. A 582 thickness pool is what you commonly see on the global models over a mature hurricane, so I would be cautious here as this is an outlier case and conventional rules of thumb may not apply. This is why I mentioned in an earlier post that one needs to think outside the box here. Yes, I know that this mid-level warm pool alone does not make it even close to a ST system currently, but you have to admit this is unusually warm for initial strong baroclinic development and a high launching pad, relativity speaking. Nothing quite like this (at least in the last 50 yr) has occurred in September in this particular region when a strong ET low develops during the near peak climo of SSTs that are 2-4 C above average and the low meanders for days in the same region close to the coast. I attached the SSTs analysis and the approximate position of the surface low at 25/18z. It is over SSTs more than enough to support ST transition and is going nowhere fast the next 72 hr off the Mid-Atlantic coast, so I would not let one's guard down here. The closest analog is the Perfect Storm Oct-Nov 1991 and the hurricane that formed from it eventually, so such a scenario here is not unprecedented. If I recall correctly, a recon was flown into that system when the transition had occured and they found a 981 pressure and 88 kt FL winds.
-
Good! So much rain in Weymouth, it will "drown out" @CoastalWx's constant boring whining nonsense! LOL
-
2026 Atlantic Hurricane Season
vortex95 replied to Stormchaserchuck1's topic in Tropical Headquarters
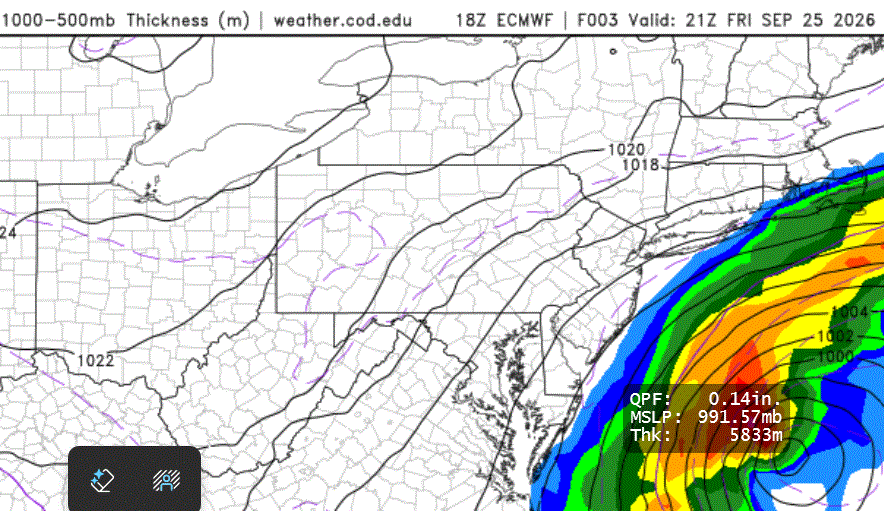
Concerning the East Coast storm, I wanted to point out something I can not recall seeing in this region in Sep. This is not your typical "cold" ET storm evolution. The initial surface low development was S of the 576 dm 1000-500 thickness line and by 25/18z, a small 582 closed thickness pool had formed over the low center (see ECMWF 12z 06 hr and 18z 03 hr forecast attached). This is a much higher thickness than what you would find in a typical strong ET storm development near 37N in late Se in this region off the U.S. East Coast. A 582 thickness pool is what you commonly see on the global models over a mature hurricane, so I would be cautious here as this is an outlier case and conventional rules of thumb may not apply. This is why I mentioned in an earlier post that one needs to think outside the box here. Yes, I know that this mid-level warm pool alone does not make it even close to a ST system currently, but you have to admit this is unusually warm for initial strong baroclinic development and a high launching pad, relativity speaking. Nothing quite like this (at least in the last 50 yr) has occurred in Sep in this particular region when a strong ET low develops during the near peak climo of SSTs that are 2-4 C above average and the low meanders for days in the same region close to the coast. I attached the SSTs analysis and the approximate position of the surface low at 25/18z. It is over SSTs more than enough to support ST transition and is going nowhere fast the next 72 hr off the Mid-Atlantic coast, so I would not let one's guard down here. The closest analog is the Perfect Storm ET low Oct-Nov 1991 and the hurricane that formed from it eventually, so such a scenario here is not unprecedented. A recon was flown into that system when the transition had occured and they found a 981 pressure and 88 kt FL winds.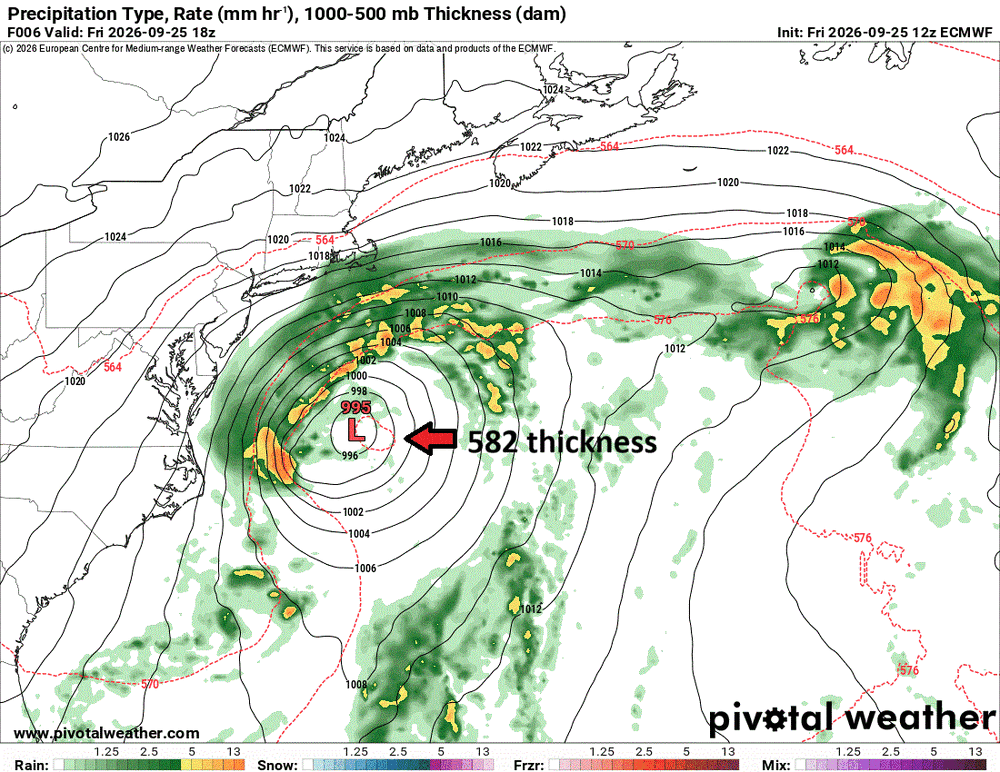
-
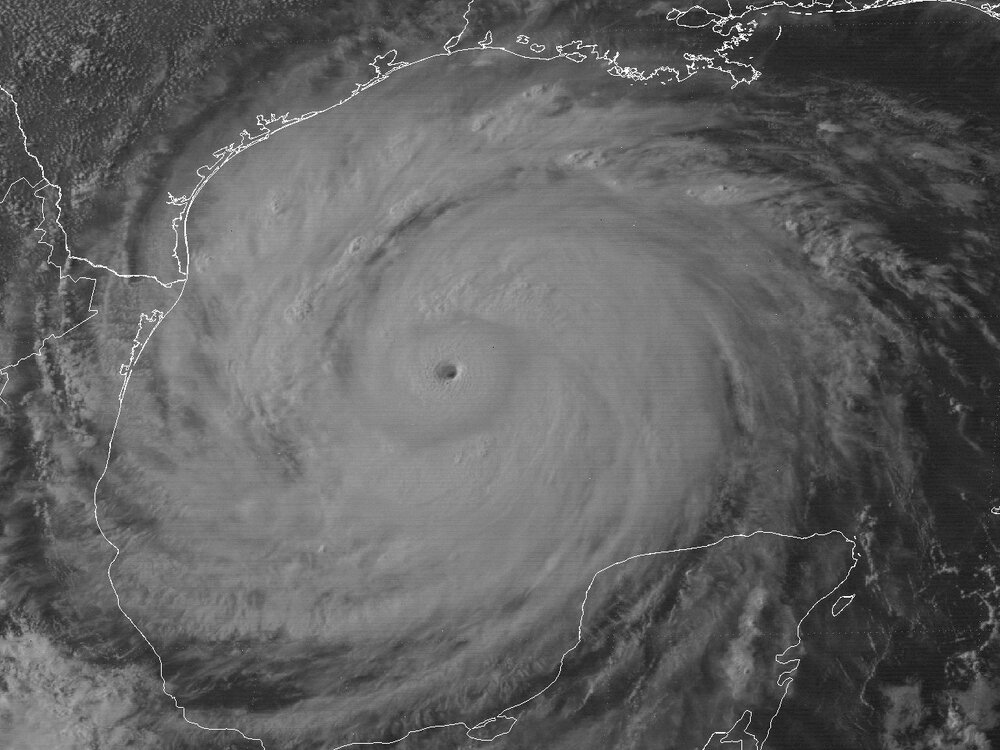
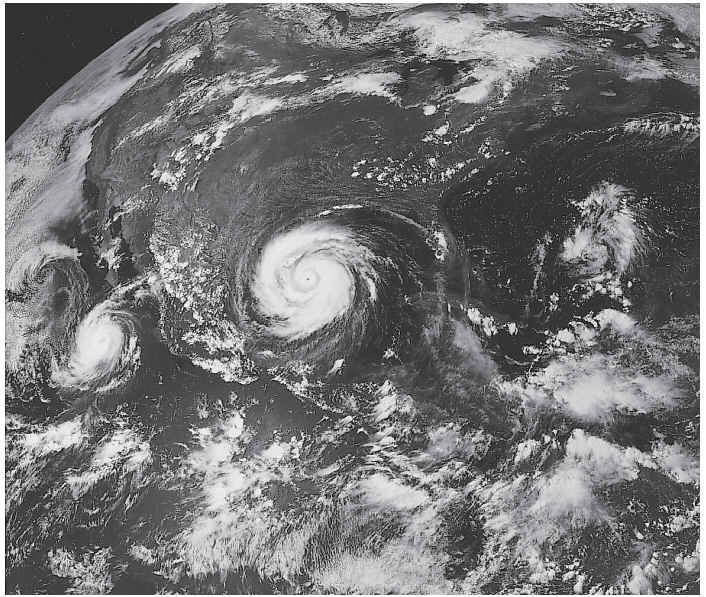
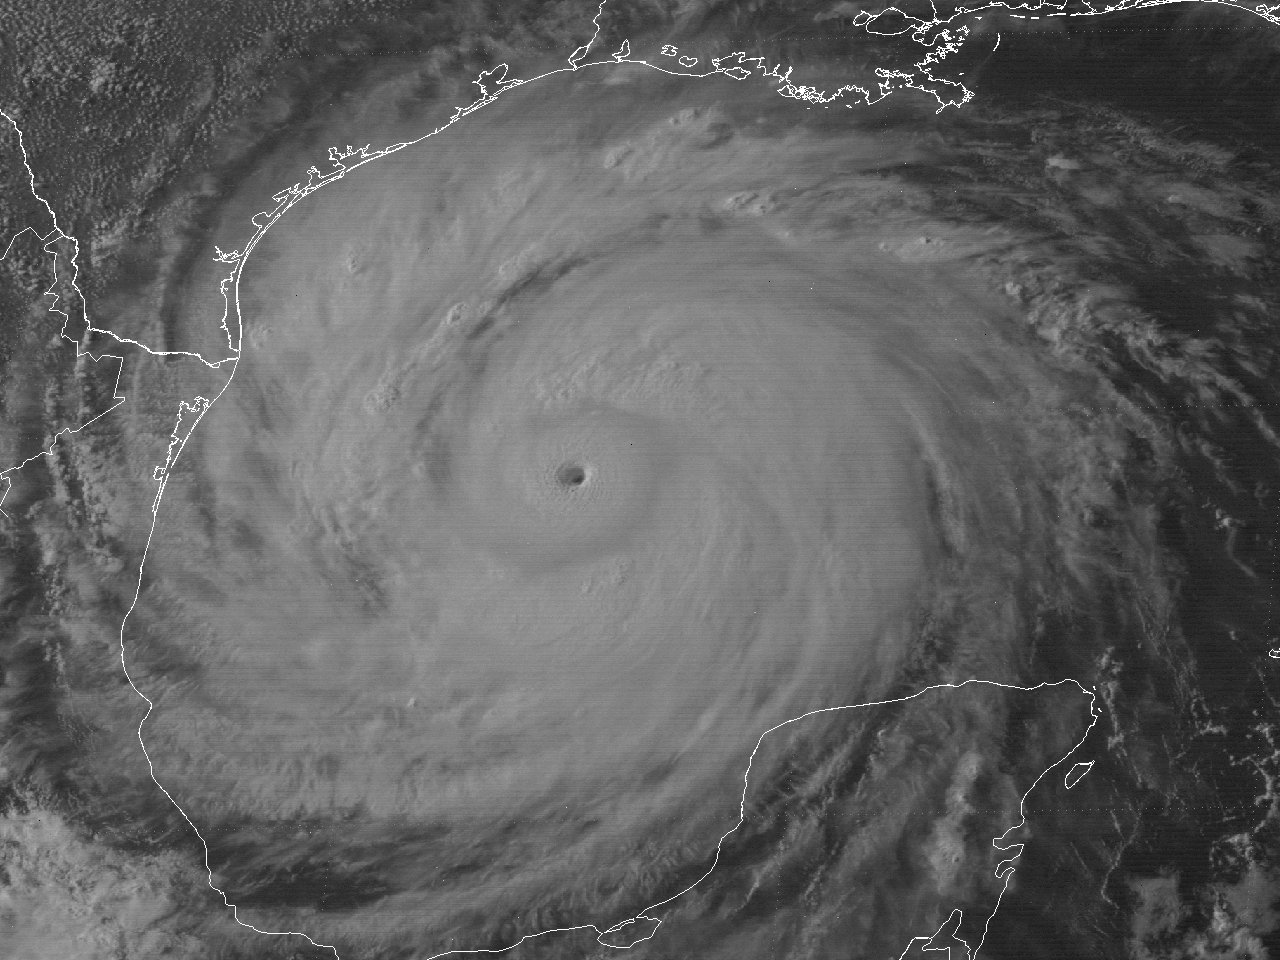
If anyone is wondering, has a HU ever been at Cat 5 strength 3 different times? Yes, Allen in Aug 1980 in the Atlantic. Classic Cabo Verde HU! Each time it peaked at Cat 5 (155, 165, 155 kt), it weakened in-between to a Cat 3. At the time, it was only the second Atlantic HU sub-900 mb (899). https://www.aoml.noaa.gov/hurricane_blog/35th-anniversary-of-hurricane-allen/ One of the most epic TC sat image ever -- see attachments (I recall being awed by this in college back in the day). Look at the size of it and perfect symmetry! Also, Ivan in 2004 in the Atlantic cycled up an down to Cat 5 3x. There may be 1 or 2 others in the Atlantic. I'm sure there are plenty of cases in the NWPAC given how that TC is for activity.