vortex95
-
Posts
1,488 -
Joined
Content Type
Profiles
Blogs
Forums
American Weather
Media Demo
Store
Gallery
Everything posted by vortex95
-
2026 Atlantic Hurricane Season
vortex95 replied to Stormchaserchuck1's topic in Tropical Headquarters
I don't know if the RRFS can handle TCs properly. This is a good question for the modelers. The NAM never was designed for TCs we know. The RRFS seems overdone, esp. given by 72 hr a strong deformation shear zone get established along the nrn Gulf Coast, and the system gets torn apart aloft. The HRRR through 48 hr does show it becoming a TD, but again, I am not sure how good mesoscale models not specifically designed for TCs, such as the HAFS and HWRF, do here. The 2m wind field looks choppy and pock-marked on the HRRR by 36 hr. The HWRF from 18z today shows sig development having is 992 mb by 60 hr, but that appears overdone. GFS/ECMWF suggest weak TD status before the environment becomes unfavorable. -
That is an exceptional amount of CAPE (nearly 6000) for a location on the East Coast. I am surprised there were not more svr hail reports. Low-level shear is weak. 0-6 km shear 37 kt so there is your supercell support. I think the storm coverage was a bit too much and that is what precluded more sig svr wx overall. A bit stronger capping probably would gone a long way.
- 1,481 replies
-
- 2
-

-
- severe
- thunderstorms
- (and 7 more)
-
You had this left mover (anticyclonic supercell) near Manassas earlier. You do not even have to look at the velocity to know this. The storm is deviating to the left of the mean flow and it has the flared NW to SE structure w/ the anvil streaming to the SE despite the storm moving NE! When storms rotate, it becomes complex as to the total motion vectors acting on the storm. Anticyclonic supercells rarely produce tors (in the NHEMI), but giant hail and microbursts are just as likely as w/ cyclonic supercells
- 1,481 replies
-
- 4
-
-
- severe
- thunderstorms
- (and 7 more)
-
More days than not when svr wx occurs and it is favorable for supercells, deep layer (0-6 km) shear is good/great, but low-level (0-1 km) is weak. So you can get intense supercells w/ a nasty mesocyclone at mid-levels, but no real signature for rotation or a TDS at low-levels, and thus no tors. I've seen storms like this before in the Plains, You'd think there would be at least be an organized wall cloud for such an intense mesocyclone aloft, but just ragged, disorganized scud. Yet the storm is dumping giant hail and has incredible structure! A rule of thumb I look at for a basic start for a decent tor day is winds at least 30 kt at 925 mb. That gets you your low-level speed shear, which is important. Next, is there any veering of the winds sfc to 850? Low-level directional shear is paramount, esp.for sig tors. Is there a warm front involved? We are taught the cold fronts are the big tstm producers, and they are, but some of best intense tornadic supercells are those that form on or very close to a warm front, and ride along it. Winds locally are backed at the sfc just ahead of a warm front, but veer quickly aloft, so localized shear/helicity can be much higher than the environmental shear/helicity. Typically in most supercells, the mesocyclone (lowest pressure), is at mid-levels, the if conditions are right, the low-levels can organize for solid rotation. The exception is for TC environments. Supercells are often very low-topped, (might not even be 15,000 ft!), and deep layer shear (0-6 km) is not that great, but low-level shear (0-1 km) is excellent, owing to the strongest winds in a TC often found 925 mb to just a few 100 ft above the sfc. So you can get tors in swarms (look at what the remains of Ivan did in VA in Sep 2004), but most are weak, even a higher percentage from their continental counterparts b/c you don't have much CAPE in a TC environment, so updraft acceleration typically can't support strong/intense tors.
- 1,481 replies
-
- 6
-
-

-
- severe
- thunderstorms
- (and 7 more)
-
And memorable is relative and location specific. Short distances when it comes to tstms can be huge. Ever happen to get a storm that just maxes out over your location w/ crazy CGs so close and relentless for like 5 min, and you are ducking for cover even indoors b/c the thunder so atypically loud and you are literally hearing electrical click/pops before or during every strike? And then after it is like, "whoa, best ever!" But is a very localized experience, esp. when it comes to close lightning strikes and how loud the thunder is. Still, when it happens, it is awesome! Gets the adrenaline pumping! I can never get enough of such experiences. Give me tons of LTG!
- 1,481 replies
-
- 2
-
-
- severe
- thunderstorms
- (and 7 more)
-
Storm coverage was better than fcst than either the HRRR or RRFS had ydy. Some supercell structures as well, but they had tough time sustaining for very long. Looking at the radar loop, things got messy very quickly w/ storms moving in various directions due to outflow and rotation, colliding w/ each other. This probably limited the svr wx b/c no one storm could sustain for long, so we got a lot of pulse svr storms, despite the decent wind shear and a lot of CAPE. Maybe if the smoke hung around thicker longer, that would have meant less storms, but any storm would have had a better chance to sustain and rotate? The balance when it comes to the mesoscale is tricky. Small differences can be huge as to storm mode, coverage, and severity, often you don't know it until it is happening. This unknown factor has it appeal. We are still "surprised" at times (June 5, 2024 being among the best recent example), and things can look exactly alike on paper for a setup on two days, but what actually happens as to sensible wx can be a lot different. You still get tstms and svr wx, but it goes far beyond that. Will the storms train/backbuild? How intense (frequency) will the CGs be? (that varies a lot it seems). Discrete cells, a SQLN, or clusters? And who exactly will get crushed? So localized in many cases!
- 1,481 replies
-
- 2
-
-
- severe
- thunderstorms
- (and 7 more)
-
I attached the VIS image at 1716z (13:15 EDT on the image is 1:15pm EDT, right?) Was this CG verified? Sometimes isolated strikes are misplotted when there is a lot of activity. No anvil overhead or close to Damascus, but +CGs has been known shoot out laterally up to 10 mi from a CB. And when a storm, esp. a supercell, has a thick anvil streaming well downwind (can be well over 100 mi when winds aloft are strong), you can get CGs out of the anvil 50+ miles away. Farthest I have seen reported and verified is 90 mi from the parent cell core out of the anvil (storm near Enid OK and strikes far NW OKC)!
- 1,481 replies
-
- 1
-
-
- severe
- thunderstorms
- (and 7 more)
-
Probably +CGs and the thunder was enhanced by the nocturnal inversion!
-
GFS MOS had 93-94 and it got to 93 at DCA. And the GFS does not have smoke integrated into it, so apparent the smoke was not a factor for heating. The Td got to 77 and DCA and IAD. You get more bang for you buck per deg for Td than T when it comes to increasing CAPE. There is a sig difference between say 72 Td and 77 since moisture increase is not linear, and it really goes up fast once in the 70s!
- 1,481 replies
-
- 3
-
-
-
- severe
- thunderstorms
- (and 7 more)
-
That's quite good for 12z, esp. the CAPE!
-
If you are confused, you are not alone. While I understand what SPC is trying to do here (quantify risk better), it not easy or always intuitive (probabilities and statistics are are tough subject for many, or kind of dry)! If mets and wx enthusiasts have problems figuring this out this, forget it as to the general public! It somewhat reminds me of interpreting the homograph, it not intuitive at first you have to spend time on what you are looking at and think in 3-D despite looking at a 2-D plot!
-
Good to know. Thanks!
- 1,481 replies
-
- 1
-
-
- severe
- thunderstorms
- (and 7 more)
-
Highest gust on record for the summer set in July 1996, correct? They had PL at the time IIRC. And I think this same storm system resulted in record flooding in Quebec.
-
Coldest I could find outside mtn location in New England is 47 at Fox Brook ME.
-
Recall during the Olympics in China, the smoke pollution was never called such? You would get official statements like, "it is mist" or "it is getting ready to rain."
-
I agree it is not as bad as 2018, but when you talking tenths of deg when it comes to exceeding records, it does matter, and the longer the period, the more this drift is a problem when talking avg temps. 1 F bias does not sound like much for a single day, but it is big over the course of a month, and keeps increasing the longer you go.
-
If it thick enough, it does. Put it this way on an ideal radiation cooling night, if there was a layer of thick smoke at 20,000 ft, do you really temps woild drops as low as if there was no smoke? Yes, the SW/LWIR physics are not the same as WV clouds, but it is still a cover, so to speak. Why did BOS only hit 90 on 7/14 when 97 was fcst?
-
Today it was DC's turn for thick smoke. VIS at KDCA got as low as 1.25 mi and VV restriction of only 200 ft! METAR KDCA 171252Z 00000KT 1 1/2SM FU VV020 28/17 A3007 RMK AO2 SLP183 T02780167" CoastalWx, remind you of doing TAFs for India? Every night, the VIS like clockwork would drops big time to 1/4 mi or less from smoke at so many airports, not from wildfires, but industrial pollution.
-
600 dm heights/ridges can and are misleading as to heat. It depends on many factors, like one's relative position to the ridge center/axis, overall moisture in and around the high pressure (not all high pressures are dry), mean wind direction, and how the surface pressure is set up/aligned and how strong it is, and time of year/location (land or ocean). And we do not live at 500 mb. And what you say above, a 600 dm ridge parked right over region is not ideal for max or record heat. Having its center located decent distance SW, S , or SE of a given location is best for an area like the East Coast. On 9/16/1989 at 00z, the Chatham MA (CHH) souring recorded a 609 dm height. That is record high for the Northeast, but there was no all-time record heat for Sep from that event on the East Coast. Aug 2, 1975 when New England has it hottest temp on record. The ridge center was to our W, and we had strong NW flow for subsidence warming. Highest 500 heights were our W. Many times when the ridge center is to the W, the downstream sfc high is strong and that promotes a cooler thickness column and onshore winds. In other words, it is not one-size-fits all, and using any one parameter or level to determine sensible wx at the sfc and how extreme it will be or not is not proper meteorology. For heat, one should be looking a lot more at the 1000-500 thickness, as that is much more correlated to temps at the sfc b/c it combines 500 heights w/ sfc pressure. Also, 850 temps, but even that has limits. Cloud cover? Precip? Lapse rates? Type of air mass? You can't treat individual parameters in a vacuum.
-
Good point. Yes, it does matter to an extent. But each site is different. The below sounds pedantic and getting into the weeds, but I have found an appreciation of the details working w/ numbers, calcuations, and statistics, their rules, and how it applies to the sciences. We know the history of BOS wx measuring issues -- temp, precip, and snowfall. So this is not an isolated or new issue. And then you have the base issue of ASOS temp considered ok as long as it is within +- 2 F. The point is marginal of error or uncertainty in measurement is rarely given in the mainstream. Output/results are often treated as absolute fact. This is not a good scientific practice. For example, If a number is known to be accurate to the ones place (whole number), expressing it with a decimal (like a tenth) introduces false precision. This implies you know the value more precisely than you actually do. So since ASOS is only reliable within +-2 F, see the problem here? And then you have individual site calibration issues at times independent of the sensor base accuracy. These wx sensors in the field are not high quality super precise like sensors used in a lab. And a larger issue not directly related to precision/accuracy, artificial heat sources are becoming more of an issue w/ time, both on a local and large scale where many of these climate locations are, so biased warm is not an unreasonable assumption a lot the time. Yes I know this complicates things, but if you are going to say that an avg temp over a long period of time is exceeded a previous record by tenths of a degree when you have issues like the above, we can't just ignore the limits of measurements and rules of what is precise/accurate. It gets worse when you see temps calculated out to the hundredths of a degree (global avg temp, as one example) That is two orders of magnitude above conventional sensor precision!
-
And this not far over the ME border in 1825? One of largest wildfires in NAMR history. https://en.wikipedia.org/wiki/1825_Miramichi_fire You go back far enough in recorded history, you see that massive events are not as unusual or atypical as they may seem.
-
2026 Atlantic Hurricane Season
vortex95 replied to Stormchaserchuck1's topic in Tropical Headquarters
Dang! That's quite a swirl, but largely at mid-levels. it looks like it is detaching itself from the main 500 low. We could see pinwheeling small LLCCs if the convection collapses completely. -
2026 Atlantic Hurricane Season
vortex95 replied to Stormchaserchuck1's topic in Tropical Headquarters
A good part of the FL PH could use the rain! -
I think thick smoke can go both ways. On Tue, big time svr wx (best SCP and SIGTOR parameters I have seen in a long time in the Northeast), was completely squashed during the daylight hours at least. Otherwise there would likely have been a sig tor event in srn Quebec and nrn New England. Temps were held down a lot. BOS fcst high as 97, and high was only 90. PWM fcst high was 93, and only got to 85. This resulted in CINH remaining stronger over the entire area. However, ydy we saw a nasty back-building tstm training event in cntrl NJ. Wind gusts as high as 84 mph at Surf City and they also had 4.37" of rain. CG LTG was incredibly dense in a narrow swath. And these storms fired directly within the thick plume of smoke. One can say w/ high confidence the smoke in the Northeast was the cause for the svr wx bust here, but for what happened in NJ ydy? Not as clear. That would be a good case study/research item, re-run models w/o the smoke, and see if intense tstms would have occurred to the degree they did! The models for tomorrow have smoke in their initialization, unlike what happened on Tue in the Northeast, so it is accounted for. I am not impressed w/ the 18z HRRR storm coverage tomorrow over the region. 18z RRFS is a little better, and shows an isolated honkin' supercell just N of DC, but the 45% area for wind seems high for the DMV area to me given the *coverage* of storms fcst. This is important. The colored SPC outlooks areas are for expected svr wx type coverage, they say nothing about how intense any individual svr wx may be (the hatched areas show that) So they should be solid svr storms, just the real question is coverage overall. The thick smoke may be a factor here, but how much in either direction? We go from weak anticyclonic flow aloft today to solid cyclonic flow tomorrow w/ a s/w coming thru. 500 heights come down as well. But the NAM shows 500 temps actually increase a bit in the aftn, up to -4 C (yuck!). The GFS tho shows slight cooling from -5 C tdy to -6 C tomorrow. Also, the mid-level lapse rates are not as bad as you would think for such warm 500 mb temps. Looking at the NAM and GFS, it shows lapse rates as high as 7 C/km on the fcst soundings (not using 700-500 exactly here, any thick layer at mid-levels will do). Fcst K-indices in the area gets as high as 40 on both the NAM and GFS, and that is impressive. Juiced column for big rains! NAM has PWATs are high as 2.8" which is likely overdone. GFS has it as high as 2.5" which is good for this model (not usually that high)! Anything over 2" is more than enough. Since DCAPE is fcst high and 0-3 km CAPE low, tor threat seems minimized. 0-6 km shear 35-40 kt, so enough for supercells.
- 1,481 replies
-
- 3
-
-
-
- severe
- thunderstorms
- (and 7 more)
-
2026 Atlantic Hurricane Season
vortex95 replied to Stormchaserchuck1's topic in Tropical Headquarters
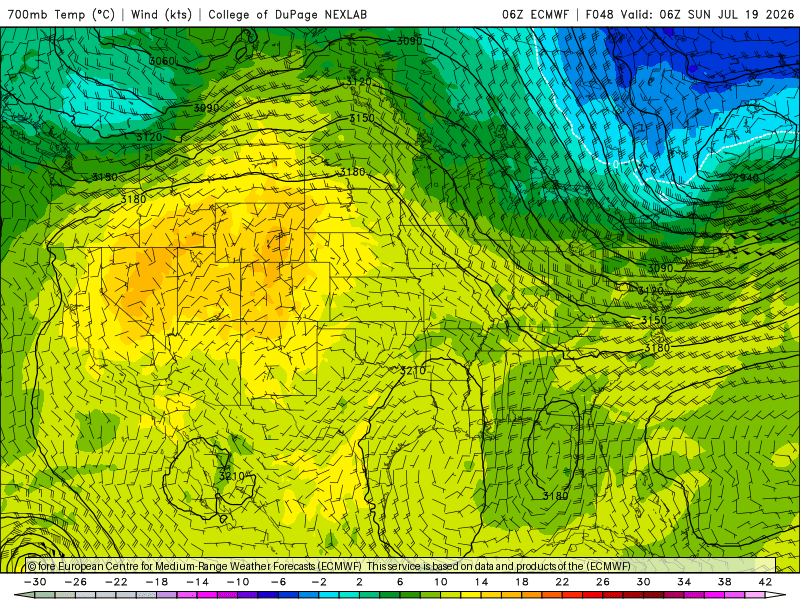
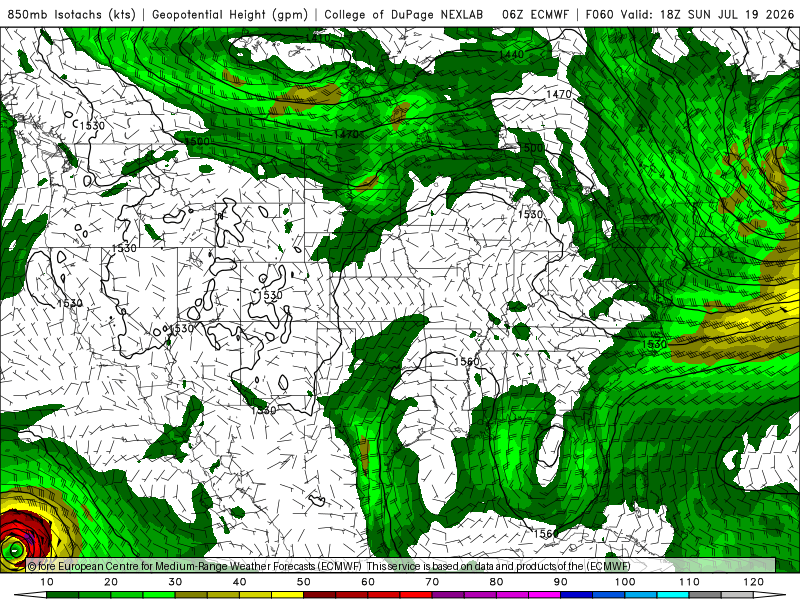
Looking at the ECMWF fcst, it remains cold core aloft for the next several days (see 700 temp 48 hr fcst attached), and at 850 elongated N-S w/ a broad wind field (see 850 winds 60 hr fcst attached). Not much sfc low reflection. I think they may be a case that aloft it is and will stay impressive w/ lots of deep convection/decent swirl, but low-levels struggle to organize. We've seen this before and it looks great on satellite, and some ppl are going, "I can't believe NHC has not declared this yet!" But sfc observations and microwave data show a low-level center ill-defined and/or not tight.