All Activity
- Past hour
-

Tropical Storm Erin - 45 mph - W @ 20
NorthHillsWx replied to BarryStantonGBP's topic in Tropical Headquarters
Let’s just add the entire western basin into the cone… -

Tropical Storm Erin - 45 mph - W @ 20
Torch Tiger replied to BarryStantonGBP's topic in Tropical Headquarters
In fairness, it was a pretty good hit for ACK. 90mph gust iirc -
I still think this very well could track west of Bermuda, especially given Erin is remaining weaker and continuing to track on the southern envelope on guidance which feasibly means tracking farther west prior to re-curving. But the end game is still going to re-curve and still far enough away from the EC for the only impact to be high surf. Maybe Cape Hatteras gets scrapped with cirrus. But all summer, we have seen some impressive shortwaves tracking across eastern Canada and getting across southeastern Canada at times. The ridge may be stronger, but if anything its stronger in the poleward direction versus being more of a E-W expansive high. There are a series of shortwaves which will be diving through over the next week which will continue impacting the WAR and allowing for weaknesses. Maybe this gets to 75W but even if so, the end game will be a sharp recurve.
-

New England 2025 Warm Season Banter
TheClimateChanger replied to bristolri_wx's topic in New England
Made it up to 100F at Dixfield, Maine yesterday (reported as today's high due to morning observation time). Several other locations in the State reached 99F. While falling well shy of the monthly state record of 104F, that was the 1st 100F high temperature observed in the State of Maine in the month of August since August 15, 2001, when it reached 101F at Livermore Falls 1 E. I believe that was also a morning observation, as the prior day had a high of 100F at Fryeburg, Maine. In fact, since the record heat wave of 1975, only one other date besides yesterday & the date(s) in 2002... on August 9, 2001, Fryeburg reached 100F. -
REALLY dry air, is also REALLY dense air...And that's also observed in a data sparse region so we might want to take the over on how strong that ridge is... Better bet due to both influences--weaker TC, and stronger high--you want to hedge strongly in favor of a track further west and south at least to the bahamas...
-
 6z EURO AI brings the hurricane decently close:
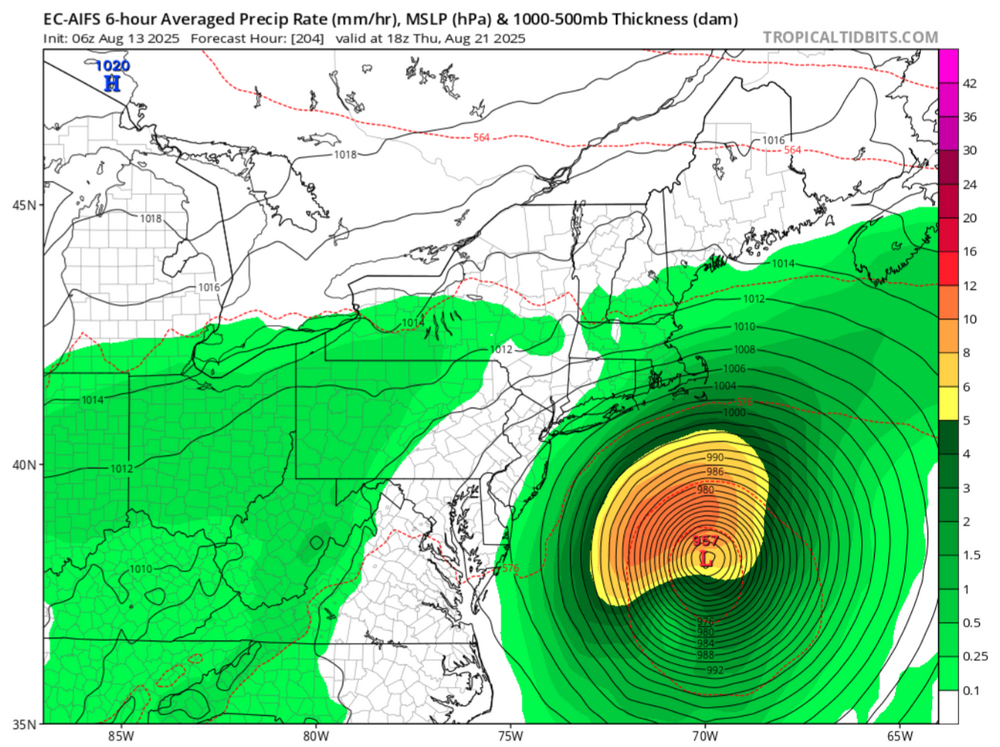
-
Seeing the NAO is shifting from postive to deeply negative over the next 7 days. Looks like trending towards an east-based -NAO... That will shake the forecast track up for sure...
-
Nipped this from the Mid Attlantic forum.
-
https://www.wpc.ncep.noaa.gov/metwatch/metwatch_mpd_multi.php?md=0925&yr=2025 Mesoscale Precipitation Discussion 0925 NWS Weather Prediction Center College Park MD 1025 AM EDT Wed Aug 13 2025 Areas affected...Portions of the Central Appalachians and Mid-Atlantic Concerning...Heavy rainfall...Flash flooding likely Valid 131425Z - 132025Z SUMMARY...Clusters of heavy showers and thunderstorms with locally extreme rainfall rates will tend to expand in coverage over the next several hours. Scattered areas of flash flooding will gradually become likely, and especially later this afternoon closer to the I-95 corridor of the Mid-Atlantic where an urban flash flood threat is expected to evolve. DISCUSSION...The latest satellite and radar imagery shows a band of heavy showers and thunderstorms moving into northern WV, and the latest trends show cooling cloud tops associated with this activity. This convection is associated with the southwest flank of mid-level vort energy going into the central Appalachians which is embedded within a very moist and moderately unstable environment. MLCAPE values across northern WV and western MD, and areas east of the Blue Ridge over the Mid-Atlantic, are locally on the order of 1000+ J/kg. However, the PWs are quite high and locally over 2 standard deviations above normal. In fact, the 12Z RAOB soundings from KPIT and KIAD showed PWs of 1.86 and 2.22 inches respectively with tall skinny CAPE profiles and elevated WBZ/freezing levels. This is strongly suggestive of a very efficient and tropical environment that will promote highly efficient processes for locally extreme rainfall rates that may reach well into the 2 to 3+ inch/hour range. Convection should tend to generally build in coverage over the next several hours as this vort energy advances off to the east across the central Appalachians and northern Mid-Atlantic region. This will support heavy showers and thunderstorms advancing east through central and northern WV, western MD and southwest PA in the near-term. However, as instability and convergent low-level flow becomes better established this afternoon east of the Blue Ridge and into the Chesapeake Bay region, there will likely be the development and expansion of very heavy showers and thunderstorms across much of northern VA, central to northeast MD and southern PA, including areas along the I-95 corridor from Washington D.C. to Philadelphia. The latest hires model guidance may be underplaying the rainfall potential given the level of moisture that is in place, and there will the influence of diurnal heating and orographics that will also support an uptick in coverage of showers and thunderstorms. Slow cell-motions and localized cell-training concerns coupled with locally extreme rainfall rates may support some localized rainfall totals of 3 to 5 inches. Areas of scattered flash flooding will become likely in time, and this will include an increasing urban flash flood threat near the I-95 corridor by later this afternoon. Orrison ATTN...WFO...AKQ...BGM...CTP...LWX...PBZ...PHI...RLX...RNK... ATTN...RFC...RHA...TIR...NWC...
-

2025-2026 ENSO
40/70 Benchmark replied to 40/70 Benchmark's topic in Weather Forecasting and Discussion
Yes, this is what I was referring to. -
Or the Amazon. The mosquitoes are awful
-
 The original idea of the heat this week coming in under June and July levels turned to be correct. This is what the models were originally showing before shifting to 102° heat in later runs. We haven’t had any 100° heat after August 13th since 1993. We also haven’t had 100° heat after August 10th since 2005. First/Last 100° Day Summary for NEWARK LIBERTY INTL AP, NJ Each section contains date and year of occurrence, value on that date. Click column heading to sort ascending, click again to sort descending. 1993 06-19 (1993) 102 09-03 (1993) 100 75 1953 06-21 (1953) 100 09-02 (1953) 105 72 1973 08-28 (1973) 100 08-28 (1973) 100 0 1948 08-26 (1948) 103 08-28 (1948) 102 1 2005 07-27 (2005) 101 08-13 (2005) 102 16 2002 07-04 (2002) 100 08-13 (2002) 100 39 1944 08-04 (1944) 100 08-13 (1944) 100 8 1949 07-03 (1949) 100 08-11 (1949) 102 38 2022 07-20 (2022) 100 08-09 (2022) 101 19 2001 08-07 (2001) 100 08-09 (2001) 105 1 2006 08-01 (2006) 100 08-03 (2006) 101 1 1955 07-05 (1955) 101 08-02 (1955) 100 27 2024 06-21 (2024) 100 08-01 (2024) 100 40
 -
looking for boston restaurant recommendations thx. seafood preferred
-
Not exactly... It's still a long shot but.... What you do need is for the longwave trough in eastern Canada to weaken...That's the "block" as it pertains to all of the east coast... On the euro AI all trends are in the right direction...weaker trough in eastern canada, stronger western atlantic ridge, and deeper shortwave over the Midwest.
-

Tropical Storm Erin - 45 mph - W @ 20
GaWx replied to BarryStantonGBP's topic in Tropical Headquarters
This will be a good test of Lezak and thus I feel it should be followed since you’ve been pushing him so hard. A potential positive thing I can say is that he may not be wishy washy. He said that a NC or SC hit is a likely target. I consider that an outright prediction even though he didn’t say it was a near certainty. Nothing can be a near certainty this far out. If it misses there and isn’t close, I’ll consider it a bust. If it were to hit there, I’d give him kudos for his prog. Edit: If it were to barely miss, I’d at least give him a pass. -
Congrats all. Late month continues to look coc’d:
-

Tropical Storm Erin - 45 mph - W @ 20
Diggiebot replied to BarryStantonGBP's topic in Tropical Headquarters
Same. I was 10. I went to bed at 4-5 pm so I could wake up when the storm hit in the overnight hours and not miss anything. When I woke up the news was saying how the storm took a last minute hard right….. -
 There are many variables that are involved. SSTAs could promote a tendency for ridging in various locations. Teleconnections could influence the positioning of such synoptic features. Rossby waves can also shape the development of the synoptic pattern.
 -
"Area to Monitor" thrown in there to get a few extra clicks. Love how it's placed on the Northeast..instead of Florida or the Gulf, which have more of a need to "monitor"
-
 83/75 today. very few thunderstorms this summer. Very boring weather overall
 -
I know that’s true…but my production the last decade makes it harder than ever to discern. I checked this morning and I have more sub 20” seasons than I do 30” seasons since 2018-19, and my average is 45-50”. I certainly have more failed epic winter patterns than failed fantasy canes. It’s exceptionally tough sledding for anything interesting lately. Tropical stuff aside I think most of us are frustrated by that. I have my annual peak season forecast due by the 20th, and I’m still not sure what direction I’ll take. I do think we’re looking at another backloaded season though given the continued SAL/stability issues I knew we’d have months ago. If September is warm with a WAR, we’re in the game. Otherwise, cutoff trough season in October and hybrids are probably our only shot at anything interesting.
-

Tropical Storm Erin - 45 mph - W @ 20
FPizz replied to BarryStantonGBP's topic in Tropical Headquarters
Can their cone could be a bit wider, lol -
lol
-
 I would be happy with anything honestly. So dry. Anything over 1/2" would be a gift.
 -

Tropical Storm Erin - 45 mph - W @ 20
BarryStantonGBP replied to BarryStantonGBP's topic in Tropical Headquarters
fat swells ahead for the EC innit lad