All Activity
- Past hour
-
 Forecasts for October will appear below. This post will eventually become annual scoring update (around 1st of October).
 -

September 2025 OBS-Discussion centered NYC subforum
SACRUS replied to wdrag's topic in New York City Metro
81 / 74 here more breaks of clouds and sun -
After a VERY foggy start here, sun poked out for about 45 minutes, immediately followed by a quick thundershower that dropped about a tenth in ten minutes or less. Currently a soupy/muggy 71.9/70.0 at 3:40 pm after a high of 75.8 an hour ago.
-

September 2025 OBS-Discussion centered NYC subforum
Sundog replied to wdrag's topic in New York City Metro
The EURO is a crap model, a real flip flopper -

September 2025 OBS-Discussion centered NYC subforum
WeatherGeek2025 replied to wdrag's topic in New York City Metro
i need rain for my bet lol -
That’s assuming this is the time we finally have the floodgates open after the Niña breaks instead of the dry pattern injecting steroids against all logic.
-
Drought monitor is starting to look pretty rough to the S and E of the forum. Widespread D1 with pockets of D2 and even an area of D3 (!) in OH and S IL.
-

2025-2026 ENSO
PhiEaglesfan712 replied to 40/70 Benchmark's topic in Weather Forecasting and Discussion
I won't be surprised if it verifies. Signature -ENSO/strong -IOD January has very warm anomoly. Here are my top analogs:
-
We'll have plenty of those this winter.
-

September 2025 OBS-Discussion centered NYC subforum
BobbyHolikWillFindYou replied to wdrag's topic in New York City Metro
Anybody heading to the Ryder Cup in LI tomorrow? Guessing it will be a muddy mess for the first half of the day. -
Yep, really getting its act together.
-

September 2025 OBS-Discussion centered NYC subforum
rclab replied to wdrag's topic in New York City Metro
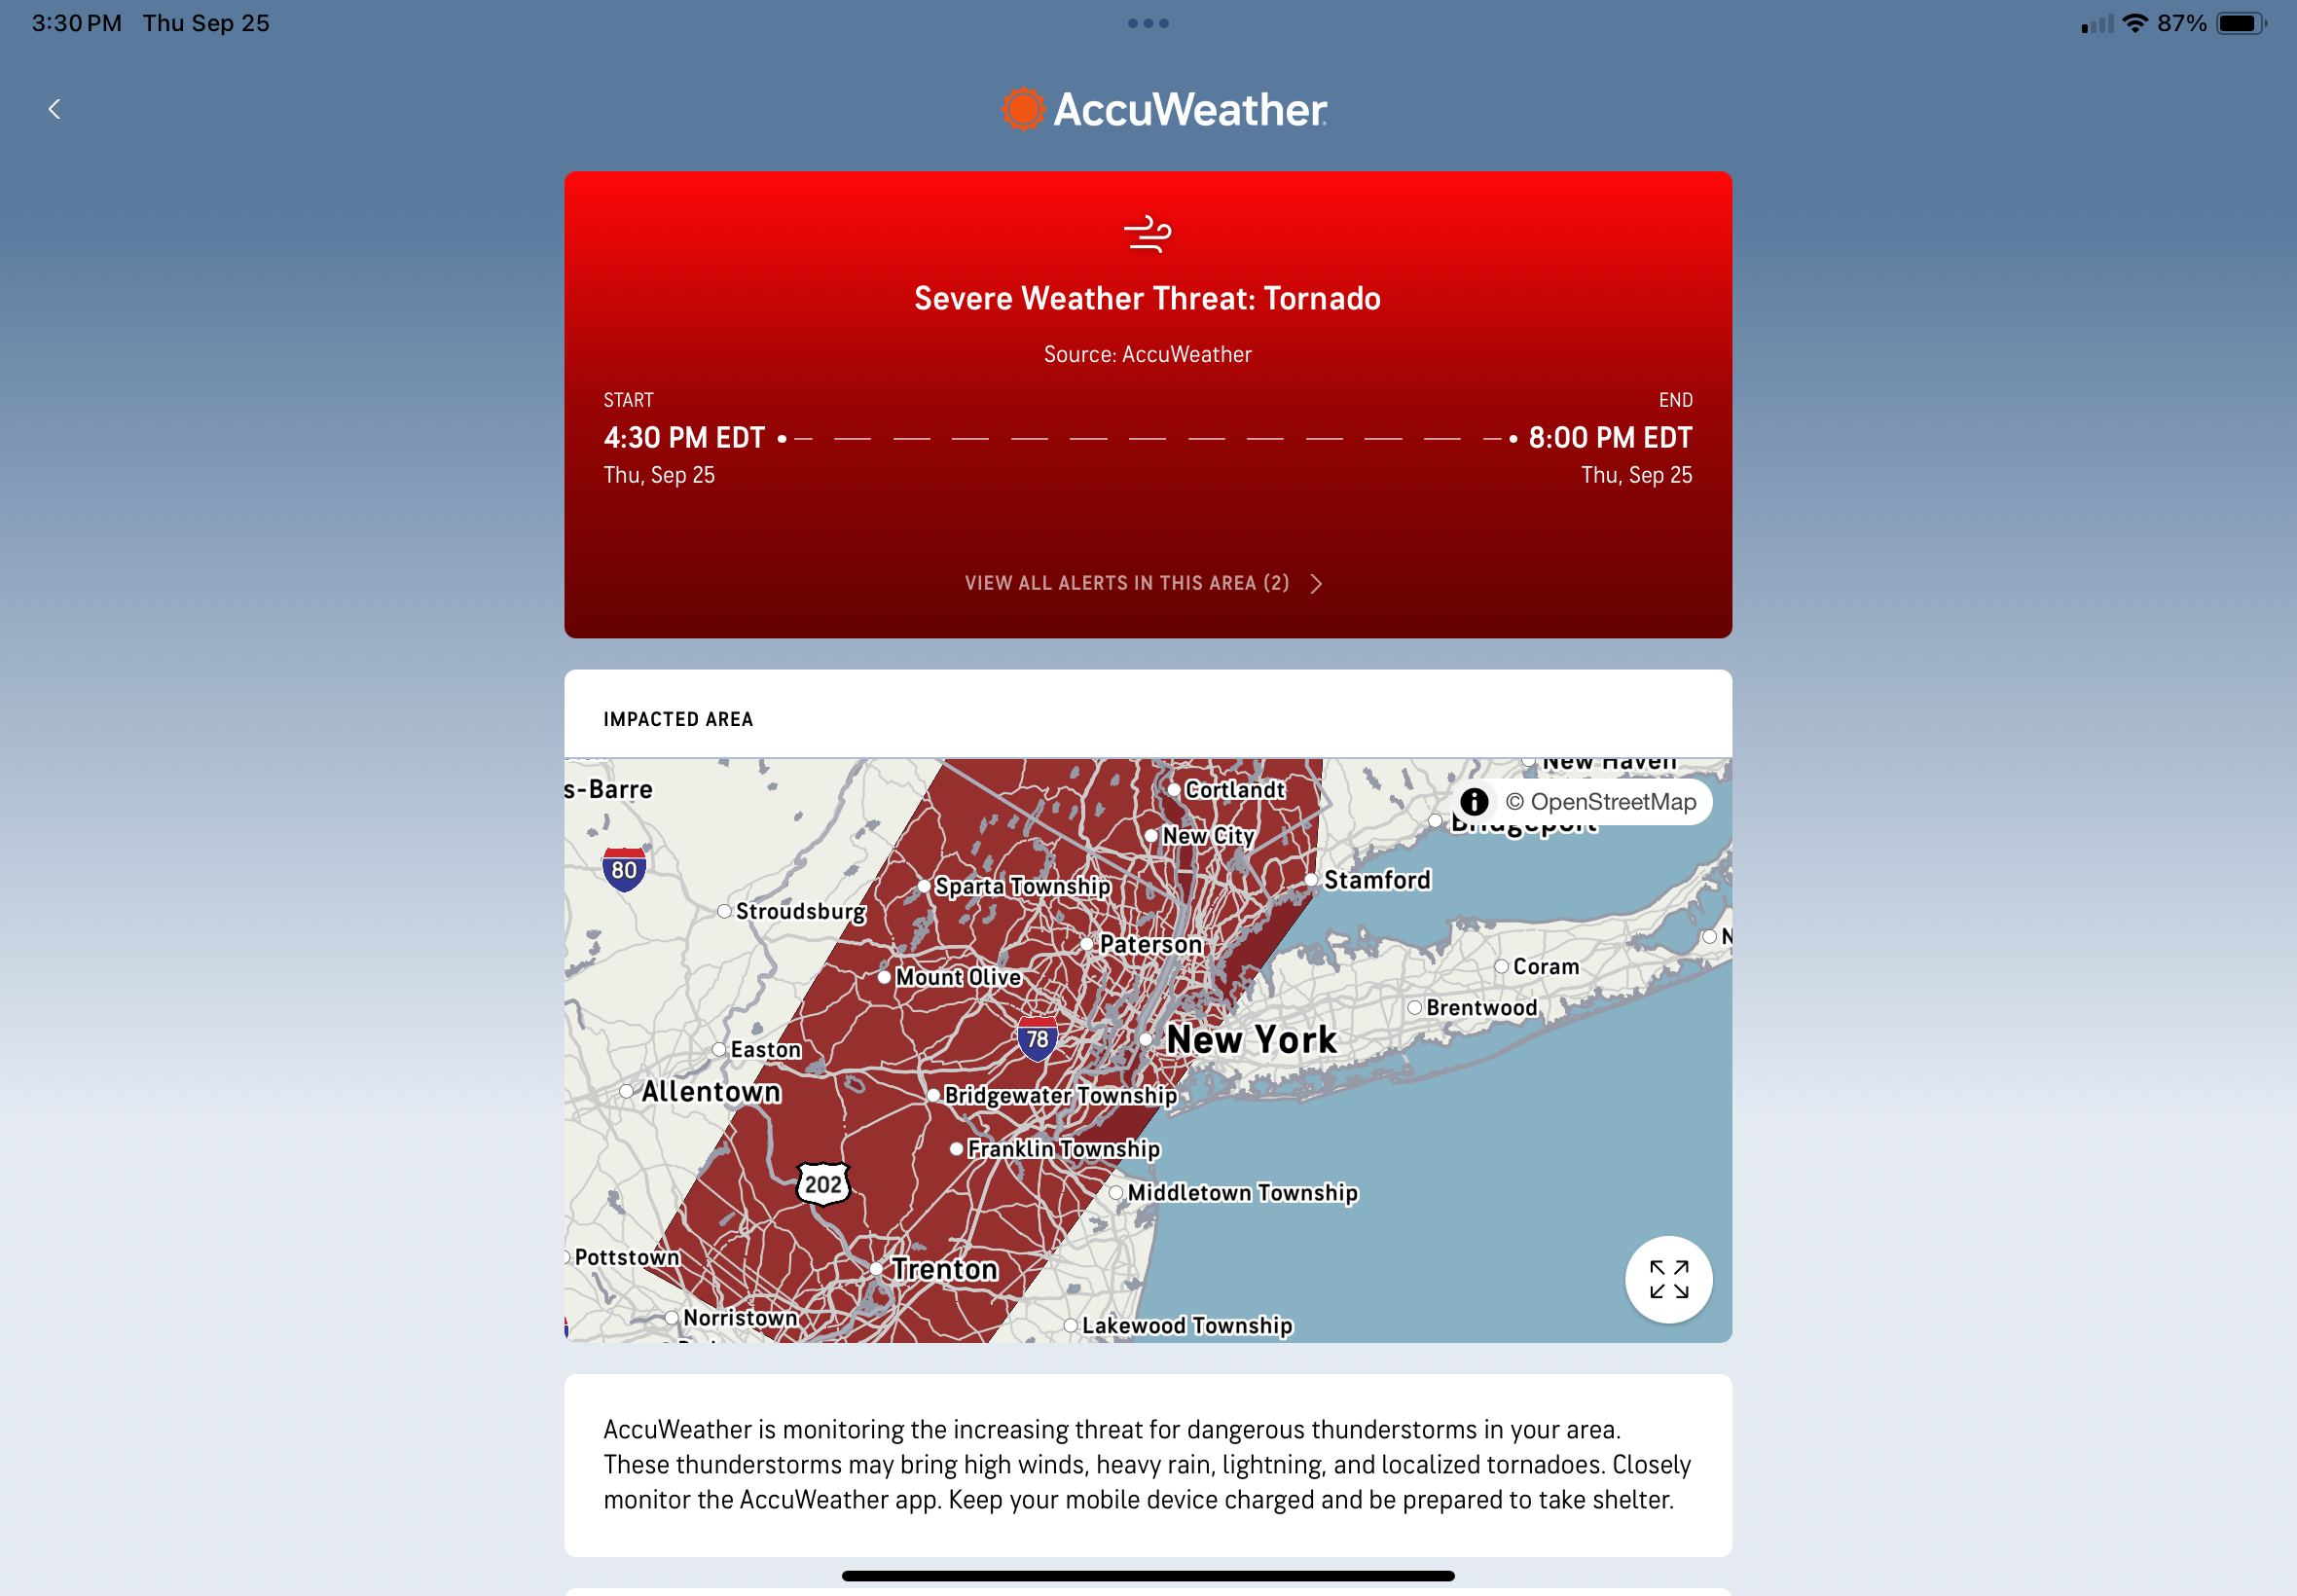
Accu weather apparently worried about early evening. As always …..
-
Looks like another big rain event for the MA goes bust. Is a widespread soaking rain with no “winners and losers” too much to ask?
-
One thing is 99.99969% certain; any red rotating blob is going to miss here, to Methuen and most likely Wilimington.
-
cfs is super volatile
-
Perhaps some, but it's still locally. Not denying there was a stein dent
-
 Yep, long way away but multiple models have Imelda or its remnants somewhere along the East Coast until like 10/10
 -

Invest 94L—80% 2 day and 90% seven day odds of development
wthrmn654 replied to WxWatcher007's topic in Tropical Headquarters
And possibly bring threats further north depending how long it stalls. -
.40" here and just over an inch since Sunday. It doesn't banish Stein but its nice to have.
-
Here it comes: https://weather.cod.edu/satrad/nexrad/?parms=CCX-N0B-1-24-100-usa-rad
-

Invest 94L—80% 2 day and 90% seven day odds of development
GaWx replied to WxWatcher007's topic in Tropical Headquarters
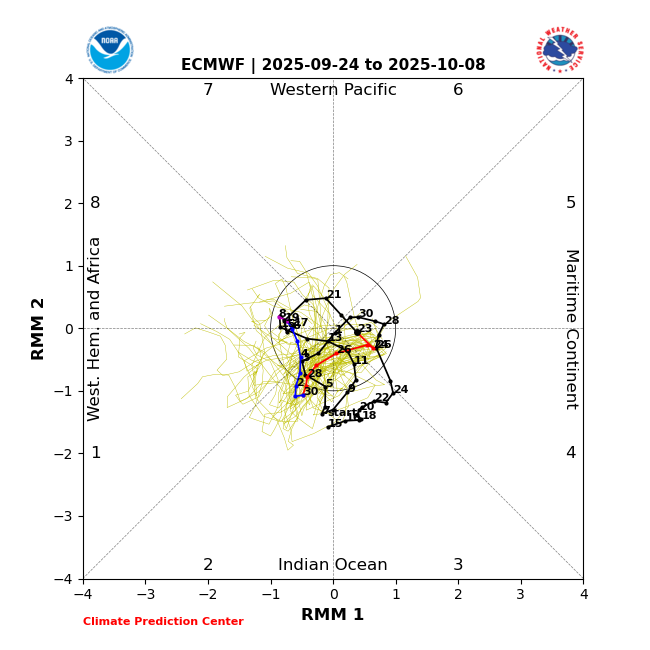
The MJO for 9/27 through 10/3 or 10/4 is again being forecasted by GEFS and EPS to be in phase 2, which is about tied for the most dangerous phase along with 8 for Conus H landfalls and by a large margin has been the most dangerous for Conus MH landfalls (inside or outside the circle). MH Conus landfalls since 1974 during phase 2 -Ida (2021) -Michael (2018) -Irma (2017) -Harvey (2017) -Ivan (2004) -Bret (1999) -Emily (1993) -Hugo (1989) -Frederic (1979) -Eloise (1975) -Carmen (1974) That’s 11 of 29 (38%) of all Conus MH hits since 1974 just during phase 2. These were all during Jul-Oct. During Jul-Oct 1974-2024, 16% of days were in phase 2. So, even after taking into account the fact that the # of days in phase 2 has been about the largest of any one phase along with phase 1, the 38% of all MH hits is still very high. If phase 2 were instead a neutral influence, one would expect the # of MH hits during phase 2 to be only ~3-5. GEFS EPS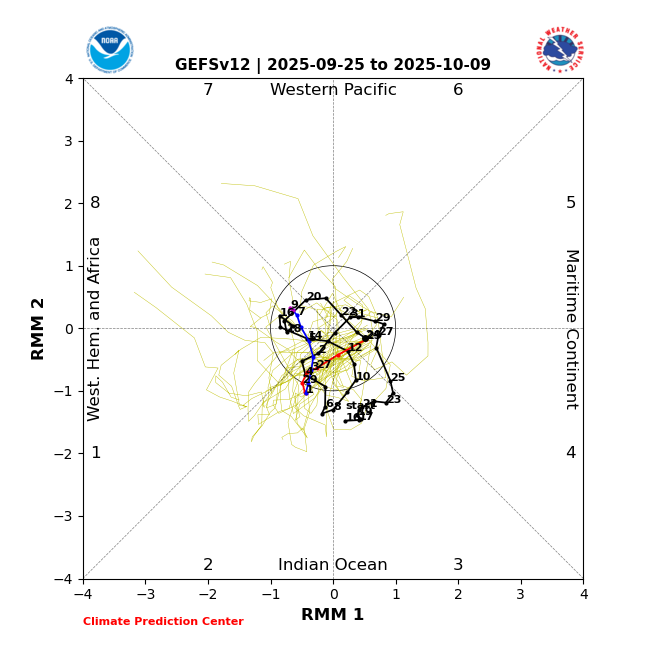
-
Hi all, Reposting Alfredo's bulletin here, "Good afternoon, With apologies for the delay, we are pleased to share the Maryland Climate Bulletin for August 2025, which includes sea surface temperatures for the Chesapeake Bay and the state's coastal waters. You can access the Bulletin from the following link: https://mdsco.umd.edu/Bulletin/bulletin_mdsco_current.pdf Points to highlight are: 1) Statewide averages indicate that August 2025 was colder and drier than normal (i.e., 1991-2020 averages). The statewide temperature was colder than normal (3.0°F below), after warmer-than-normal June and July, for the second time since January. Statewide precipitation was below normal (2.52 inches deficit) in August, following a wetter-than-normal July and a drier-than-normal June. 2) The mean temperature was colder than normal over all the state, particularly over Caroline and Dorchester counties (3.6 to 3.9°F below), and counties in the central Piedmont and coastal plains (3.0 to 3.3°F below). Precipitation was below normal all over the state after the below normal precipitation, particularly from the southern halves of Prince George’s and Anne Arundel counties to Charles, Calvert, and Saint Mary’s counties (3.0 to 3.6 inches deficit), Caroline, Talbot, Dorchester, and western Wicomico counties (3.0 to 3.3 inches deficit), and western Piedmont (2.4 to 2.7 inches deficit). The first of these regions, over the southwestern coastal plain, received between 20 and 30% of its climatological rainfall for the month, while the other two regions, over the Eastern Shore and western Piedmont, got 30 to 40% of theirs. 3) Drought conditions returned to the state in August, with around 70% of the state experiencing Abnormally Dry conditions. Drought-free conditions were present only over Cecil, Harford, Dorchester, and portions of Queen Anne’s, Talbot, Wicomico, Worcester, Allegany, and Garrett counties. Abnormally Dry conditions can be a precursor to drought if rainfall continues to be below normal. The majority of streams and rivers had normal streamflow throughout the state, with a few already showing below-normal streamflow in western Maryland, the central Piedmont, and the southeastern Eastern Shore 4) Statewide maximum daily temperatures from January 1 to August 31, 2025, indicated that the number of days with extreme temperatures has been less than normal. On the other hand, statewide minimum daily temperatures showed that the number of days with extreme temperatures has been larger than normal. There was one less hot day (maximum temperatures larger than 86°F) than normal (43 vs. 44), but one more heatwave than normal (9 vs. 8). There were thirteen more warm nights (minimum temperature larger than 68°F) than normal (38 vs. 25), and a normal number of warm night spells (5) by the end of August. 5) Statewide daily total precipitation from January 1 to August 31 showed a normal number of days with extreme precipitation (12; at least 0.64 inches; the 95th percentile in 1951−2000), with the last one occurring on August 1. The number of dry spells (two or more consecutive days with daily precipitation of no more than 0.04 inches) was fewer than normal by five spells (28 vs. 33), with three of them occurring in August. 6) The cumulative calendar year (January 1 to August 31) modified growing degree days (base 86/50°F) reached 3219°FDD by the end of August and have been greater than normal since the second week of March, with a departure above normal of 190°FDD. The curve of the cumulative modified growing degree days in the summer months was very similar to that of last year and is among the most extreme on record since 1951. 7) Statewide mean, maximum, and minimum temperatures (71.8, 81.6, 62.0°F) indicated that August 2025 was the twenty-fifth, nineteenth, and thirty-seventh coldest August since 1895, respectively. Three counties experienced maximum temperatures among the ten coldest on record: Calvert had its eighth coldest, while Dorchester and Saint Mary’s had their ninth coldest 8) Statewide precipitation (1.66 inches) showed that August 2025 was the seventh driest August since 1895. Thirteen counties had rainfall within the ten driest, and nine of them within the five driest on record: Carroll and Frederick counties had their driest August; Charles had its second driest, Saint Mary’s had its third driest, Calvert had its fourth driest, while Anne Arundel, Garrett, Montgomery, and Prince George’s had their fifth driest. 9) Sea surface temperatures in the Chesapeake Bay in August 2025 were below their 2007-2020 mean. The coldest anomalies were found in the southeastern Lower Bay, including the Tangier Sound waters along the coasts of Somerset, Wicomico, and Dorchester counties, as well as in the narrow strip of water in front of Worcester County’s Sinepuxent Bay (1.8‒2.7°F below). The current all-basin mean temperature of 79.5°F was far from the coldest August temperature in the 19-year data set (2007-2025), which was 77.8°F in 2013. Please refer to the bulletin for more details, including information on century-long trends and links of interest. The bulletin is issued once per month and shows the state's recent monthly surface temperature and precipitation conditions in a simple format, helping Marylanders better understand regional climate variations. This bulletin is possible thanks to the hard work and data made available by our friends at NOAA National Centers for Environmental Information, CoastWatch East Coast Node, the Institutions involved in the U.S. Drought Monitor, and the U.S. Geological Survey's Water Watch. Please help disseminate this bulletin. .................. Alfredo Ruiz-Barradas, PhD Associate Research Professor Maryland State ClimatologistDepartment of Atmospheric and Oceanic Science
-

E PA/NJ/DE Autumn 2025 Obs/Discussion
LVblizzard replied to PhiEaglesfan712's topic in Philadelphia Region
Hmmm, a bit of sunshine starting to break out here with the line of storms still west of Harrisburg. Hopefully this can destabilize the atmosphere enough for something good. -
Mmmm, gyros.
-
.55 for the event. Should about do it . Kind of a stein but after wet summer that’s ok