All Activity
- Past hour
-
That video isn’t from this year. I think it was actually on the Corrotoman River on July 4th, 2022.
-
August 3 1896: A violent hailstorm destroys two thirds of the crops in Swift County. For Monday, August 3, 2026 1885 - A tornado hit Philadelphia and Camden along its eight mile path. (David Ludlum) 1970 - Hurricane Celia struck the coast of Texas producing wind gusts to 161 mph at Corpus Christi, and estimated wind gusts of 180 mph at Arkansas Pass. The hurricane was the most destructive of record along the Texas coast causing 454 million dollars damage, and also claimed eleven lives. (David Ludlum) (The Weather Channel) 1987 - A severe thunderstorm moved across Cheyenne, WY, during the mid afternoon. The thunderstorm produced hailstones up to two inches in diameter causing more than 37 million dollars damage. The eastern U.S. sweltered in the heat. A dozen cities reported record high temperatures for the date, including Paducah KY with a reading of 102 degrees. Beckley WV established an all- time record with an afternoon high of 93 degrees. (Storm Data) (The National Weather Summary) 1988 - Thunderstorms developing ahead of a slow moving cold front produced severe weather from the Central High Plains to the Upper Great Lakes Region. Thunderstorms around Fort Collins, CO, produced wind gusts to 74 mph along with marble size hail. Sixteen persons were injured in the storm, most of whom were accidently locked out of their office building, having evacuated it when the fire alarm went off, apparently triggered by lightning. (Storm Data) (The National Weather Summary) 1989 - Thunderstorms representing what remained of Hurricane Chantal drenched Wichita, KS, with 2.20 inches of rain in four hours during the early morning. Thunderstorms developing in Minnesota produced wind gusts to 85 mph at Baudette during the afternoon, and softball size hail at Lake Kabetogama, during the evening. Jamestown, ND, reported a record hot afternoon high of 103 degrees. (Storm Data) (The National Weather Summary) Observances: 3 Mon National Watermelon Day 3 Mon Big Forehead Day 3 Mon Clean Your Floors Day 3 Mon Cloves Syndrome Awareness Day 3 Mon National Grab Some Nuts Day
-

2026-2027 Super El Nino
csnavywx replied to Stormchaserchuck1's topic in Weather Forecasting and Discussion
Twitter feeds some of these folks to me too (I assume algorithmic engagement bait doing its thing), but yeah, agree that most of them are hobbyists. That said it's not totally hopeless if the forcing moves far enough east to sneak in some stuff late in the season. And we're kind of in a n=1 space if it comes to say, the warm pool making it to 120W (instead of 160-140W, heck it's *already* at 160). -
have yet to water the lawn this spring/summer
-

Augdewst 2026: Summer's Last Stand
CoastalWx replied to Prismshine Productions's topic in New England
I guess this is good for the lawn fert. -
Augdewst 2026: Summer's Last Stand
CoastalWx replied to Prismshine Productions's topic in New England
Into RI and the Cape. Today they ride he outflow from earlier convection. Stein exhaust here. -

Central PA Summer 2026 Discussion/Obs Thread
Itstrainingtime replied to Voyager's topic in Upstate New York/Pennsylvania
Yep - I've had less than 3" of rain since June. This map is typical it seems for the past 6 weeks or so: -
I’m not sure it can get any greener
-

Central PA Summer 2026 Discussion/Obs Thread
canderson replied to Voyager's topic in Upstate New York/Pennsylvania
I’m 10000% ready for fall -
Augdewst 2026: Summer's Last Stand
CT Valley Snowman replied to Prismshine Productions's topic in New England
That's a problematic looking rain train from from Providence down to Old Saybrook. -
grass will be more green after this
-
Everything is green...including the crickets in my basement. Could do without them honestly.
-

Augdewst 2026: Summer's Last Stand
Damage In Tolland replied to Prismshine Productions's topic in New England
Every scout in water . Ginx there ? -
.thumb.gif.f92b16c631a1d15d405ed77b33f0710d.gif)
Augdewst 2026: Summer's Last Stand
Torch Tiger replied to Prismshine Productions's topic in New England
double-digit amounts? -
Classic El Niño summer. Everything is lush and green.
-

Augdewst 2026: Summer's Last Stand
OrangeCTWX replied to Prismshine Productions's topic in New England
Have a friend in Old Lyme who is at 3.50 inches with plenty more to come it looks like. -
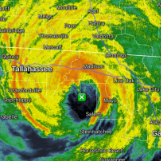
Radar looks like a benchmark snowstorm.
-
 click here for details ordering your supply from abroad https://clients1.google.com.eg/url?q=https://mexicorxnews.online ordering your supply from abroad [url=https://clients1.google.dj/url?q=https://mexicorxnews.online]overseas alternatives[/url] MexiMedsExpress website
 -
Don’t laugh, I drive by there all the time on Rt 138; was gonna take a pic to post. Deluge currently in n Cranston
-

Augdewst 2026: Summer's Last Stand
nutmegfriar replied to Prismshine Productions's topic in New England
I hear the train a-comin, it's rollin' round the bend. Yikes, it's been a deluge at and near the mouth of the CT River. -
Augdewst 2026: Summer's Last Stand
WxWatcher007 replied to Prismshine Productions's topic in New England
Southern CT year. Big snows. Big rains. -
Augdewst 2026: Summer's Last Stand
CoastalWx replied to Prismshine Productions's topic in New England
South coast summer -
Augdewst 2026: Summer's Last Stand
CT Valley Snowman replied to Prismshine Productions's topic in New England
Wouldn't be shocked if some of us in the interior west of the heavy rain axis pick up like .5 to 1.5" in afternoon convection. -

Augdewst 2026: Summer's Last Stand
jlauderdal replied to Prismshine Productions's topic in New England
Squall line west of albany looks promising -
Hope we can see some clearing / sun after this line of storms /rain moves through.