All Activity
- Past hour
-

July 2025 Discussion-OBS - seasonable summer variability
LibertyBell replied to wdrag's topic in New York City Metro
The usual suspects are in the top 20, the summers I always talk about lol 1. 1966 June 20 to July 20 ___________91.97 2. 1993 July 5 to Aug 4 ______________91.61 3. 1999 July 3 or 4 to Aug 2 or 3 ____ 90.94 4. 1955 July 8 to Aug 7 ______________ 90.90 5. 1944 July 22 to Aug 21 ___________ 90.84 6. 1980 July 14 to Aug 13 ____________ 90.71 t7. 1988A July 16 to Aug 15 ___________ 90.29 t7. 2010 June 27 to July 27 __________ 90.29 (or July 3 to Aug 2 was also 90.29) 9. 2005 July 15 to Aug 14 ___________ 89.87 10. 2011 July 4 to Aug 3 _____________ 89.84 11. 1983 July 11 to Aug 10 ____________ 89.71 12. 1952 June 24 to July 24 _________ 89.35 t13. 1977 July 13 to Aug 12 ___________ 89.29 t13. 1995 July 13 to Aug 12 ___________ 89.29 t15. 1876 June 23 to July 23 __________ 89.26 t15. 1991 June 24 to July 24 __________ 89.26 t15. 2006 July 11 to Aug 10 ____________89.26 18. 1949 July 13 to Aug 12 ____________ 89.13 __ a non-overlapping 31d interval June 11 to July 11 was 86.74 19. 1953 June 20 to July 20 __________ 88.90 __ non-overlapping 31d intervals Aug 8 (or 10) to Sep 7 (or 9) 87.00 20. 2002 Jul 20 or 22 to Aug 19 or 21_ 88.87 __ non-overlapping 31d interval June 20 or 21 to July 20 or 21 was 87.10 -

July 2025 Discussion-OBS - seasonable summer variability
psv88 replied to wdrag's topic in New York City Metro
61. Beautiful morning -

July 2025 Discussion-OBS - seasonable summer variability
FPizz replied to wdrag's topic in New York City Metro
56 this morning -
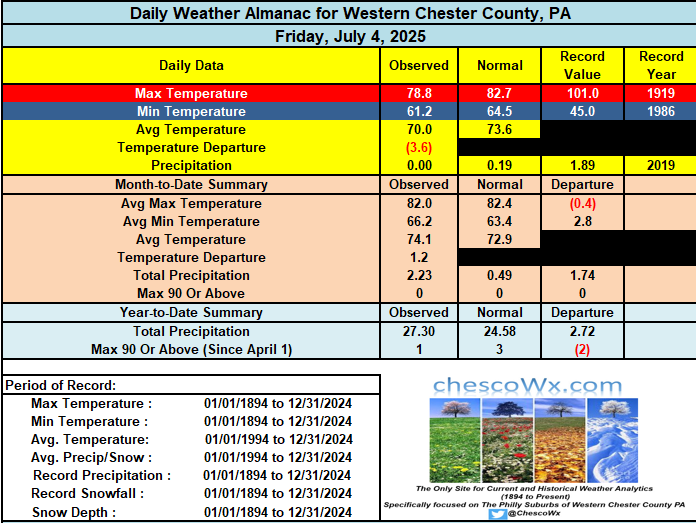
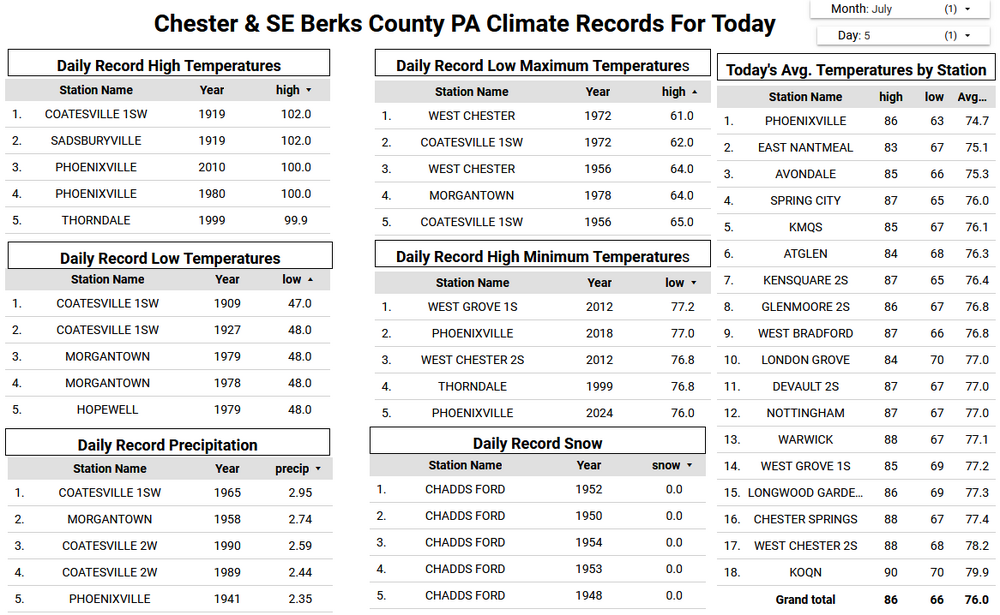
Some of the higher spots in the County like West Grove and East Nantmeal Township had highs remaining in the upper 70’s – most other spots hit the low 80’s. Plenty of cool and comfortable 50’s overnight with Warwick Township being the coolest spot with a low down to 55.3 degrees. Another beautiful couple of days producing temperatures warming to the mid 80’s today and maybe some upper 80’s tomorrow especially across valley locations. Rain chances increase by Monday night with the best chance by Tuesday.
-

E PA/NJ/DE Summer 2025 Obs/Discussion
ChescoWx replied to Hurricane Agnes's topic in Philadelphia Region
Some of the higher spots in the County like West Grove and East Nantmeal Township had highs remaining in the upper 70’s – most other spots hit the low 80’s. Plenty of cool and comfortable 50’s overnight with Warwick Township being the coolest spot with a low down to 55.3 degrees. Another beautiful couple of days producing temperatures warming to the mid 80’s today and maybe some upper 80’s tomorrow especially across valley locations. Rain chances increase by Monday night with the best chance by Tuesday.
-
Remember. The Euro is giving us 3 month averages on each forecast map, so keep that in mind when looking at the forecasts. The trend is what you need to consider as well as actual numbers.
-
Several buoys just east of Charleston are now measuring gusts around 40 kts on the west side of the circulation. With strongest winds on east side it may be a little stronger than 35 kts already
-

July 2025 Discussion-OBS - seasonable summer variability
bluewave replied to wdrag's topic in New York City Metro
The Euro brings in Chantal’s remnants Monday into Tuesday. 2.00-2.50 PWATS and mid 70s dewpoints for heavy rain potential. Will probably have to within the SPC HREF range to guess the peak amounts.


-
There were numerous warnings well ahead of the river overflowing
-
-

July 2025 Discussion-OBS - seasonable summer variability
Sundog replied to wdrag's topic in New York City Metro
All they have to do is chop back enough to where the shadows don't fall on the station post leaf out. The station right now has basically no clearance around it: I have no hope that it will ever have 100 feet of clear land around it, but at least cut back enough to where the shadows aren't all over the station.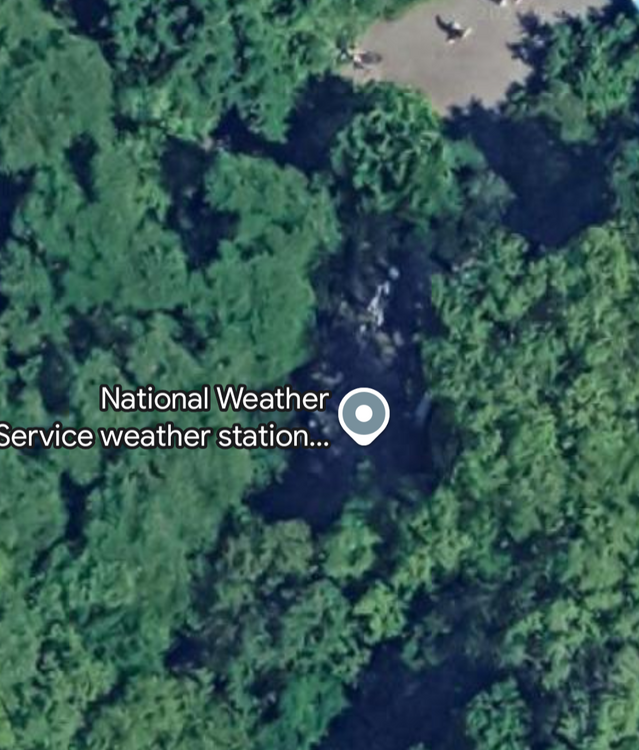
-
That is terrible. I don’t want to jump to conclusions, but am wondering if recent noaa and NWS cuts caused decrease warning times. eta… @StormyClearweather posted that at the same time as my post.
-
Sigh. https://bsky.app/profile/nycsouthpaw.bsky.social/post/3lt7r2mjlrc25
-

July 2025 Discussion-OBS - seasonable summer variability
TriPol replied to wdrag's topic in New York City Metro
Chantal is looking interesting for Monday/Tuesday. Very interesting. - Today
-
None of our current teleconnection indices accurately capture the changes we have seen in the North Pacific since 2018-2019 that I have highlighted in my previous posts. The record ridge near the Aleutians and to the east of Japan and attendant shift north in the storm track doesn’t fit neatly into either the Western Pacific oscillation of the North Pacific oscillation. Same goes for the record SSTs across the mid-latitudes of the North Pacific and Atlantic and subtropical ridge expansion. This is why the snowfall outcome was the same last winter with the strong -WPO interval in February as it had been with prior +WPO intervals. Both outcomes featured very strong Southeast Ridge patterns.
-

July 2025 Obs/Disco ... possible historic month for heat
RUNNAWAYICEBERG replied to Typhoon Tip's topic in New England
Morning coc is the best coc…enjoy. -
Remember. The Euro is giving us 3 month averages on each forecast map, so keep that in mind when looking at the forecasts. The trend is what you need to consider as well as actual numbers.
-
July updated Euro seasonal still going with a La Nada: https://charts.ecmwf.int/products/seasonal_system5_nino_plumes?base_time=202507010000&nino_area=NINO3-4 Here's a link to all the forecast parameters. It has cooled temps since the last run across NA and has a normal temps in Canada vs last run lending credence to the Cansips. https://charts.ecmwf.int/?facets={"Product type"%3A["Experimental%3A AIFS"]%2C"Parameters"%3A[]%2C"Type"%3A[]%2C"Range"%3A["Long (Months)"]}
-
First morning back on the deck for breakfast. A bit muggy but I will take the cooler temps, and in the shade on the backside of the house. Mr. J and I opted out of any fireworks last night. With both kids working pet sitting jobs we just stayed in. Good thing found out that one of our cats was not very happy with the “in" neighborhood mini display going off.
-
chantelle me bangin lass innit someone change the title
-
ha ha ha ha ha ha ha Tropical Storm Chantal Satellite | Buoys | Grids | Storm Archive ...DEPRESSION STRENGTHENS TO TROPICAL STORM CHANTAL... ...TROPICAL STORM WARNING ISSUED FOR PORTIONS OF THE CAROLINAS...
-

July 2025 Discussion-OBS - seasonable summer variability
donsutherland1 replied to wdrag's topic in New York City Metro
I agree. It is disappointing that the situation at Central Park has been neglected. The data no longer reliably reflects summer conditions in Manhattan. No matter how the data is examined, one sees an unmistakable impact during the summer or full foliage months. -

July 2025 Obs/Disco ... possible historic month for heat
dendrite replied to Typhoon Tip's topic in New England
Skyrockets in flight? -

July 2025 Obs/Disco ... possible historic month for heat
Typhoon Tip replied to Typhoon Tip's topic in New England
it's already 68 here -
July 2025 Discussion-OBS - seasonable summer variability
bluewave replied to wdrag's topic in New York City Metro
This was the reason that the NWS didn’t like to substitute readings at LGA back in the 1970s when the NWS equipment was out of service. Before the tree growth issue in the 1970s, LGA ran cooler than NYC did. So the NWS recognized that an open area of Central Park in the middle of Manhattan was a warmer part of NYC for summer high temperatures than right on the bay in Northern Queens. Central Park is our one ASOS in or around NYC which is the furthest distance from the water and local cooling breezes. So my estimate is that the placement of the ASOS under the trees has resulted in nearly 10 fewer 90° days reaching annually then they would be getting if the equipment was sited the same way prior to the 1990s. Annual 90° day counts for EWR, NYC and LGA during the 1961-1990 era prior to the ASOS being placed under the trees in the deep shade. EWR…..23 days NYC…..18 days LGA…..14 days Annual 90° day counts for EWR, NYC, and LGA during the most recent 15 year period of maximum tree growth and summer warming from 2010 to 2024. 12 out of the last 15 summers warmer to record warm across the region. EWR…..33 days for a 43% increase over 1961-1990 averages NYC…..19 days for only a 5% increase over 1961-1990 averages LGA…..25 days for a 78% increase over 1961-1990 averages The actual number of 90° days Central Park would be getting if the ASOS wasn’t under the trees would be around 28 a year. I arrived at this number by averaging the 43% increase at LGA and 78% at LGA. The average number was a 60% increase or 10 days more up to 28 days from 18 days. So the 5% increase from 1961-1990 should actually be 60%. So an annual undercount of 55% for 90° days if the ASOS was in a grassy clearing like the Great Lawn rather than beneath a densely wooded area of Central Park next to the castle. https://www.nytimes.com/1977/07/22/archives/vandals-in-central-park-forcing-weather-service-to-seek-new-site.html When the devices at the castle are not functioning, the Weather Service substitutes readings from La Guardia Airport. But Mr. Gibson said those readings do not really reflect conditions in the city, because they may be several degrees cooler in summer or warmer in winter than those in Central Park.