All Activity
- Past hour
-
yes, aside from the prolonged rain along the shore, it was tame in comparison.
-
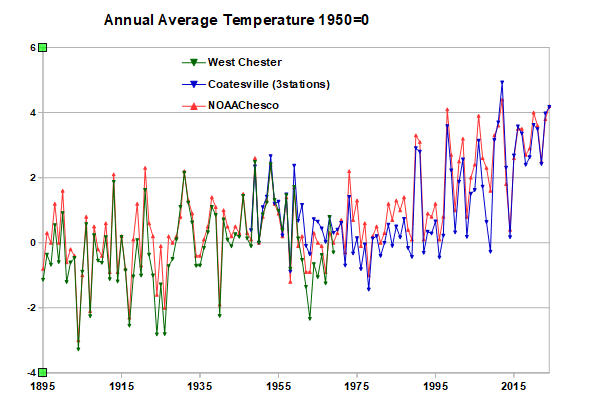
Not even close to being right. You are cherry-picking the data you like, the temperature values, and ignoring the rest of the information associated with the raw data: the station locations, the station moves, and the relative temperature between stations. Easy to spot the station moves and other major changes by tracking changes in the relative warmth of the Chesco stations. Its well proven science. That's why NOAA's results are different than yours. I get very similar results to NOAA by using the raw data at West Chester (before move) and Coatesville (after move) and avoiding the station moves. We saw in the other thread that the individual station data agrees with NOAA. Why wouldn't it? NOAA uses all the information and well proven science.
-
You live in a colder area west of I-95 than NYC and other warmer coastal areas. So in marginal storms when the I-95 corridor and points east change to rain your area can remain mostly snow. NYC and coastal sections haven’t reached average mid 20s seasonal snowfall without at least one KU event since the 1990s. Prior to the 1990s NYC and the coastal sections were cold enough to reach mid 20s seasonal snowfall with a bunch of small to moderate events. Hopefully, we can see at least an intermittent return to KU benchmark tracks over the remainder of the 2020s so NYC can have a shot at reaching average snowfall or better.
-

Central PA Fall Discussions and Obs
Itstrainingtime replied to ChescoWx's topic in Upstate New York/Pennsylvania
I am so ready for a wintry scene outside. Beggars can't be choosy but since I'm not begging I'll elect to choose a nice, solid snow cover from late December that lasts into the beginning of 2026. Give me a white landscape for a few weeks during minimal sun angle with long nights and I'd be happy as a fiddle. -
Nah they can be stronger inland and have more precip. This one was primarily far eastern and srn areas.
-
 0.51" storm total here. Not enough to put a dent in the drought unfortunately.
 -

Central PA Fall Discussions and Obs
pasnownut replied to ChescoWx's topic in Upstate New York/Pennsylvania
melted down, standard ratios - you'd be at 11". congrats would be in order. hehe -
Central PA Fall Discussions and Obs
pasnownut replied to ChescoWx's topic in Upstate New York/Pennsylvania
With all due respect those things can be said about any and every event we get. I'll gladly take my chances w/ noreasters any day and every day. Nothing new here IMO. Just happy to see something we've not seen in a while. -
My first Nor'easter since moving here and I'm wondering is this how Nor'easters usually are? It seemed to just be a couple of days of cool and surprisingly calmish rainy weather here. I don't live near the coast, so perhaps that's why it wasn't much here, but I'm just surprised because it felt so calm. There were wind gusts because there are some branches down and there are/were some power outages in the state including in my area but I guess I'm struggling to see how because every time I looked out the window it was so calm. No thunder, no lightning, no nothing.
-
If I’m not mistaken a bunch of the -IOD/Nina years saw -NAO/-AO in November. It looks like at least early November is going to start with a weak SPV
-
Thanks - but recommend starting simple. I enjoyed seeing the blow-by-blow records by participants, but I'm sure that added lots of formulas to make it work smoothly.
-
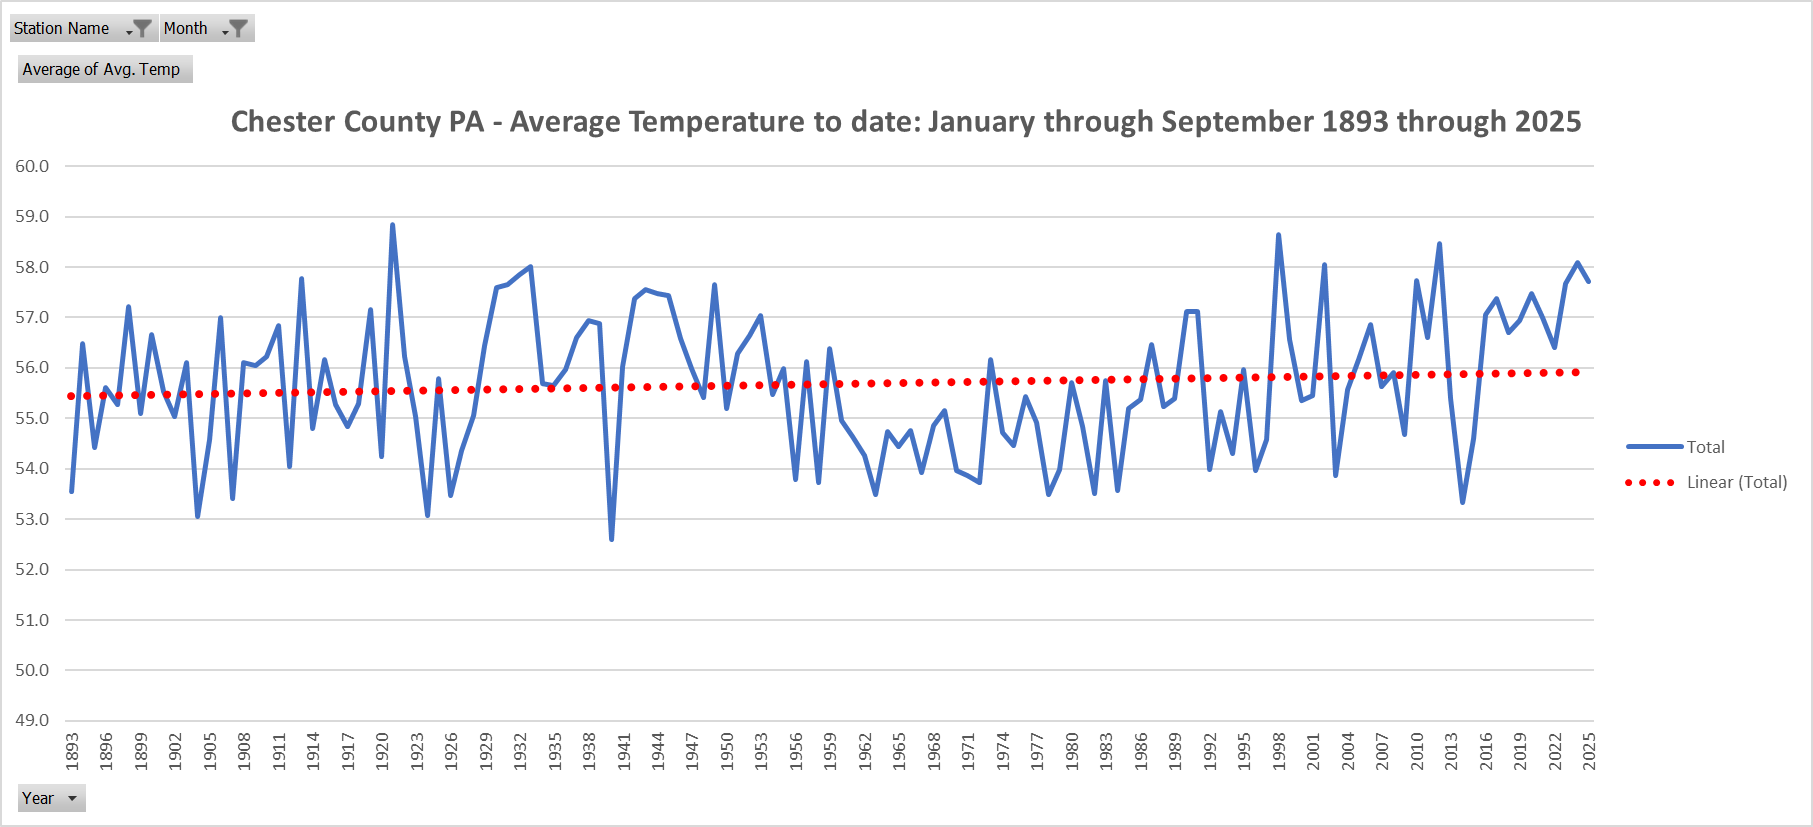
This is entirely unrelated to the discussion we were having above. I’ll ask the question again. Why did you call me out for “only including” a timespan from March to August when it was in response to you posting a map that only included January and February data? Why are you redirecting the conversation from national data to just specifically Chester County in the first place?
-
i agree... continuing into the start of nov a lot of guidance has the -NAO being quite persistent (even if its far out) which would make sense given the evidence that has been portrayed, Paul Roundy said that november would likely be the best month to curtail the SER, with the shift to more SER being sometime in january
-
I got a storm of 9" a few days before the 12" band, and 28.75" for the winter and about .5" below my wiinter average. Some areas missed out, stinks for them. Anthony was spot on on his assessment. I have pictures of every snow to prove it.
-
 ARI: Averate Return Interval. If anyone does analysis for October mdt coastal flooding events 5 day MODELED 2-3" rain and G40-60MPH, NON TROPICAL... let it rip. I've seen comparisons to tropical related or winter related. Nothing straight up. I'll check back late today. Thanks for your participation and while not worst case D5 outlooked scenario, and an imperfect nor'easter, most will have benefitted from outdoor cancellations and preparations as well as needed rain.
 -
1.52” total for the event.
-
About .15" from the past storm brings me up to about the same as you. 4.09" since 8/1
- Today
-
Got the rest thanks Tony LGA 46 MPH JFK 44 MPH
-
 2.2 around here and it looks like 0.56 at my other location (on the left edge of the map so I'm not sure if it's 0.56 or 0.36 lol)
 -
Yes indeed, I think the Gulf is number 1 in sea level rise (some islands already underwater off of the La coast), the east coast is number 2 in sea level rise and the west coast lags behind at number 3.
-
By the way - for more of this kind of actual real non-adjusted climate data for Chester County come visit the #1 website for all things Chester County climate with updated content still in progress over at https://chescowx.com/ Hopefully it will help allay the climate fear running rampant on this site. Enjoy!
-
 Received an additional .11" rainfall 8am Monday to 8am today. Three day event total .7".
 -
Walt on the western edge of that map, is that 0.56 near Lehighton, PA?
-
Thanks, my house heat kicked on this morning for the second time this month. I think the temperatures are dropping because of the cold wind.


(002).thumb.png.6e3d9d46bca5fe41aab7a74871dd8af8.png)