All Activity
- Past hour
-
That’s why the average home price there is $15 million lol
-
That leads to cold air pooling. My old house was in a low spot in town and cooled very well. New spot on the hill not as great. Compared to my old spot in the lower area it’s about 2 degrees warmer on RC nights
-
I remember like 20+ years ago I drove through there one night in October and I hit 38 degrees on the car thermometer while back at home in NE Queens (not that urban compared to the rest of the city) it was still in the mid 50s. It's so rural and beautiful there.
-
Yeah my station in Muttontown is at a low elevation too at 154' compared to the surrounding area.
-
Did you guys up north of me notice a massive drop-off in ticks during the dry spell? There were armies of ticks everywhere during the 2 months of Florida soup and over the last 4-6 weeks it's almost like they disappeared. Haven't seen a single one on our dog in a month after being a tick magnet for the 2 previous. We treat him but the ticks still get all over him before dying. Not a single one in weeks seems really odd. Of course I hope every tick on the planet dies yesterday but this cycle seems weird
-
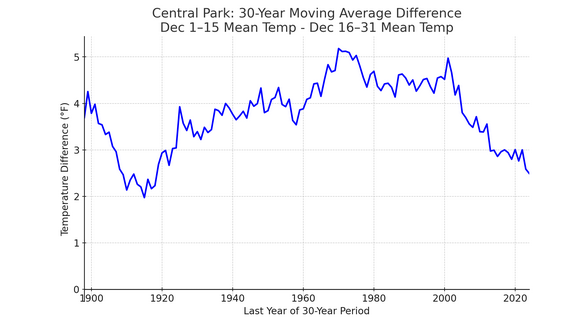
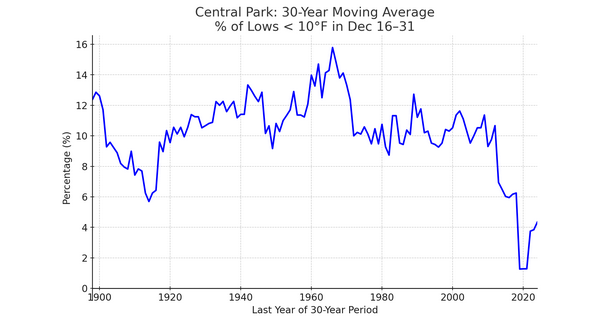
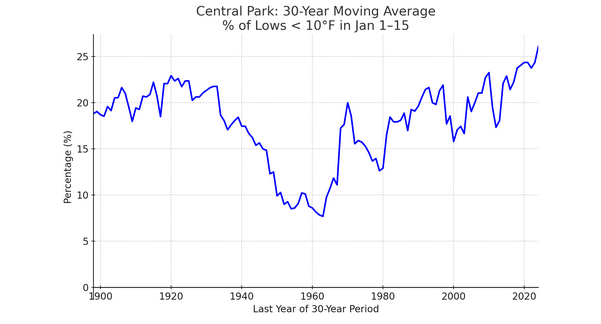
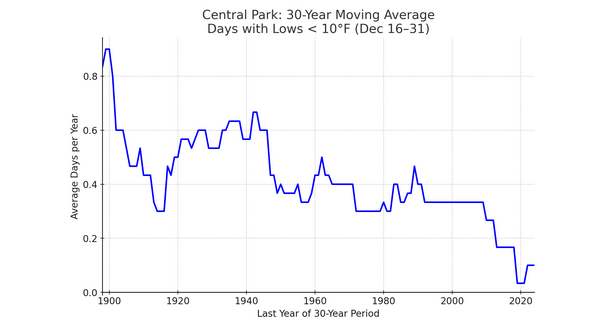
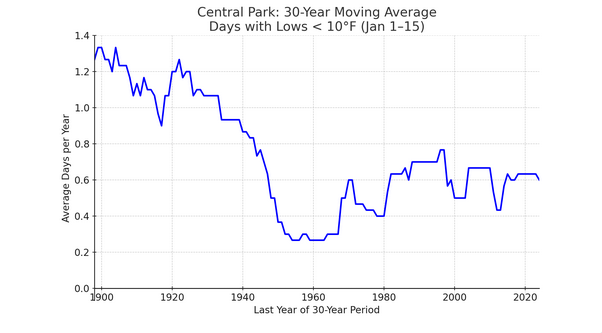
I just went back to the whole climate record. This isn't the first time that it's happened. I suspect that the current narrowing has a climate component in addition to a cyclical/internal variability component. My hypothesis about a climate component's being involved is based on the shrinking deep cold pool resulting in warming winters and a delay in the coldest outbreaks, in general. The result is that the frequency of extreme cold is falling and the distribution of extreme cold is being pushed into the first half of January. Prior to 1990, about 12.1% of NYC's single-digit or colder lows occurred during December 16-31. Since 1990, that figure has fallen to 5.0%. On a 30-year rolling basis, the December 16-31 frequency of such cold is lower than during the earlier period where the temperature difference between December 1-15 and December 16-31 narrowed substantially. The frequency of such cold has declined markedly for the December 16-31 period. Hence, there appears to be a climate component involved this time around with the narrowing of the temperature difference between the first and second halves of December. Distribution of Lows < 10°: Frequency of Lows < 10°:
-
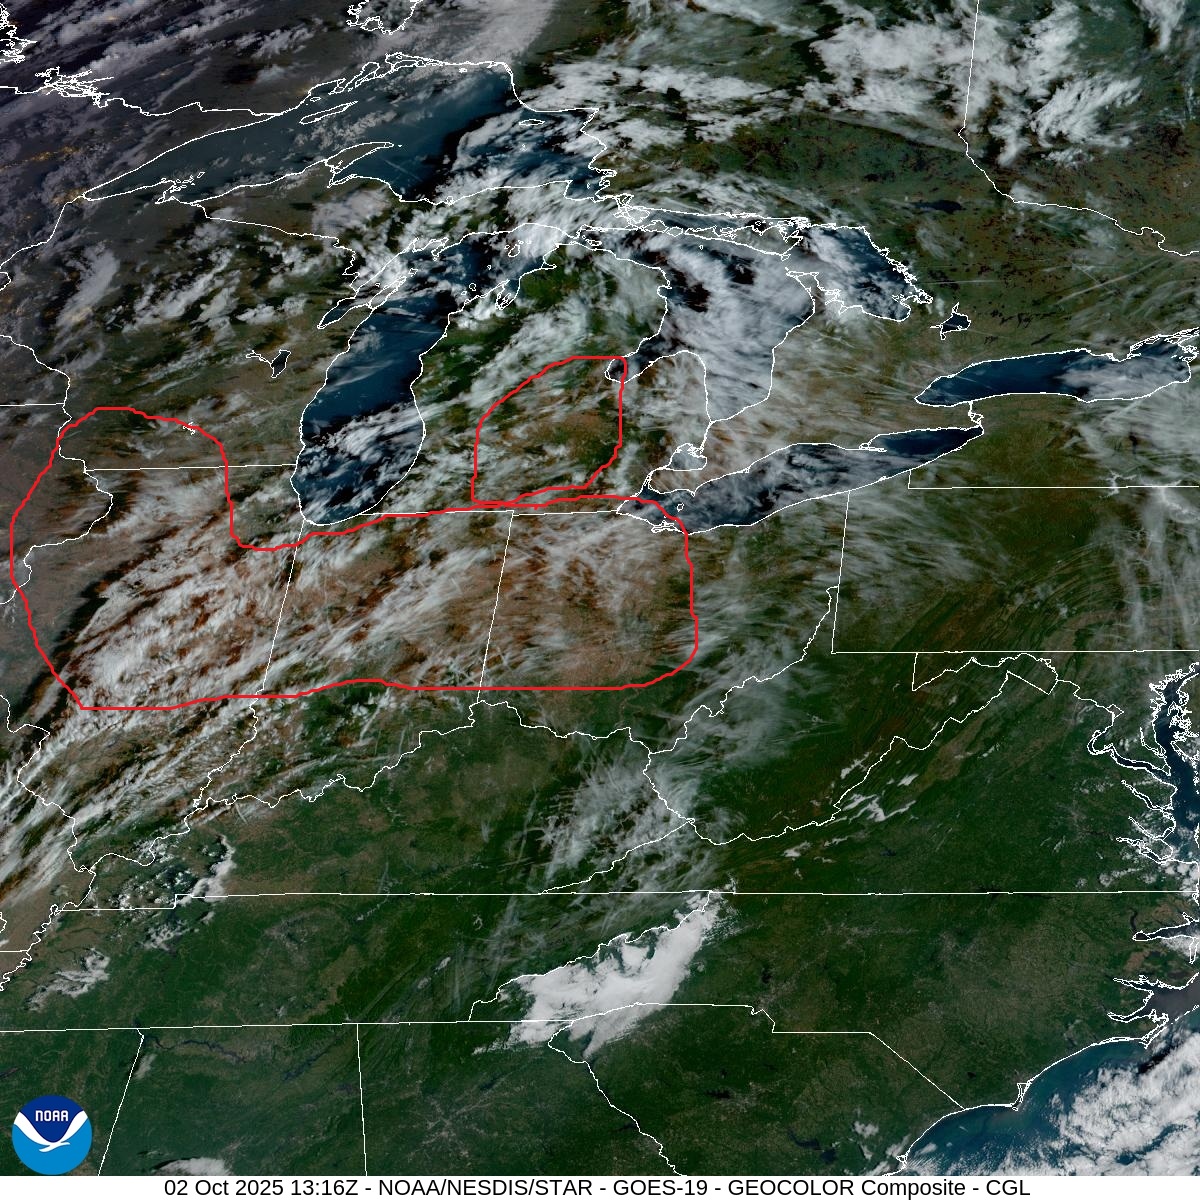
Drought conditions showing up on satellite.

-
46.
-
We also had a white Christmas last year, first time in a while.
-

Spooky Season (October Disco Thread)
tamarack replied to Prismshine Productions's topic in New England
29 and frosty this morning, tied with 9/21 for season's coolest. Cat lying in front of the woodstove. -
September was the first month this year warmer than the same month last year, at Central Park. Of course that is not saying a lot as last year tied for the warmest year.
-

Occasional Thoughts on Climate Change
Typhoon Tip replied to donsutherland1's topic in Climate Change
https://phys.org/news/2025-09-antarctic-sea-ice-emerges-key.html -

Central PA Fall Discussions and Obs
canderson replied to ChescoWx's topic in Upstate New York/Pennsylvania
44 here. It was good open window sleep. -
We are not getting any hurricanes to sniff this latitude
-
43.3
-
6z GFS is the look you would want to try and bring a hurricane near here..but ya it’s in fantasyland.
-
I doubt mother nature knows it's Christmas..lol..all kidding aside I'm sure it will even out to normal as it usually does with climate
-

Spooky Season (October Disco Thread)
weatherwiz replied to Prismshine Productions's topic in New England
I was just thinking, is it me or does it seem like the hemisphere as a whole, particularly Arctic latitudes, is very slow to begin the seasonal transition...or maybe its just a bit too early? This next part is better suited for the ENSO thread, but I don't feel good about our prospects for the winter. I guess maybe I'll go throw those thoughts in there shortly. -
Occasional Thoughts on Climate Change
Typhoon Tip replied to donsutherland1's topic in Climate Change
This really isn't true... (bold). There is well documented increased frequency of phenomenon that struck agriculture. The objective/observed reality of the Serbian climate refugees, a diaspora out of native farming regions due to climate change took place 15 years ago, and caused political-geodesic instability too... That's already occurred. There is empirically measured oceanic level rise that is inundating island nations, and also effecting an increased frequency of coastal storm impacts. Increasing numbers of deadly heat waves have struck European regions. Droughts in Australia have become increasingly more desiccating over time. All but impossible hydro management due to low predictive onset of excessive extremes of rainfall and associated inundation, followed by extraordinarily fast drying phases, have been plaguing interior Eurasia and Asia proper. All of these examples are both empirically measured, then ... mathematically proven to be attributed to alterations in the climate, which are connected to changes in the atmospheric circulation modal behaviors, all around the globe. It may be suffice it to say that they haven't happen enough? Not enough so to really garner the attention ( that they should...), which enables this kind of disrespect of the significance, and also ... false narrative/presentation - that would be apropos enough. But saying hasn't been the case, is false. -

Central PA Fall Discussions and Obs
Jns2183 replied to ChescoWx's topic in Upstate New York/Pennsylvania
The kraken awakes!!! Sent from my SM-X210 using Tapatalk -
Spooky Season (October Disco Thread)
CT Valley Snowman replied to Prismshine Productions's topic in New England
Low of 39.4. Looks like 4 days of low 80's around this neck of the woods Saturday-Tuesday. -
Not sure. Thurmont and Westminster are wide open and mix well. I'm excited to see what data we get from there!
-

Spooky Season (October Disco Thread)
HoarfrostHubb replied to Prismshine Productions's topic in New England
I saw frost on some rooftops. - Today
-
That Clarksville site is a really good radiator. Wonder if the new Lisbon location will be similar.
-
 We are pleased to share with you the Seasonal Maryland Climate Bulletin for summer 2025, which includes sea surface temperatures for the Chesapeake Bay and the state's coastal waters. You can access it from the following link: https://mdsco.umd.edu/Bulletin/bulletin_mdsco_sum25.pdf Points to highlight are: 1) Summer 2025 was warmer and drier than normal (i.e., 1991-2020 averages) in Maryland, with colder and drier-than-normal conditions in August, warmer and wetter-than-normal conditions in July, and warmer and drier-than-normal conditions in June. 2) The mean temperature was warmer than normal throughout the state, especially in Garrett County (2.0−2.8°F), Somerset and Worcester counties (1.0‒1.4°F), and Washington County (1.0°F); minimum temperatures were also warmer than normal everywhere in the state, with maximum values in the previously cited counties, but maximum temperatures were split between warmer (central Piedmont to the west) and colder (Eastern Shore) anomalies. Precipitation was below normal over almost the entire state, particularly in Frederick, Carroll, and Montgomery counties (3.2−4.0 inches deficit), which received 20 to 32% less precipitation than their climatological seasonal precipitation. 3) The partial water year 2025 (October 2024 − August 2025), except for northwestern Garrett County, was below normal everywhere else in the state, notably over Frederick, Carroll, and Montgomery counties (7−10 inches deficit) and parts of Harford, Kent, and Queen Anne’s counties (7−9 inches deficit). The region over Frederick received 18−27% less than its climatological water amount, while the region over Harford received 18% less. 4) Statewide, mean temperature showed that summer 2025 was the seventeenth warmest summer since 1895, while the maximum temperature indicated that this was the thirty-eighth warmest summer. On the other hand, the statewide minimum temperature revealed that this was the seventh warmest summer on record. Seventeen counties reached minimum temperatures within the ten warmest on record, and three of them within the five warmest; among these, Garrett County set a record, Somerset had its fourth warmest summer, and Worcester had its fifth warmest. 5) Statewide precipitation indicated that summer 2025 was the fiftieth driest summer on record. No counties were closer to any record, but Frederick had its twenty-eighth driest summer, while Washington got its thirty-sixth driest summer on record. 6) Sea surface temperatures in the Chesapeake Bay in summer 2025 were below their 2007-2020 mean over the majority of the Bay from the Upper Basin (1.2°F below) and the Middle Basin (0.6°F), where the anomalies largely occupied the main steam of the Bay and rivers on the Eastern Shore, to the Lower Basin where the extent of anomalies on the main steam diminished from north to south until they were confined to the waters along the Eastern Shore and rivers reaching the waters of the Tangier and Pocomoke Sounds (0.2‒0.4°F below). The waters off Worcester County’s Chincoteague Bay were also colder than the mean (0.2‒0.4°F below). On the other hand, warmer anomalies than the 2007-2020 mean appeared along the western shore waters from the Back and Patapsco Rivers (0.8-1.2°F above) to the southern Calvert County coast, where they expanded to reach the Taylor and Hoopers Islands (0.2−0.4°F above). The current all-basin mean temperature of 79.2°F was slightly below the 19-year mean of the dataset (79.4°F) and far from the coldest summer temperature of 77.5°F, set in 2014, within the 19-year record (2007−2025). Please refer to the bulletin for more details, including the century-long trends and links of interest. The bulletins are issued to monitor the state's recent surface conditions in a simple format, allowing Marylanders to better understand regional climate variations. This bulletin is possible thanks to the hard work and data made available by our friends at NOAA National Centers for Environmental Information and the CoastWatch East Coast Node. Please help disseminate this bulletin. Thanks, Alfredo -- ............................................. Alfredo Ruiz-Barradas, PhD Associate Research Professor Maryland State ClimatologistDepartment of Atmospheric and Oceanic Science 3437 Atlantic Building, 4254 Stadium Dr.University of Maryland College Park, MD 20742-2425, USA Email: [email protected]