All Activity
- Past hour
-
My niece's graduation party that day. I think my sister would prefer the few showers, haha
-
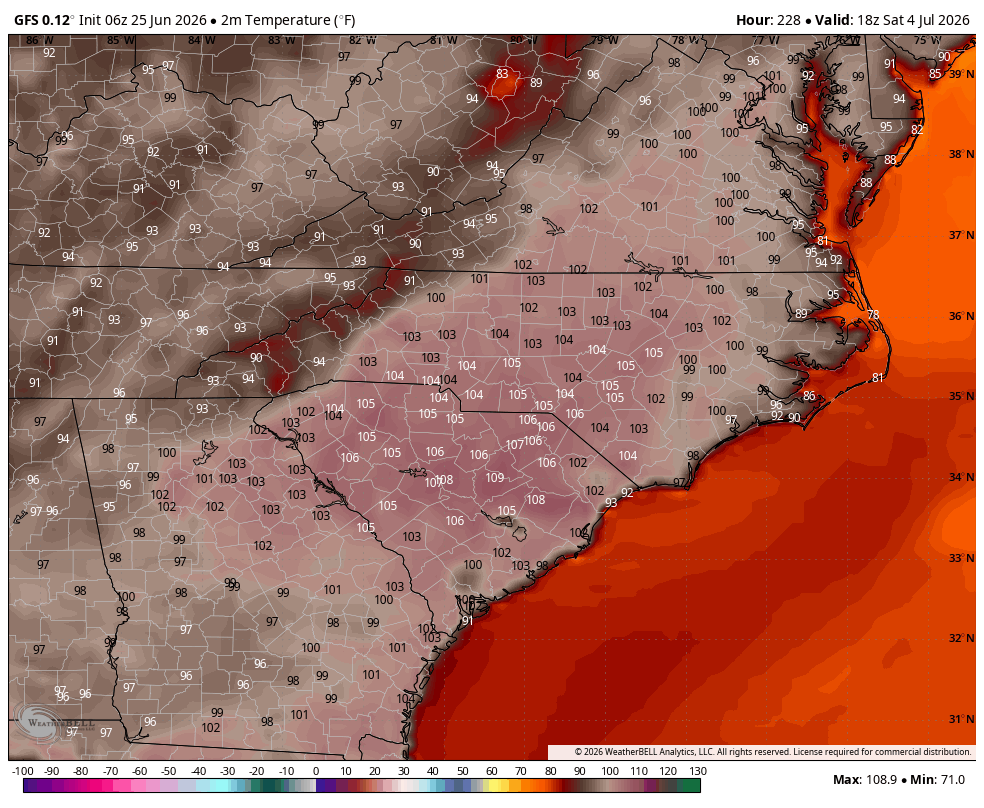
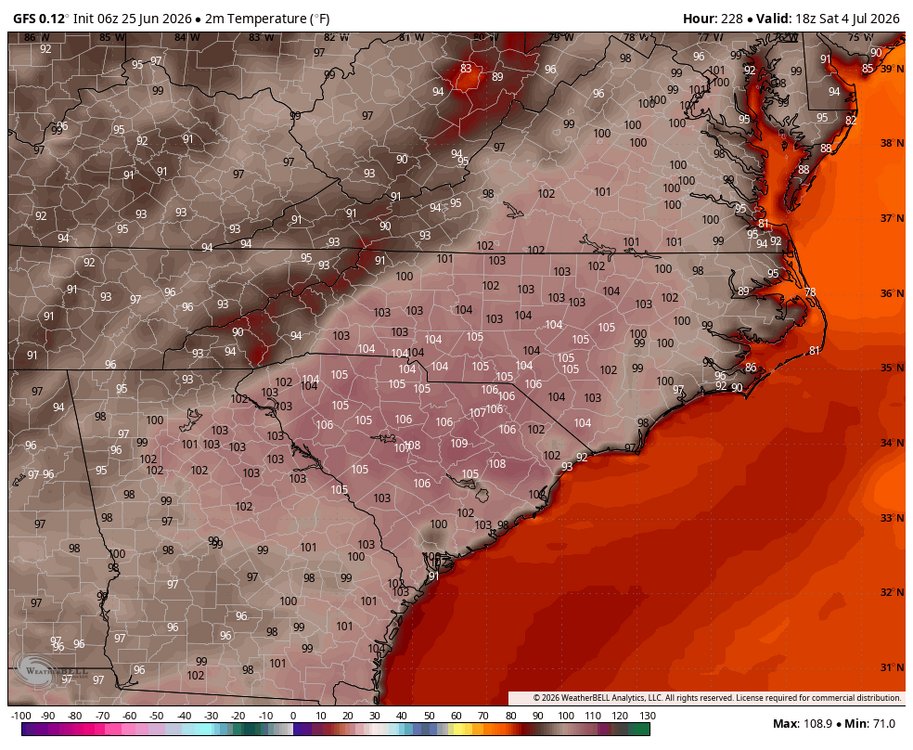
July fourth temps are scorching. An appropriate portend these days
-

Central PA Summer 2026 Discussion/Obs Thread
Superstorm replied to Voyager's topic in Upstate New York/Pennsylvania
57F in Lancaster this morning. It is going to be a scorcher in a few days. -
I’ve had a few sites giving me issues…but Wow handles the server stuff. Not sure what the cause is yet.
-
The lagging for the last 2 days has been terrible at AmericanWx!
-

2026-2027 Super El Nino
Typhoon Tip replied to Stormchaserchuck1's topic in Weather Forecasting and Discussion
I'm not sure if this is objectively true but this does seem "intuitively" to be quite fast for an onset differential - coarse kind of resolution/presentation as it may be... What's the average modality timing with these things...etc
-
has anyone else been receiving occasional report backs with Gate way lag/failures. It's saying it is at this end, btw. American's problem if the report is to be believed.
-

Central PA Summer 2026 Discussion/Obs Thread
Mount Joy Snowman replied to Voyager's topic in Upstate New York/Pennsylvania
Low of 58. Hoping for some beneficial rains the next three days but not super confident we get a whole lot. Heat builds for 4th of July week. -
Only got 0.27" Monday-Tuesday and only 0.88" so far for the entire month of June. Pretty typical of the south shore this time of year. 0.66" at ISP is the second driest June on record but we still have a few days to go with some rain chances. Only 1988 and 2005 were drier through the first 24 days of June. ISP has not seen a June with above normal precipitation (at least 3.77") since 2013 when we had 8.03". Since 2019, ISP has not seen a June with more than 2.27" of rain. '20, '21, '23, '24, and '25 all finished with rain totals less than 2". 2026 will likely be added to that list.
-
haha... Brain... no, Brian
-
I'd actually say 50/50 shot that the westward sudden retrograde idea around the 4th to 7th of July is too aggressive. As I said to Brain, the purer derived numerical teleconnectors, from all sources, are graphically not really propagating the rising PNA curve closer in time. Repositioning them toward the right on the graphs means any retrograde is been pushed back. I think what is more telling about that isn't a pattern flip, it's more a pattern uncertainty. It's like the modeling tech et al loses the linear more detectable physical forcing in the nearer terms, then that immediately exposes the vestigial perennial non-linearity of the N/A continent favoring higher heights over the Rockies.
-
So Saturday looks like a few showers or a complete washout with 1 to 2" of rain
-
Is there a big snowstorm coming or something?
-
Yeah I hear ya. My gut says to lean warmer this time of year at this range…at least until there’s more consistency of Atlantic taint toward d5. 6z gfs had some pretty hot days in there…granted we’re getting past 180hr and it may be doing some of that overmixing again. 98/49 probably verifies as 93/65.
-
No significant changes with drought in NC with today's update-
-
I get a bad gateway annoucement and it takes a long time to load as you mentioned.
-
Records: Highs: EWR: 101 (2025) NYC: 99 (1952) LGA: 99 (1952) / (2025) JFK: 102 (2025) Lows: EWR: 53 (1932) NYC: 53 (1873) LGA: 55 (1940) JFK: 54 (1965) Historical: 1749 — A general fast was called on account of drought in Massachusetts. It was the year of the famous dry spring in which fields and villages burned. (David Ludlum) 1925 — The mercury hit 101 degrees at Portland, OR, their earliest 100 degree reading of record. (Sandra and TI Richard Sanders) 1953 - The temperature at Anchorage soared to 86 degrees, their hottest reading of record. (The Weather Channel) 1957: Hurricane Audrey moved northward, slowly strengthening until the 26th. At that time, a strong upper-level trough led to its acceleration and the hurricane deepened rapidly on its final approach to the Texas/Louisiana border. Audrey became the strongest hurricane on record for June upon landfall, as it reached category four strength. Its acceleration was unanticipated, and despite hurricane warnings in place, 418 people perished in the storm, mainly across southwest Louisiana. 1981: Late afternoon violent thunderstorms moved across the region. Allentown, PA recorded a gust to 77 mph, with quite a few roofs blown off, chimneys toppled, windows blown in, several barns blown over, and innumerable trees felled. Power was interrupted to almost 100,000 customers, some without power for several days. Heavy rain caused flooding and mudslides. Philadelphia, PA received 1.91 inches of rain. (Ref. Wilson Wx. History) 1983: A quarter of an inch of early summer snow was reported near the towns of Sharon and Hartford in the higher terrain of central Vermont. (Ref. Wilson Wx. History) 1987 - Afternoon highs of 97 degrees at Miami, FL, 107 degrees at Medford, OR, and 111 degrees at Redding CA were new records for the date. It was the third of six straight days of record heat for Miami. Thunderstorms produced wind gusts to 70 mph at Austin, and gusts to 75 mph at Tulsa OK. (The National Weather Summary) (Storm Data) 1988 - Fifty-two cities in the central and eastern U.S. reported record high temperatures for the date. Highs of 100 degrees at Erie, PA, and 104 degrees at Cleveland OH established all- time records for those two locations. Highs of 101 degrees at Flint, MI, 105 degrees at Chicago, IL, and 106 degrees at Fort Wayne, IN, equalled all-time records. Thunderstorms in Idaho produced wind gusts to 100 mph west of Bliss and north of Crouch, injuring 29 persons. (The National Weather Summary) (Storm Data) 1989 - Tropical depression Allison, the remnants of what was earlier Cosme (a hurricane over the Pacific Ocean which dissipated as it crossed northern Mexico), began to spread heavy rain into southeast Texas and southwest Louisiana. (The National Weather Summary) 1990: Borrego Springs, CA hit 122°; their hottest temperature on record. Phoenix, AZ set a daily record high of 120°. (Ref. Wilson Wx. History) 1994: Blistering heat prevailed across the southwest deserts as many daily record highs were set including: Yuma, AZ: 119°, Tucson, AZ: 115° and Winslow, AZ: 103 °F. (Ref. Wilson Wx. History) 1995: Flood in Orange, Madison, Green, & Culpeper Co. as they had between 13.00 and 15.00 inches of rain. A lifeguard at a camping resort S of Myrtle Beach, SC, was hit by a lightning bolt as he was in the process of clearing the beach due to an approaching storm. He survived. Several people nearby noted “tingling sensations” when the bolt struck. (Ref. Weather Guide Calendar with Phenomenal Weather Events 2011 Accord Pub. 2010, USA) 2006: The precipitation total on June 25th was 5.31 inches, a new 26 year MAXIMUM precipitation record for a day. The old record was for a calendar day was ONLY 3.86 inches on October 8, 2005. 2006: The maximum one hour rainfall intensity was 2.35 inches on the 25th which shattered the previous record not only for June but for any month. The previous 26-year record was 1.74 inches on July 28, 2000. (Annandale Weather Records) 2008: Missouri: Thunderstorms deluge northern Missouri and sections of central Illinois with 6 to 8 inches of rain. Linneus, Missouri was hardest hit with 8.61 inches while nearby Ethel reported 7.88 inches and Gallatin 6.80 inches. (Ref. WxDoctor)
-
The GFS actually hangs the warm front right over us for 2 and half days from what I see. A time in which IL/IN/OH/MI enjoy 582 to 584 dm hydrostats containing 25+C at 850 mb plasma layer, over 102 F surface blister. It's related to that stuff we talked about yesterday ..it's stacking the ridge heights uber tall, but keeping the wave lengths pretty short - does seem a little suss but who knows. I see what you are saying but the GFS is trying really hard to keep the wave ( holistically...) lengths so curved and steep that it collapses the ridge's giz pulses more S than SE. E NY/PA and NE ends up more just humid and thundery and probably MCS traffic cops. It's a form of summer weather for sure... But just my take looking at the 00 and 06z blended GFS operational runs. Having said that... what's interesting is that the GEFs/GEPs means are actually cleaner looking than the operational versions of either cluster. That in and of itself is likely just smoothing from the member tussle/averaging.. .but, it shows also that this is precarious, because those smoother inclinations actually would send an over top heat crest in a couple of 18 hour separated maxes... (too detailed to make that call, but I have long years of experience at this point). Interesting. I'd say the ens means look more more "successful" in the over top method. Of course, still D7... The blend of all looks high confidence for the southern GL region to suffer a short duration very intense heat wave. No comment on historical this-that comparisons for now. Regarding that, those 2-m Ts do not look correct given the holistic, synoptic- parametric constituency that is objectively modeled. Not unusual though - not sure why 2-m products really exist. It is clear they either stop the adiabats at something higher than the surface sigmas (thus can't be 2 meter anything...) or just suck too bad to even look at them. So .. short duration? I only say that because even though the ensemble spatial synoptic means can't seem to wait to toggle the entire structure dubiously quickly back W...like within 2 days flipping the PNAP on it's ass, I'd caution, the numeral teleconnector ( math provided numbers) are having difficulty getting that nearer in time. They are collapsing the wave function ... think can kicking, which means it could be rushed.
-
76 / 58 clouds to the west likely clouding up by the afternoon. Friday looks mainly dry / cloudy before storms / showers and next round splits the weekend with Saturday wet 0.5 - >1.00 inches f rain and Sunday looking amazing. Ridge balloons next week centered over the midwest 6/29 - 7/4 with heat likely focussed (strongest heat) inland from the shore/beaches. The period Tue - Friday looks like prime - peak heat mid - upper 90s potential with 850 MB temps in the >20c range but again the onshore component and sea-breeze could keep the strongest heat inland. Beyond there 7/5 - beyond overall warm - hot and the Fourth of July weekend comes into view , looks like the the main threat is isolated storms which appear around the periphery of the ridge Sat - Sun. But otherise hazy - hot. NNW flow.
-
Another extreme heatwave matching the findings of this recent paper. Conclusion Actionable climate assessment for effective climate adaptation and mitigation requires skillful and reliable projections of extreme weather risks under different emission scenarios on a regional to local level. This holds particularly true for the representation of recently observed extremes of large magnitude that might be rare under current climatic conditions but will become more likely under continued GHG emissions (1, 56, 64). Skillful projections of trends in such “extreme-extremes” (unprecedented or record-shattering extremes) must build on a thorough physical understanding of why they are emerging and the nonlinear behavior responsible so that model simulations can be benchmarked and potential biases can be accounted for. In large and densely populated areas such as western Europe and China and other areas that feature important biomes for the world climate such as the Amazon, and polar regions around Greenland and Canada, some of which have been discussed in the context of climate tipping points (65, 66), the multimodel mean of climate simulations of the past decades does not show the enhanced warming of the temperature distributions’ upper tails observed in these regions (Fig. 1 and SI Appendix, Fig. S5). Note that for the Amazon, the strongest trends have emerged over the past 23 y and are found for ERA5 only (SI Appendix, Fig. S4). Often, the multimodel mean is used and prioritized in many assessments of climate risks, while upper percentiles are treated as implausible scenarios and are at times rejected as outliers. For instance, the 1.5 °C warming target established by the Paris Agreement was set largely based on avoiding “dangerous climate change,” in part associated with critical tipping elements and/or thresholds in the Earth system (65, 67). However, if impacts of global warming, such as amplified extreme heat, proceed faster than expected based on the multimodel mean projections used to support such a warming target, its utility may deserve reconsideration. We find that in numerous regions (Figs. 2 and 3), trends in the tail-widening of extreme heat distribution over the past 65 y exceed the 95th percentile of the model spread and, in some cases, even exceed the spread entirely. Trends shown in ERA5 reanalysis are outside of the modeled range for southern South America, the Arabian Peninsula, and Arctic Canada (Fig. 3 D, E, and H), irrespective of any model configuration investigated here, while the observed uncertainty intervals determined by bootstrapping overlap with the model spread. These findings hold for model simulations at higher resolution, or forced with historical SSTs, as well as with greatly expanded ensemble sizes (SI Appendix, Figs. S5, S8, and S9). Newer modeling initiatives such as super-high-resolution frameworks suggested, e.g., in the Earth Virtualization Engine (EVE) (68) promise convection permitting resolution and may offer possibilities in improving the depiction of important mechanisms. However, no substantial improvement for the higher resolved subset of the investigated models was found. Super-high-resolution, convection-resolving models may better represent processes that link SSTs with Rossby waves and associated extremes (45), regional blocking, and realistic surface response of heat events to such atmospheric patterns (50, 51). However, limitations due to data storage and computing costs might be significant constraints for the study of extreme events with high-resolution modeling frameworks, as the long time series lengths and large ensemble sizes needed for adequate statistics and trend attribution may be too resource intensive and not readily available. Newer generation models have also shown an improved skill in modeling blocking events which is more pronounced in high-resolution models (47, 69). Given the importance of nonlinear feedbacks involving hydroclimatic processes, a proper representation of the seasonal relationships of the flow of energy and water in the soil–vegetation–atmosphere continuum needs to be assured (7). Reasonable forecasts of past extreme heatwaves suggest that models can in principle produce such extreme-extremes when directly forced with the correct boundary conditions (11, 70). Ensemble boosting techniques can be used to create large ensembles of extraordinary extremes at reduced computational cost (71, 72). In an evolutionary manner, these algorithms preserve those that follow an extreme trajectory while filtering out others. This allows a sampling around a specific event characteristic. A large ensemble of highly anomalous events, which would be featured only at an extremely low rate in large ensembles (20), allows for an in-depth and statistically robust analysis of the governing physics of extreme-extremes in models. However, disentangling the relative importance of externally forced and internal variability in the observed trends may be key to attributing the sources of model–observation discrepancies. Coordinated single forcing large ensemble experiments such as the new Large Ensemble Single Forcing Model Intercomparison Project (LESFMIP) (73) might help in improving our understanding in the relative role of various external or internal drivers in extreme event trends. Further, machine learning (ML) approaches have shown promising results for providing more reliable bias adjustment of climate model output. These are based on methods from image processing and are better in retaining the relationships between variables compared to more traditional quantile-mapping approaches. This is particularly important when analyzing risks and impacts from compound extremes. ML techniques could also assist in detecting nonlinear and regime-changing behavior in the ocean–atmosphere–land–vegetation system and provide causality where common drivers experience strong coupling and feedbacks (9, 74). Beyond using ML for analysis, recent advances in ML-driven weather forecasts exemplify its potential in climate modeling (75, 76). In addition, ML might offer accurate and less computationally costly solutions for resolving important subgrid processes (77, 78), compared to purely numerical frameworks. ML approaches, however, must be combined with others that can physically explain and understand the causal flows identified by ML. New assimilation techniques that integrate observational datasets and exploit advanced interpolation frameworks have been proven to improve the depiction of extremes compared to reanalysis datasets (79) and provide climate information at a higher resolution. While our findings provide many avenues for interesting and relevant new research, the authors stress that the best way to reduce both uncertainty in and exposure to climate impacts is a rapid transition of relevant societal sectors away from fossil fuels to stabilize global temperature rise.
- Today
-

Occasional Thoughts on Climate Change
donsutherland1 replied to donsutherland1's topic in Climate Change
The official announcement from Météo-France: Translation: June 24, 2026 France has just experienced its hottest day ever recorded. Across the country, the average temperature over 24 hours reached 30°C, exceeding the 29.9°C measured... the day before, which was already the hottest day ever recorded since measurements began in 1947.
-
Tuesday (with a high of 88) is described as "nice" while Thursday (with a high of 86) is described as hot (granted it says humid) but still lol.
-
-

2026-2027 Super El Nino
bluewave replied to Stormchaserchuck1's topic in Weather Forecasting and Discussion
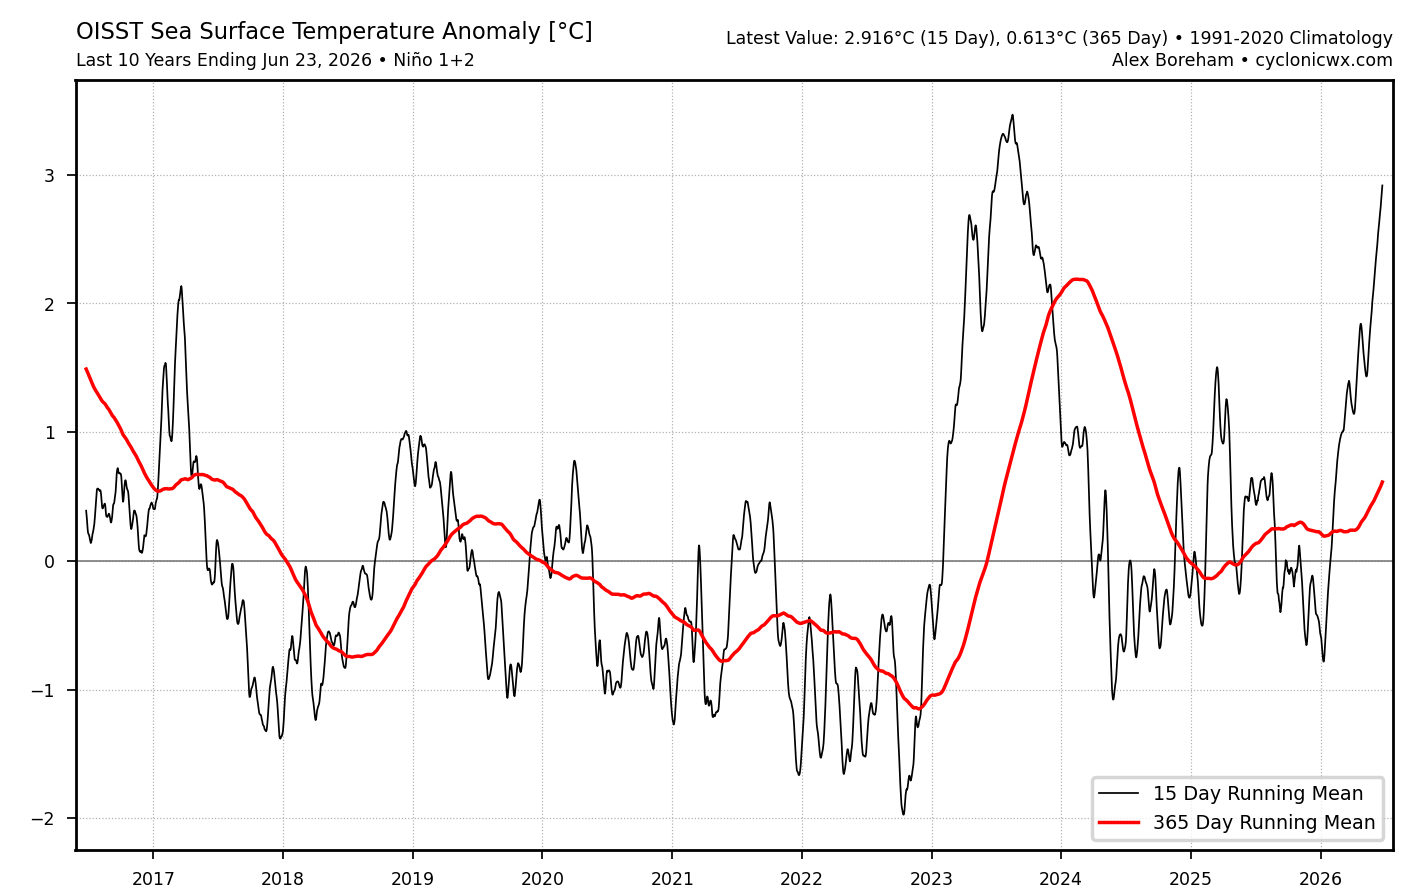
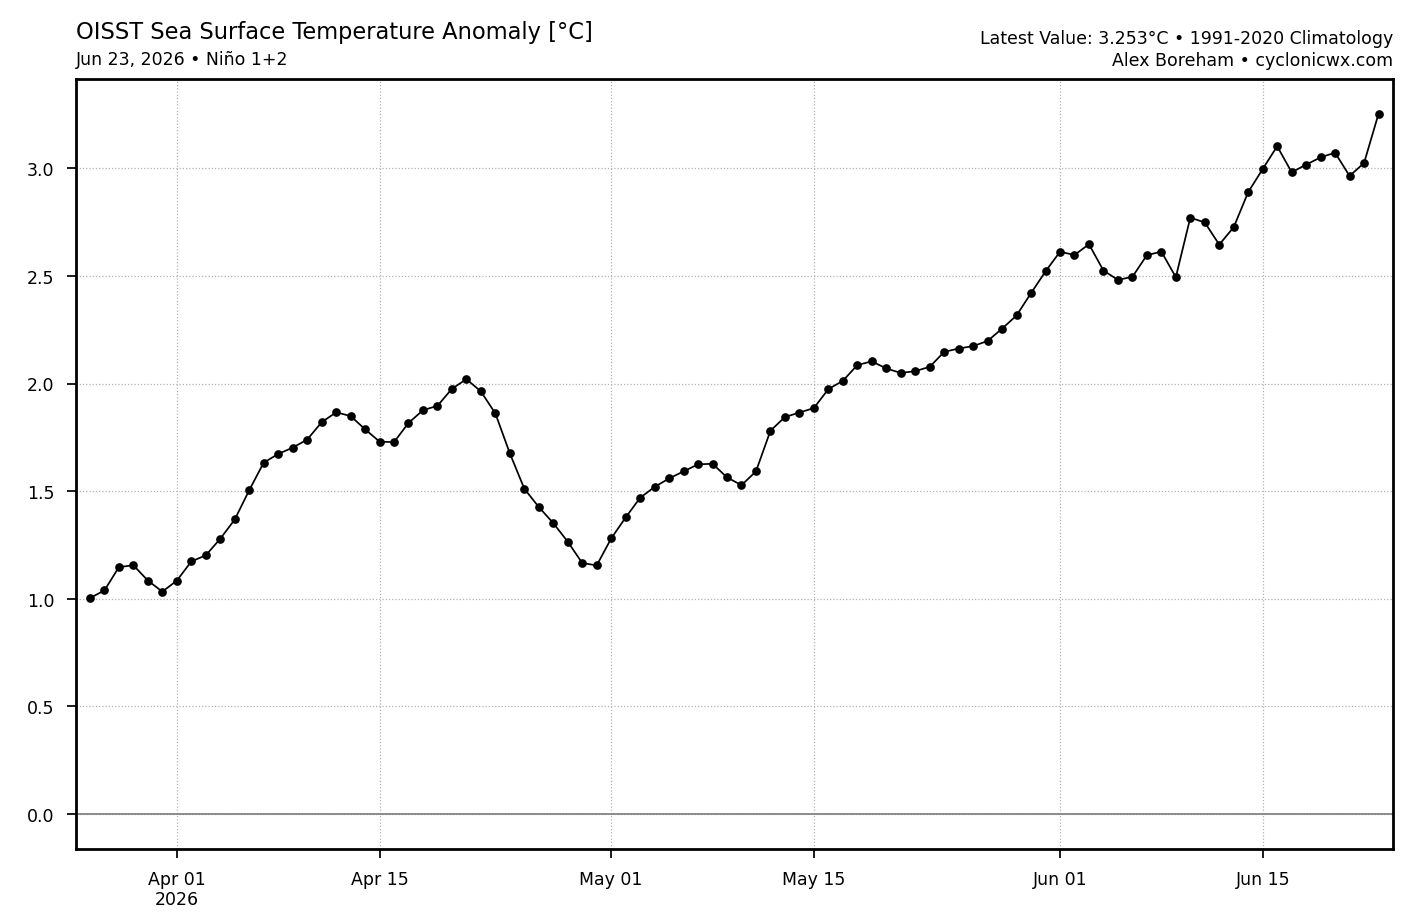
The first time that Nino 1+2 ONI went above +3 only 3 years apart. So the last super El Niño left a warm imprint without the stronger trades or much in the way of La Niña developing. The first clue the El Niño would reload so quickly was the 1+2 warming in November 2025 into December 2025. A record +PNA followed with a strongest Aleutian low in years and Nino-like elements to the pattern. Will be interesting to see how this record breaking event leaves the Pacific Basin SST and wind structure for what happens later in the 2020s. The current PDO would be in the +1.60 range just based on the EPAC warmth like July 2015. But the lingering warmth and ridging from Japan to North of Hawaii are having an overlapping influence leading to alternating Nino-like and Niña-like 500mb patterns across North America.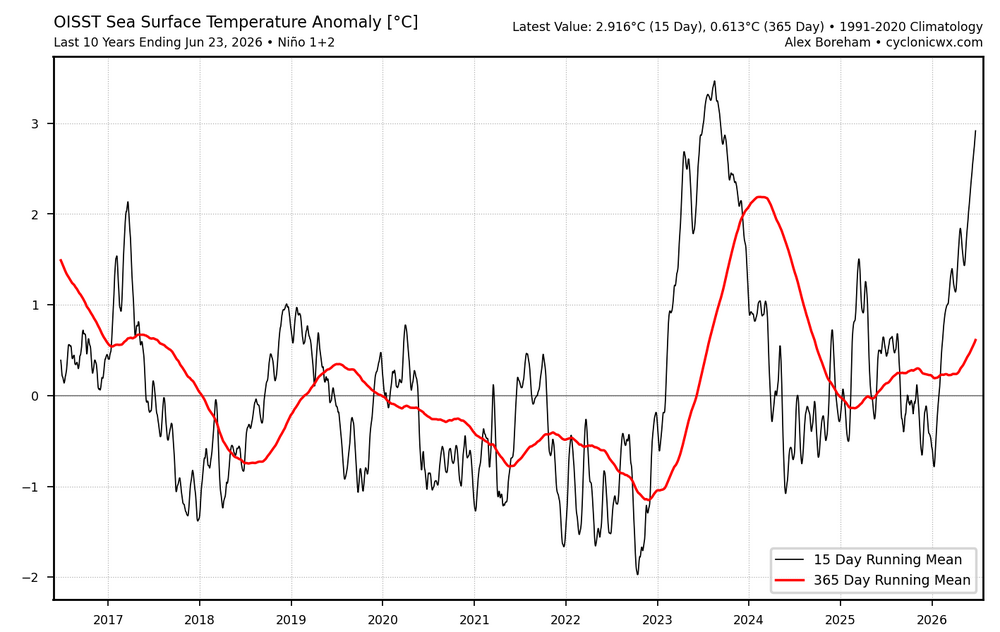

-
From Mount Holly- 0656 PM Tstm Wnd Dmg 1 SSE Wye Mills 38.93N 76.08W 06/22/2026 Talbot MD NWS Storm Survey Several thunderstorms crossed through the region on the evening of June 22, 2026. While there were multiple wind damage reports, the most intense path of damage was near Wye Mills to Cordova with a storm that crossed through near 7 PM. Damage was noted beginning along Old Wye Mills Road where multiple trees had been uprooted. A discontinuous path of damage continued towards the southeast. Along Newtown Road, multiple trees were snapped, with an estimated maximum wind speed of 90 to 100 mph, the highest estimated wind speed along the entire path. Near Saulsbury, a center pivot irrigation system was overturned. Damage path continued with additional damage, primarily tree damage, reported along Blades Road and Asches Acres Road. I saw some sporadic tree damage driving through that area yesterday morning headed to work. Most of the major damage was just to the west/NW .