All Activity
- Past hour
-
@gravityloverI'm you saw the big shift south on the models, looking dry now.
-

Central PA Summer 2026 Discussion/Obs Thread
mahantango#1 replied to Voyager's topic in Upstate New York/Pennsylvania
Good rain last night wasn't expecting that much. .86 rain last night. 1.37 for the week and 2.39 for the month. -
0.02" here, 1.77" for month and 16.70" for year.
-
Central PA Summer 2026 Discussion/Obs Thread
mahantango#1 replied to Voyager's topic in Upstate New York/Pennsylvania
yes, somethings wrong. - Today
-
Raining pretty hard here. Up to .4 already.
-
Can't wait Morning ZFP from LWX for DC metro for next week WEDNESDAY...Sunny, hot with highs in the upper 90s. .WEDNESDAY NIGHT...Partly cloudy. Lows in the upper 70s. .THURSDAY...Sunny, hot with highs around 100. Heat index values up to 110.
-
Little pink showing on returns must be some small hail either that or just extremely heavy rain.
-
About to get slammed here in Nanuet.
-
nwnj & orange/rockland counties really getting hammered overnight.
-
Closing in on .30” now:
-
Nice soaking rain tonight. Hopefully the veggie garden goes boom!
-
Wut? It’s been two days and brief error messages. Maybe get an iPhone?
-

Central PA Summer 2026 Discussion/Obs Thread
Jns2183 replied to Voyager's topic in Upstate New York/Pennsylvania
Whenever I see 1988 and 1999 pop up as the two most likely analogs it is not going to be a good time Sent from my SM-S731U using Tapatalk -
Central PA Summer 2026 Discussion/Obs Thread
Jns2183 replied to Voyager's topic in Upstate New York/Pennsylvania
Camp Hill enters the late-June/early-July heat with essentially no water in the bank. PRISM put just 0.76" on the cell over June 12–24, and my 5cm soil moisture tells the real story: it peaked near 62% after the June 10–12 rain and has bled straight down to ~37% since, with no resupply. The cumulative water balance (PRISM rain minus reference ET0) sits around −6.9" since April 1 — and that's before the heat arrives. This is a drained antecedent state, not a buffered one. @canderson I don't think you remember remember 1999 here because I was in high school still I remember that summer vividly as unbearable The forecast offers no relief. Pulling real Open-Meteo QPF rather than a zero assumption, the next ten days deliver about 0.18" of rain against ~2.2" of ET0 demand, dragging the balance to roughly −8.9" by July 4. ET0 ramps to 0.28–0.32"/day as highs hit 99–103° on July 1–3. Worse, the little rain that's offered falls before the heat peak and in sub-0.10" dribbles that largely evaporate before reaching the root zone. Functionally, plan as if it's a zero-rain stretch. To gauge where this goes, I searched 45 years of PRISM for 4-day stretches matching the upcoming signature — mean highs near 100°, dewpoints around 70°, near-zero rain — and found seven. The key split is antecedent moisture. The two most recent analogs (2011, last June 2025) walked in wet, with a soil buffer, and broke within days. The genuinely dry-antecedent cases — 1988 and the two 1999 events — are the right comparison for 2026, and they resolved three different ways: 1988 broke in 48 hours, 1999b ground on 25 days before a 2" dump, and 1999a never recovered, posting under 0.9" over the following month of compounding drought. Bottom line: this isn't a remarkable heat event by temperature alone — four analogs hit similar highs. It's the combination of humid 100° heat onto drained soil that puts us in the worst tier the record offers, alongside the late-1990s flash-drought setups rather than the well-watered recent years. Dry soil suppresses its own convection, so recovery depends entirely on an external trigger — a front or organized storm breaking through. The single thing worth watching is the medium-range guidance for that first genuine frontal passage in early-to-mid July. Its arrival is the 1988 path; its continued absence is the 1999a grind. Right now the forecast's leading edge looks more like the latter. Sent from my SM-S731U using Tapatalk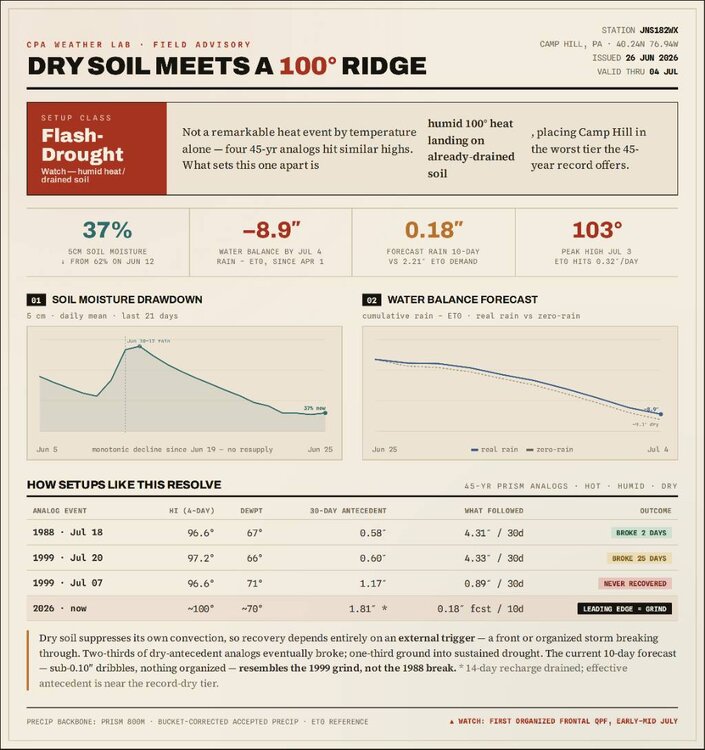
-
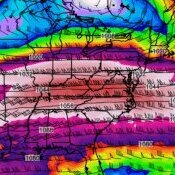
Questions still remain about how far north the heatwave will reach next week with much cooler air just to our north and east
-
NY/PA look pretty good 6/30
-
Central PA Summer 2026 Discussion/Obs Thread
Jns2183 replied to Voyager's topic in Upstate New York/Pennsylvania
It goes in and out Sent from my SM-S731U using Tapatalk -
E PA/NJ/DE Summer 2026 Obs/Discussion
JTA66 replied to PhiEaglesfan712's topic in Philadelphia Region
Summer is pretty much over after July 4th -
Sunday starts what looks to be at least 2 weeks of 70+ degree dews, with a few 80+ degree days mixed in as well.
-
The afternoon Euro and GFS runs took us to 100 next week. Hopefully overdoing it a little bit, but we'll see.
-
RGEM tonight has nothing too. I was hoping for rain because we really need it, but I know most people will be happy because it's a Saturday.
-
A squall moved from Cheyenne to Fort Collins, and the windy outflow boundary made it down to Denver, with renewed storm development right at Denver
-

Central PA Summer 2026 Discussion/Obs Thread
canderson replied to Voyager's topic in Upstate New York/Pennsylvania
Has anyone else had issues accessing this site the last day or so? -
New Bern is also 106 but it occurred in 1950's. It has been awhile since we hit 100.
-
Drove on 662 today south of Wye Mills and there are still trees hanging on the power lines. Tree crews and utilities were still working to clean everything up.


.thumb.gif.f92b16c631a1d15d405ed77b33f0710d.gif)