All Activity
- Past hour
-

Central PA Winter 25/26 Discussion and Obs
Jns2183 replied to MAG5035's topic in Upstate New York/Pennsylvania
Based on the Winter Severity Metric (WSM) and the recent weather data for Harrisburg (including the record 11" snowfall on January 25th), here is how the last seven days and the overall month of January 2026 rank historically. January 2026: Daily Standings The 11" snow event on the 25th was the clear heavyweight, immediately breaking into the Top 100 most severe days in the record (Rank 62 out of over 15,000 winter days). | Date | WSM Score | Daily Rank (All-Time) | Commentary | |---|---|---|---| | Jan 25 | 8.91 | #62 | Extreme: Record snow + high depth. | | Jan 26 | 7.20 | #704 | Severe: Deep pack persistence. | | Jan 27 | 5.96 | #1971 | Significant: Cold with standing snow. | | Jan 28 | 5.37 | #2662 | Moderate: Temps began to recover. | | Jan 29 | 6.46 | #1370 | Significant: Light snow / secondary wave. | | Jan 30 | 6.67 | #1120 | Significant: Deep cold return. | | Jan 31 | 6.47 | #1364 | Significant: Persistent pack. | Weekly Ranking (Jan 25–31) The final week of January averaged a WSM of 6.72. * Rank: It stands as the 119th most severe week in history. * While the daily peak of the 25th was historic, the gradual temperature recovery in the middle of the week kept it from breaking into the all-time Top 10 weeks (which usually require sub-freezing highs for all 7 days). Monthly Ranking (January 2026) This is where the 2026 season truly shines. Driven by the massive storm and a consistently cold pattern throughout the month: * Monthly Average WSM: 6.72 * Historic Rank: #6 all-time January 2026 now officially joins the ranks of the "Great Winters," sitting just behind legends like January 1994 (#5) and January 1918 (#1). It is the first time in the 21st century that a winter month has cracked the all-time Top 10 for severity. Sent from my SM-S731U using Tapatalk -

Possible coastal storm centered on Feb 1 2026.
SouthCoastMA replied to Typhoon Tip's topic in New England
flurries most of the day with occasional burst of light snow. maybe a heavy dusting here. too far east and too far west. -
Judah is a quack. And his explanation is so ambiguous, it’s comical. We’ve heard and seen that before this season…take the under.
-
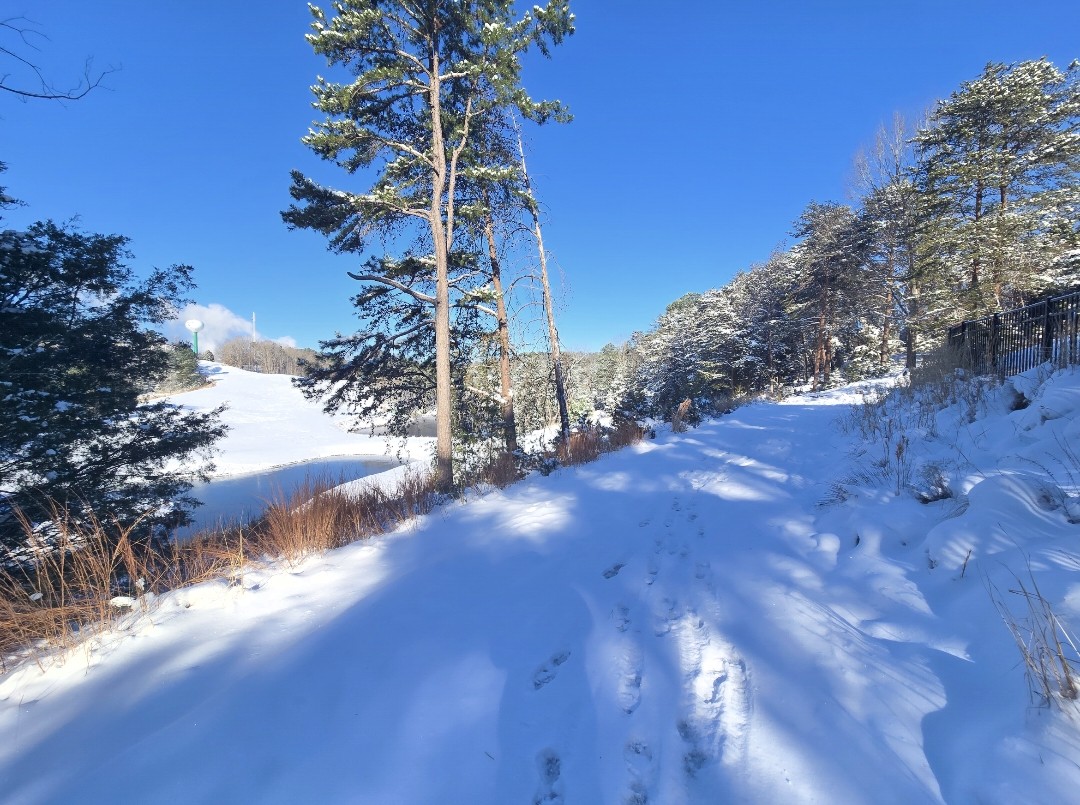
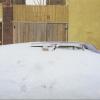
Took a walk this AM- figured I wouldn't see something like this event again IMBY anytime soon, so I took a bunch of pics around my house- enjoy!

-
It might not be that cold mid-month. But if it’s near climo, that’s usually good enough in mid-February. Ideally we’d get the reload for late Feb and into first half of Mar when climo starts going the wrong direction at a faster pace. Remains to be seen on that part.
-
-
Maybe we need to flirt with the edge for a bit in order to get some precip
-

Winter 2025-26 Medium/Long Range Discussion
mimillman replied to michsnowfreak's topic in Lakes/Ohio Valley
Torch incoming -
What’s worked is Southwest flow/over running type situations in the occasional clipper. They are more predictable and dependable. A great coastal can be awesome every once in a while, but they are a few and far between and very fickle. I think towards mid month we get into a much better pattern for snow specially with all the cold air around. I think we’re gonna have a good run.
-

Possible coastal storm centered on Feb 1 2026.
ORH_wxman replied to Typhoon Tip's topic in New England
South shore OES might be the winners in this one. Even more than ACK. -

Winter cancelled/uncancelled banter 25/26
NorthShoreWx replied to Rjay's topic in New York City Metro
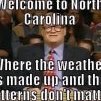
There were some places that got hammered and large screw zones in NC. Not saying we behave any better, but we've had more practice at dealing with these situations. -
-

WxUSAF's weak ass frontal passage thing.
Solution Man replied to dailylurker's topic in Mid Atlantic
We are SO BACK, WEAK SAUCE STORM -

E PA/NJ/DE Winter 2025-26 Obs/Discussion
Hurricane Agnes replied to LVblizzard's topic in Philadelphia Region
I had 7F for a low yesterday morning and a 10 this morning. The reason? The winds never decoupled here. Literally had gentle breezes going all Friday night into Saturday morning, from ~1-2 mph with "gusts" of 4 mph. Kept it from radiating. Had the same (with higher winds) overnight this past night. Am currently up to 20 with dp 9. I noticed that some of snowpack on the southwest side of my house is eroding, am guessing from insolation because it certainly isn't from melting! -

Central PA Winter 25/26 Discussion and Obs
Mount Joy Snowman replied to MAG5035's topic in Upstate New York/Pennsylvania
I heard some stat about State College having 8 straight days with temps remaining below 20 degrees (think it was just broken this afternoon), which is the longest such stretch since 1893, or something to that effect. Wild. -
January 30th- Feb 1st ULL and coastal storm obs
wncsnow replied to JoshM's topic in Southeastern States
Yep this snow is going quickly -
Central PA Winter 25/26 Discussion and Obs
Jns2183 replied to MAG5035's topic in Upstate New York/Pennsylvania
I've created this The Winter Severity Metric (WSM) is designed to quantify the "harshness" of a winter day on a scale from 1 to 10. While a thermometer tells you the temperature, the WSM tells you the experience—combining the biting cold with the physical reality of snow on the ground. How the Metric Works To ensure the scale is meaningful for the Middletown-Harrisburg region, the metric is calculated using a weighted average of four key weather variables. Each variable is first mapped to a 1–10 sub-score based on historical deciles (for temperature) and intensity thresholds (for snow). Snow Depth (40\%): The primary driver of winter severity. A deep snowpack transforms the environment and complicates daily life more than any other factor. Max Temperature (25\%): Weighted more heavily than the low, as the "high" temperature dictates how much (or little) relief there is during daylight hours. Snowfall (20\%): Captures the "active" severity of a storm event. Min Temperature (15\%): Accounts for the intensity of the air mass, particularly during overnight deep freezes. The Scale: Level 1-3: Mild winter days (Spring/Fall-like). Level 4-6: Typical winter days (Cold, perhaps a light dusting). Level 7-8: Significant Winter (Heavy snow or extreme cold). Level 9-10: "Deep Winter" (The absolute historical extremes). When we calibrate the Winter Severity Metric (WSM) specifically for the "core" winter window of December through March, the scale shifts to focus on the relative intensity of winter conditions. In this view, a score of 10 represents the historic extremes of the Harrisburg winter, while a 1 represents the mildest days that occur during the winter months. The Averages: Benchmarking a "Normal" Winter Based on historical data from 1899–2025, here are the baseline scores for a typical winter period in Middletown-Harrisburg. | Timeframe | Mean Score | Median Score | |---|---|---| | Winter Day | 3.45 | 2.98 | | Winter Week | 3.51 | 3.13 | | Winter Month | 3.46 | 3.23 | * Interpretation: A "median" winter day (roughly a 3.0) is typically clear and cold but lacks significant snow. Any day or week scoring above a 5.0 is considered "more severe than average," and scores above 7.0 are reserved for major winter events and extreme cold snaps. Top 10 Lists (Dec–Mar) 1. Top 10 Winter Seasons (Full Season Average) Calculated as the average daily WSM from December 1st through March 31st. * 1917–1918 (5.15): The all-time severe winter; dominated by the #1 month and multiple top weeks. * 1977–1978 (5.08): Defined by relentless snow depth that lasted through much of February. * 1904–1905 (5.07): An early century powerhouse with consistent arctic air. * 1993–1994 (4.96): Famous for repeated high-impact ice and snow events. * 1960–1961 (4.92): Contained the single most severe 7-day stretch in history. * 1969–1970 (4.91): A winter of extreme persistence in snow cover. * 1935–1936 (4.67): Record cold February coupled with significant snowpack. * 1919–1920 (4.63) * 1963–1964 (4.50) * 1995–1996 (4.46): Driven primarily by the legendary January '96 blizzard. 2. Top 10 Winter Months * January 1918 (7.59) * February 1978 (7.50) * January 1970 (7.46) * February 1936 (7.11) * January 1994 (6.78) * February 1905 (6.69) * January 1945 (6.61) * January 1961 (6.57) * January 1925 (6.49) * February 1994 (6.48) 3. Top 10 Winter Weeks (7-Day Non-Overlapping) * Jan 20 – Jan 26, 1961 (8.70): The peak of winter intensity in local history. * Jan 22 – Jan 28, 1918 (8.68) * Jan 29 – Feb 04, 1966 (8.57) * Jan 07 – Jan 13, 1996 (8.48) * Jan 29 – Feb 04, 1961 (8.46) * Dec 12 – Dec 18, 1917 (8.43) * Feb 07 – Feb 13, 1936 (8.39) * Jan 06 – Jan 12, 1970 (8.36) * Jan 19 – Jan 25, 1936 (8.28) * Jan 15 – Jan 21, 1918 (8.27) Commentary * The "Relentless" vs. "Extreme" Difference: A season like 1918 is the champion of "Relentless" winter (ranking #1 overall), while a week like January 1961 represents "Extreme" winter. In that week, temperatures barely moved, and the ground was buried, resulting in an average severity nearly 3 times higher than a normal winter day. * Modern Context: 1994 and 1996 are the only winters from the last 30 years to break into the all-time Top 10 seasons. The 1994 season was particularly unique because it placed two separate months (January and February) in the Top 10, indicating a long-duration severe winter rather than a single fluke event. * Threshold Dominance: Because Snow Depth is weighted at 40\%, months like February 1978 score extremely high. Even if it isn't the coldest month on record, having a foot of snow on the ground for 30 straight days is the most significant factor in creating a "Deep Winter" experience. Sent from my SM-S731U using Tapatalk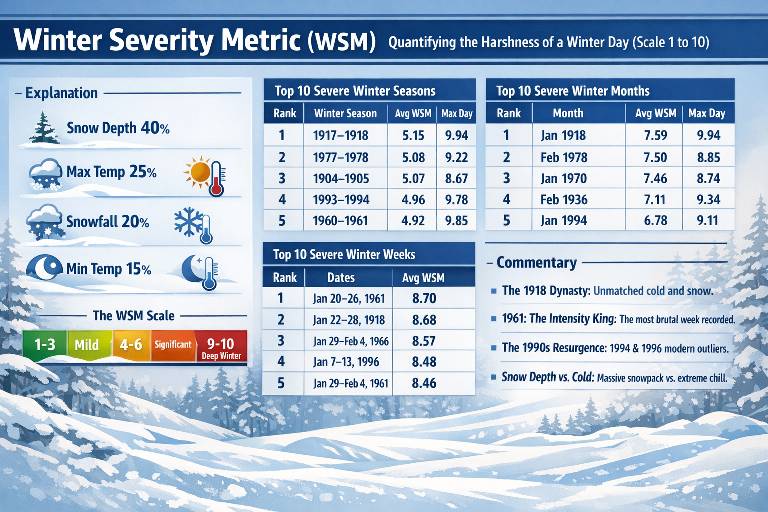
-
This.
-
Op run…I Don’t buy it at all…the tenor will win out like it has all season. Hang tough.
-
That’s a good point. I’m not super familiar with Lake George but it’s weird it froze behind schedule, given most other lakes seemed ahead of normal or with larger than normal ice extent. I do know that area is gusty and downslopes on NW flow off the southeastern Adirondacks… was just spitballing for ideas as to why it could be delayed. A lot of wind would lead to more mixing and upwelling, and the water surface is rarely calm.
-
We get a transient AK/Bering vortex but we also have a -NAO. Normally we’d prob torch for several days, but we’ll see if NAO block mutes that. We do get another -WPO reload…pattern looks pretty active though after next weekend so I think we’ll have chances. Hopefully we can score a good event during the relaxation period and not have it cut.
-
Another consistent trend on the models specifically euro is dry though the end of their runs. Euro aifs is 0.2 qpf
-
Euro is a Mark MoreGarbage back broken to winter.
-

January 30th- Feb 1st ULL and coastal storm obs
donsutherland1 replied to JoshM's topic in Southeastern States
651 NOUS42 KILM 011754 PNSILM NCZ087-096-099-105>110-SCZ017-023-024-032-033-039-054>056-058-059-020554- Public Information Statement National Weather Service Wilmington NC 1254 PM EST Sun Feb 1 2026 ...SNOWFALL TOTALS FOR JANUARY 31 - FEBRUARY 1 WINTER STORM... Location Amount Time/Date Lat/Lon ...North Carolina... ...Bladen County... Bladenboro 9.0 in 0740 AM 02/01 34.54N/78.80W Jerome 6.0 in 1014 AM 02/01 34.83N/78.73W White Lake 6.0 in 0542 AM 02/01 34.64N/78.50W ...Brunswick County... Longwood 17.7 in 0730 AM 02/01 34.00N/78.55W Ocean Isle Beach 15.0 in 0540 AM 02/01 33.89N/78.43W 4 NE Calabash 14.6 in 0740 AM 02/01 33.94N/78.54W 2 NNE Calabash 13.8 in 0700 AM 02/01 33.92N/78.57W 1 NW Ocean Isle Beach 12.0 in 0443 AM 02/01 33.90N/78.45W 1 SW Holden Beach 10.0 in 0857 AM 02/01 33.91N/78.31W Bolivia 9.0 in 0859 AM 02/01 34.07N/78.15W Southport 9.0 in 0920 AM 02/01 33.93N/78.02W 4 ESE Supply 9.0 in 0800 AM 02/01 34.00N/78.21W Calabash 8.5 in 1000 AM 02/01 33.90N/78.58W 2 NE Oak Island 8.1 in 0700 AM 02/01 33.94N/78.14W Boiling Spring Lake 8.0 in 0855 AM 02/01 34.03N/78.07W 1 N Calabash 8.0 in 0856 AM 02/01 33.91N/78.58W Oak Island 8.0 in 0857 AM 02/01 33.92N/78.17W 3 N Varnamtown 8.0 in 0739 AM 02/01 33.98N/78.24W Shallotte 7.5 in 0931 AM 02/01 33.98N/78.39W 2 WNW Calabash 7.4 in 0700 AM 02/01 33.91N/78.61W Leland 7.0 in 0700 AM 02/01 34.24N/78.01W Winnabow 7.0 in 0730 AM 02/01 34.15N/78.10W 1 NE Southport 6.5 in 0700 AM 02/01 33.93N/78.01W 4 SSW Belville 6.0 in 0923 AM 02/01 34.18N/78.00W ...Columbus County... Tabor City 16.0 in 0900 AM 02/01 34.15N/78.87W Cerro Gordo 14.0 in 0557 AM 02/01 34.32N/78.93W Evergreen 12.0 in 0745 AM 02/01 34.42N/78.90W Nakina 11.0 in 1000 AM 02/01 34.13N/78.67W Chadbourn 10.0 in 0850 AM 02/01 34.32N/78.83W 2 N Whiteville 9.0 in 0800 AM 02/01 34.37N/78.71W ...New Hanover County... 1 WNW Seagate 9.5 in 0943 AM 02/01 34.21N/77.86W 1 N Carolina Beach 9.0 in 0910 AM 02/01 34.05N/77.90W 3 N Carolina Beach 9.0 in 1020 AM 02/01 34.08N/77.89W 1 ENE Bayshore 8.5 in 0910 AM 02/01 34.29N/77.77W 2 NE Windemere 8.5 in 1000 AM 02/01 34.26N/77.83W Bayshore 8.0 in 0718 AM 02/01 34.29N/77.79W Masonboro 7.6 in 0700 AM 02/01 34.17N/77.87W 1 NW Silver Lake 7.6 in 0807 AM 02/01 34.16N/77.93W 1 NNE Myrtle Grove 6.6 in 1000 AM 02/01 34.14N/77.87W 1 NE Bayshore 6.0 in 0900 AM 02/01 34.30N/77.78W Myrtle Grove 6.0 in 0854 AM 02/01 34.12N/77.89W Wrightsville Beach 6.0 in 0700 AM 02/01 34.21N/77.79W Wilmington 5.8 in 0800 AM 02/01 34.21N/77.91W 2 SSW Wilmington 5.5 in 0639 AM 02/01 34.19N/77.92W ...Pender County... 2 SW Maple Hill 12.5 in 0611 AM 02/01 34.65N/77.75W 2 NNW Hampstead 12.0 in 0430 AM 02/01 34.40N/77.71W 6 E Saint Helena 10.0 in 0800 AM 02/01 34.52N/77.81W Surf City 10.0 in 0500 AM 02/01 34.42N/77.56W Watha 9.2 in 0800 AM 02/01 34.64N/77.96W Burgaw 7.0 in 0930 AM 02/01 34.55N/77.93W 3 SSW Watha 6.5 in 0730 AM 02/01 34.60N/77.98W 3 NW Castle Hayne 5.1 in 0700 AM 02/01 34.38N/77.93W ...Robeson County... Fairmont 12.7 in 0700 AM 02/01 34.50N/79.12W 1 WSW Lumberton 10.0 in 0740 AM 02/01 34.63N/79.03W 1 WSW Lumberton 10.0 in 0741 AM 02/01 34.63N/79.02W 5 S Orrum 9.6 in 0830 AM 02/01 34.39N/79.00W Parkton 4.5 in 0830 AM 02/01 34.90N/79.01W ...South Carolina... ...Darlington County... 2 NE Clyde 6.0 in 0700 AM 02/01 34.40N/80.16W 5 NNE Timmonsville 5.0 in 0850 AM 02/01 34.21N/79.91W ...Dillon County... Lake View 12.0 in 0551 AM 02/01 34.34N/79.17W 2 ENE Dillon 9.2 in 0700 AM 02/01 34.43N/79.33W 1 SSW Little Rock 8.0 in 0700 AM 02/01 34.46N/79.41W ...Florence County... Florence 6.0 in 0545 AM 02/01 34.18N/79.78W Scranton 5.5 in 0700 AM 02/01 33.92N/79.74W 2 WSW Effingham 3.5 in 0500 AM 02/01 34.06N/79.79W ...Georgetown County... Pawleys Island 2.0 in 0820 AM 02/01 33.42N/79.13W 5 NNE Georgetown 1.4 in 0800 AM 02/01 33.43N/79.25W ...Horry County... 2 ENE Little River 8.0 in 1129 AM 02/01 33.89N/78.60W North Myrtle Beach 8.0 in 0548 AM 02/01 33.83N/78.67W Longs 7.7 in 0900 AM 02/01 33.93N/78.73W Aynor 7.5 in 1148 AM 02/01 34.00N/79.20W Bayboro 7.0 in 0900 AM 02/01 34.02N/79.02W Socastee 6.0 in 0850 AM 02/01 33.69N/79.01W 3 SE Longs 5.3 in 0700 AM 02/01 33.89N/78.69W Myrtle Beach 5.0 in 0700 AM 02/01 33.70N/78.89W 3 SSW Socastee 4.5 in 0800 AM 02/01 33.64N/79.03W 3 S Red Hill 2.9 in 0700 AM 02/01 33.75N/79.02W ...Marion County... 1 SSE Mullins 8.0 in 0740 AM 02/01 34.19N/79.25W Marion 5.0 in 0940 AM 02/01 34.18N/79.40W ...Marlboro County... Wallace 6.0 in 0109 AM 02/01 34.72N/79.84W && -
January 30th- Feb 1st ULL and coastal storm obs
donsutherland1 replied to JoshM's topic in Southeastern States
083 NOUS42 KMHX 011814 PNSMHX NCZ029-044>047-079>081-090>092-094-193>196-198-199-203>205-020614- Public Information Statement National Weather Service Newport/Morehead City NC 114 PM EST Sun Feb 1 2026 ...Total SNOWFALL REPORTS Through Noon... Location Amount Time/Date Provider ...North Carolina... ...Beaufort County... 1 ESE Bath 17.0 in 1043 AM 02/01 Public 1 ESE Bayview 15.0 in 0947 AM 02/01 Public 3 S Old Ford 13.5 in 1015 AM 02/01 Public 3 E Belhaven 13.0 in 0939 AM 02/01 Public 1 NNW Belhaven 13.0 in 0947 AM 02/01 Public 4 N Cox Crossing 13.0 in 1133 AM 02/01 Public 2 SW Long Acre VFD 11.9 in 0900 AM 02/01 Trained Spotter 1 SW Washington 11.0 in 0850 AM 02/01 Public 3 SSE Blounts Creek 11.0 in 0943 AM 02/01 Public 5 SW Aurora 11.0 in 1000 AM 02/01 Fire Dept/Rescue ...Carteret County... 1 SE Peletier 19.5 in 1004 AM 02/01 Public Cedar Point 0.9 WSW 16.0 in 0500 AM 02/01 COCORAHS 2 ENE Broad Creek 16.0 in 0631 AM 02/01 Public 1 SW Newport 15.2 in 0700 AM 02/01 Official NWS Obs Otway 15.0 in 0827 AM 02/01 Public 1 WSW Broad Creek 15.0 in 0900 AM 02/01 NWS Employee Beaufort 15.0 in 0900 AM 02/01 Public 2 SSE Newport 14.5 in 0944 AM 02/01 Public 2 ESE Stella 14.2 in 1140 AM 02/01 NWS Employee 2 E Stella 14.0 in 1055 AM 02/01 Public 1 WNW Harkers Island 14.0 in 1123 AM 02/01 Public 1 SSE North River 14.0 in 1140 AM 02/01 Public Cape Carteret 1.5 NE 13.6 in 0700 AM 02/01 COOP Morehead City 13.0 in 0456 AM 02/01 Public Morehead City 2.9 WNW 13.0 in 0750 AM 02/01 COCORAHS 1 S Otway 13.0 in 0923 AM 02/01 Public 1 E Harkers Island 13.0 in 1020 AM 02/01 Trained Spotter Morehead City 5.7 W 12.5 in 0700 AM 02/01 COCORAHS Emerald Isle 2.1 E 10.0 in 0700 AM 02/01 COCORAHS 1 W Mitchell Village 10.0 in 0800 AM 02/01 Trained Spotter 1 W North River 10.0 in 0845 AM 02/01 NWS Employee Beaufort 3.8 N 8.5 in 0700 AM 02/01 COCORAHS ...Craven County... James City 2.5 S 18.0 in 0700 AM 02/01 COCORAHS 4 E James City 17.5 in 1104 AM 02/01 Public New Bern 7.3 ESE 17.0 in 0730 AM 02/01 COCORAHS 5 SSE Minnesott Beach 16.0 in 1049 AM 02/01 Public Trent Woods 1.2 ENE 15.5 in 0600 AM 02/01 COCORAHS 1 S New Bern 15.0 in 0918 AM 02/01 Public Bridgeton 14.2 in 0909 AM 02/01 Trained Spotter 1 ENE Trent Woods 14.0 in 0629 AM 02/01 Public 3 NNW Riverdale 14.0 in 0804 AM 02/01 Public Vanceboro 14.0 in 1120 AM 02/01 Public 1 SE Riverdale 13.5 in 0952 AM 02/01 Public 2 NNW Riverdale 13.5 in 1050 AM 02/01 Public New Bern 1.3 NNE 13.0 in 0700 AM 02/01 COCORAHS Trent Woods 1.3 WNW 13.0 in 0725 AM 02/01 COCORAHS 1 WNW Coastal Carolina Regio 12.5 in 0700 AM 02/01 COCORAHS Havelock 1.9 SSE 12.2 in 0800 AM 02/01 COCORAHS ...Dare County... 1 SSW Southern Shores 11.0 in 0730 AM 02/01 COCORAHS Duck 7.0 in 0730 AM 02/01 Trained Spotter 1 SSE Wright Brothers Nation 6.0 in 0929 AM 02/01 Trained Spotter Wanchese 2.8 in 0730 AM 02/01 COCORAHS Frisco 2.0 in 1140 AM 02/01 Public ...Duplin County... Beulaville 13.0 in 0700 AM 02/01 Broadcast Media Potters Hill 12.0 in 0823 AM 02/01 Public 1 WNW Albertson 12.0 in 0925 AM 02/01 Broadcast Media Potters Hill 12.0 in 0942 AM 02/01 Trained Spotter Wallace 14.8 E 11.0 in 0700 AM 02/01 COCORAHS Faison 3.3 SSE 11.0 in 0900 AM 02/01 COCORAHS 1 E Rose Hill 10.0 in 1044 AM 02/01 Public Rose Hill 10.0 in 1135 AM 02/01 Public Magnolia 7.0 in 0715 AM 02/01 Trained Spotter ...Hyde County... Scranton 5.6 SW 12.0 in 0700 AM 02/01 COCORAHS Sladesville 12.0 in 0957 AM 02/01 Trained Spotter Ocracoke 0.2 ESE 3.0 in 0800 AM 02/01 COCORAHS ...Jones County... Trenton 16.5 in 0706 AM 02/01 Public Trenton 15.0 in 0839 AM 02/01 Broadcast Media Wise Forks 13.0 in 0930 AM 02/01 Public ...Lenoir County... Pink Hill 16.0 in 0648 AM 02/01 Public Kinston 5.1 WNW 15.0 in 0700 AM 02/01 COCORAHS Kinston 14.0 in 0703 AM 02/01 Trained Spotter 4 ENE Sandy Bottom 13.5 in 0728 AM 02/01 Trained Spotter 1 NE Kinston 13.0 in 0820 AM 02/01 Kinston 4.6 ESE 11.5 in 0700 AM 02/01 COCORAHS La Grange 5.5 NE 10.5 in 0720 AM 02/01 COCORAHS Pink Hill 2.5 NE 10.0 in 0810 AM 02/01 COCORAHS ...Martin County... 3 W Williamston 13.0 in 0951 AM 02/01 Public Williamston 9.5 in 0741 AM 02/01 Public Williamston 8.9 SSE 6.5 in 0741 AM 02/01 COCORAHS ...Onslow County... Swansboro 17.0 in 0718 AM 02/01 Public 2 NW Hammocks Beach State Pa 16.0 in 0730 AM 02/01 Public 3 S Silverdale 16.0 in 0900 AM 02/01 NWS Employee Half Moon 14.0 in 0922 AM 02/01 Public 1 SSW Holly Ridge 13.0 in 0646 AM 02/01 Public 2 NW Midway Park 13.0 in 0720 AM 02/01 Public Jacksonville 3.3 W 13.0 in 0800 AM 02/01 COCORAHS 3 NW Half Moon 13.0 in 1021 AM 02/01 Public 1 S Camp Lejeune Center 13.0 in 1121 AM 02/01 Public Holly Ridge 3.7 E 12.5 in 0700 AM 02/01 COCORAHS Richlands 12.5 in 1119 AM 02/01 Public 4 SE Cypress Creek 12.5 in 1201 PM 02/01 Trained Spotter 2 SE Jacksonville 12.3 in 0630 AM 02/01 Trained Spotter 2 SSE Pumpkin Center 12.0 in 0907 AM 02/01 Trained Spotter Kellum 11.0 in 0700 AM 02/01 Trained Spotter ...Pamlico County... Reelsboro 19.0 in 0727 AM 02/01 Public Grantsboro 18.0 in 0639 AM 02/01 Public 1 SE Minnesott Beach 17.0 in 0631 AM 02/01 Public Bayboro 14.0 in 0728 AM 02/01 Public Bayboro 3 SW 13.0 in 0700 AM 02/01 COOP Merritt 1.5 WSW 13.0 in 0700 AM 02/01 COCORAHS ...Pitt County... 4 WSW Greenville 15.0 in 0830 AM 02/01 Public 4 WNW Falkland 14.0 in 0956 AM 02/01 Trained Spotter Grifton 13.5 in 0923 AM 02/01 Public 1 W Shelmerdine 12.5 in 0730 AM 02/01 Public 1 SE Winterville 12.2 in 0900 AM 02/01 Public 1 SE Winterville 12.1 in 0921 AM 02/01 Public Greenville 5.7 NW 12.0 in 0700 AM 02/01 COCORAHS 1 S Dowdy Ficklen Stadium 12.0 in 0729 AM 02/01 Public Farmville 0.8 ESE 11.7 in 0700 AM 02/01 COCORAHS 1 NNE Bell Arthur 11.5 in 0755 AM 02/01 Public 1 N Ayden 11.0 in 0912 AM 02/01 Greenville 5.0 SE 10.5 in 0800 AM 02/01 COCORAHS 2 N Winterville 10.0 in 1031 AM 02/01 Public 4 SE Winterville 9.0 in 0914 AM 02/01 Public 2 NNE Winterville 7.5 in 1025 AM 02/01 Trained Spotter ...Tyrrell County... Gum Neck (COOP) 16.1 in 0700 AM 02/01 COOP Columbia 4.9 W 11.0 in 0700 AM 02/01 COCORAHS 1 NNW Alligator 10.0 in 0554 AM 02/01 Public &&