All Activity
- Past hour
-
We are so close now you can feel it, smell, it is literally on the doorstep . Just one more knock and the door opens
-
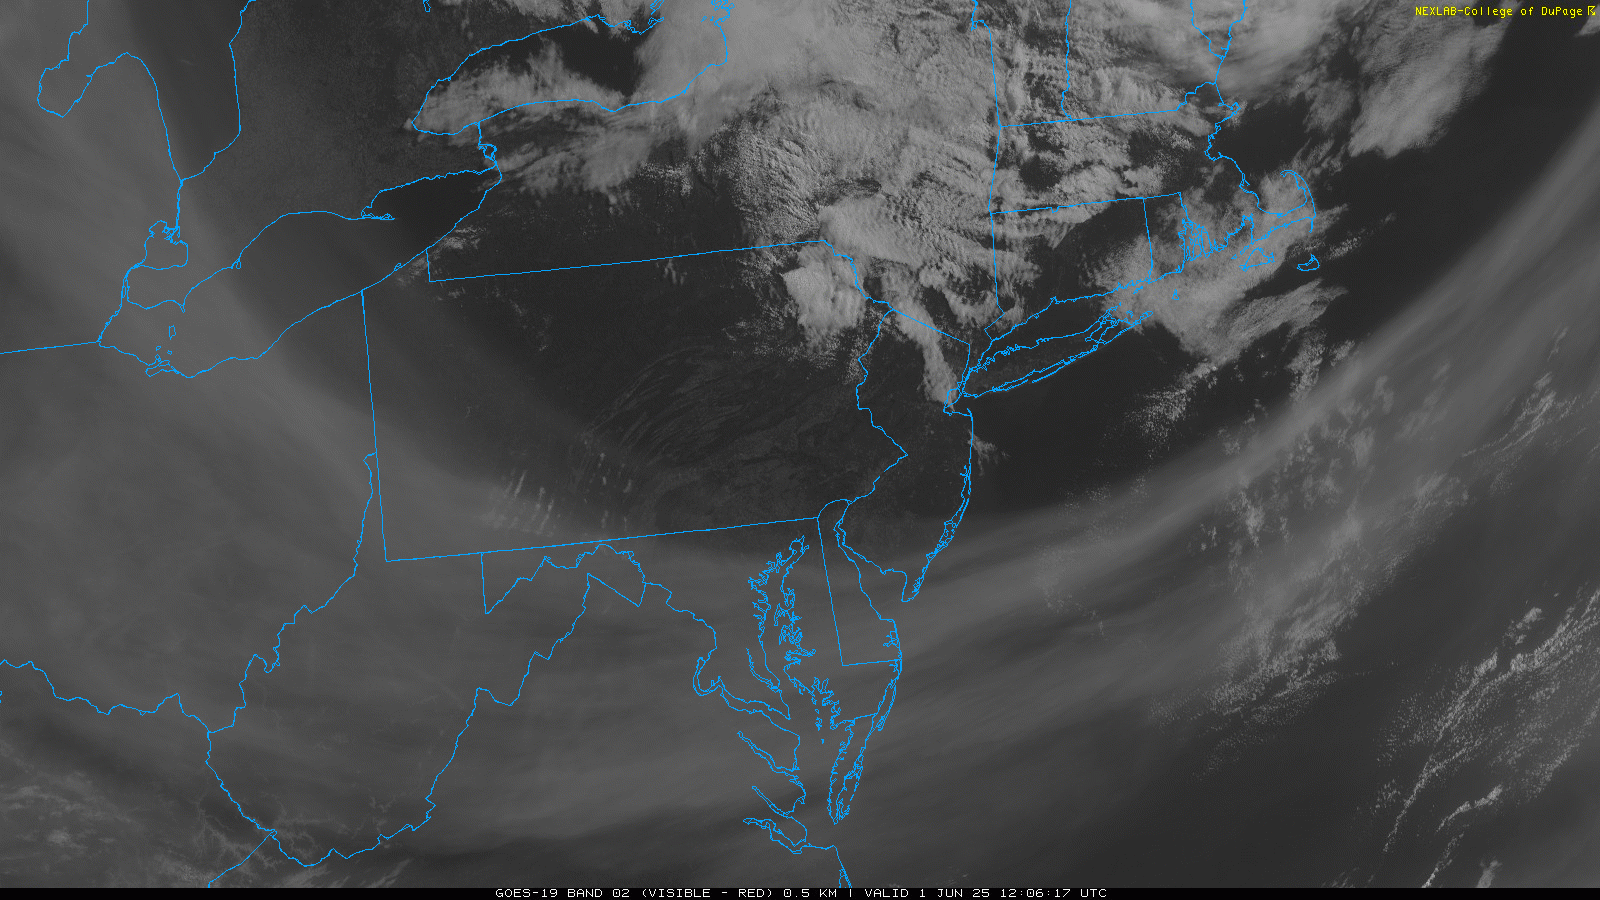
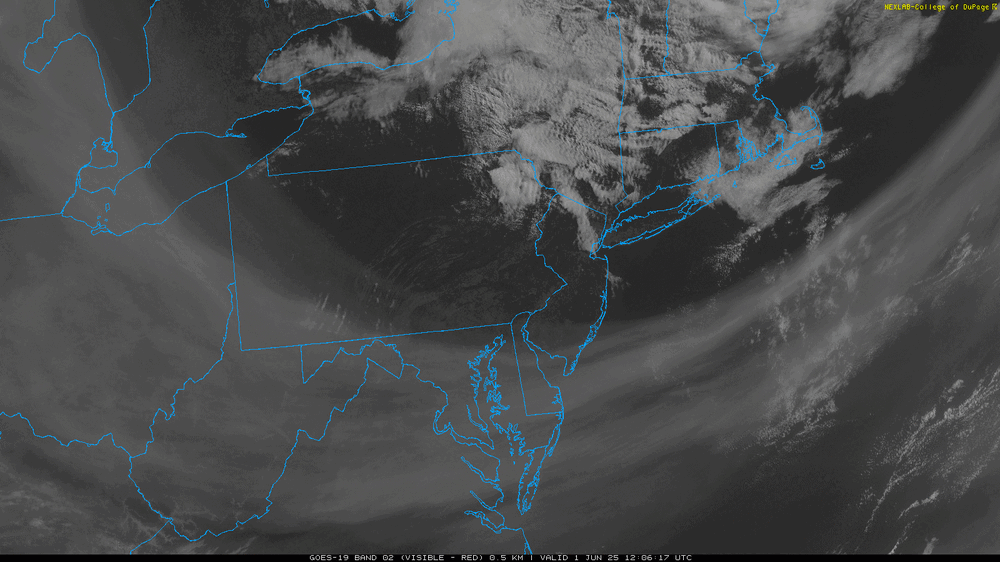
The current visible shot of the smoke looks fake https://weather.cod.edu/satrad/?parms=subregional-New_England-truecolor-24-0-100-1&checked=map&colorbar=data
-
Throw your darts. There isn’t enough initialization data to make such predictions. And where we have good data coverage, it’s accuracy (inherent error) out to month long timescales that bites. We’d all be much better off killing this aspect of the science. Do it for fun; but let’s stop there.
-
Beautiful out, for now. Little chilly for June but I'd take it over swamp weather. These clear blue skies won't last long unfortunately. Some models have that band of smoke moving north into our area by the afternoon
-
53kts at HYA yesterday. Sound about right. Was wild. I guess there were a bunch of power outages.
-
still waiting for yesterdays "rains" and "nor'easter"
-
tough being correct
-
Tuesday through Thursday midday look phenomenal after that TBD... The front Thursday PM may try to stall somewhere in New England
-

2025-2026 ENSO
PhiEaglesfan712 replied to 40/70 Benchmark's topic in Weather Forecasting and Discussion
The 13-14 analog wasn't even a good match for this past winter. The 12-13 analog was a much better match, as that was a deep -PDO that peaked in the fall. This past winter was colder than 12-13, and had comparable snow totals in most areas, in the Eastern US. Those predicting a 13-14 analog for 24-25 were just grasping on straws. In 13-14, you still had a -PDO, but it was generally trending towards 0, which was what we have this year. (And of course, the WPAC jet cooperated, unlike in most of 11-12 and 12-13.) If we can have a similar WPAC jet to 13-14, I think a cold and snowy winter in 25-26 is pretty much locked in. -
Do you still have power?
-
We are so close now you can feel it, smell, it is literally on the doorstep . Just one more knock and the door opens
-
It looked like it on satellite, so I checked out LWX and they mentioned it as a possibility. Not sure if the current sat loop is showing smoke or high clouds or a mix of both, but HRRR vertically integrate smoke loop shows a swath of it to the west.
-
The year of the incessant West wind continues. Easily had some 40mph gusts on the beach yesterday. Full on sand storm. People would walk down towards the water and quickly turn around after a couple minutes of sand blasting.
-
Been a tough warm season for him.
-
Tough Saturday in Tolland. You just hate to see it when someone has high expectations.
-
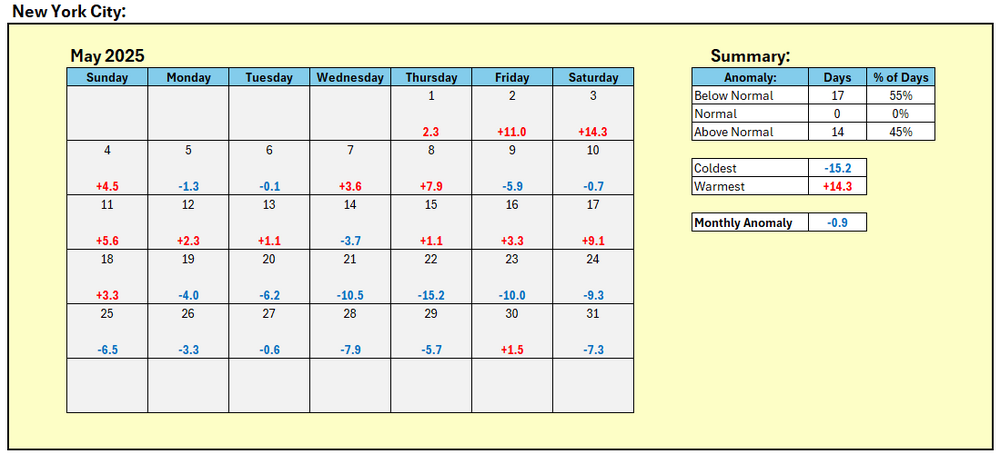
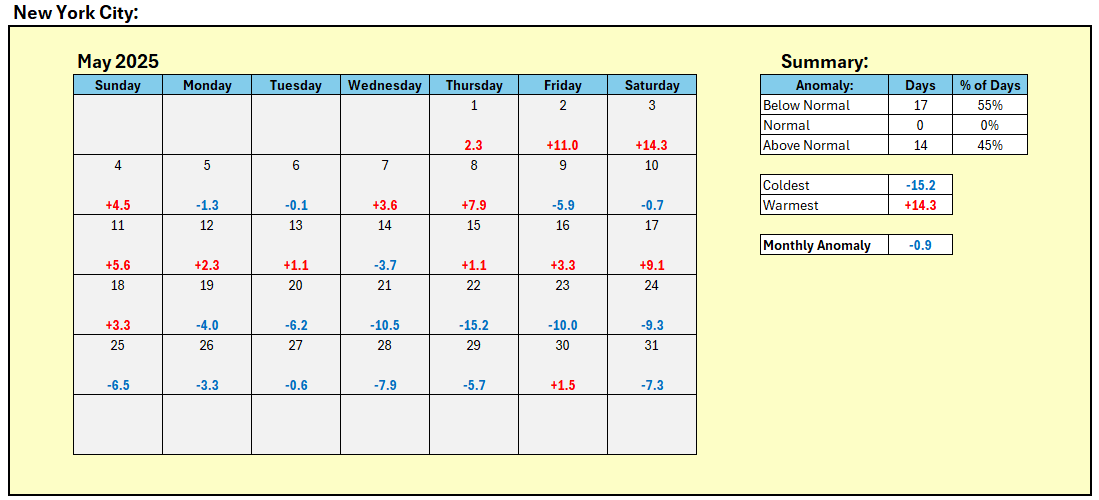
May was a rare month for us when we were all over +5 around the 20th and only a little above average to close out the month. EWR….+1.0° NYC….-0.9° LGA…..-0.5° HPN….+0.7 BDR….+0.2 JFK…..+2.1° ISP…...+1.9° AVG…..+0.7°
-
Was just about to say that. Looks like smoke aloft this morning.
-
Yea, this weather ain’t it. And it appears we’re going to be contending with Canadian wildfire smoke…at least at the upper levels.
-
When electricity was relatively cheap...
-
Maybe you've already done this . . . I wiggle the inner tube until it's right at 1.00" then dump it. Next is placing the funnel onto the inner tube and pour some of the outer tube contents - if there's more than 1" one must remember (or record) partial fills of the inner (I try to stop the pour in the 0.8-0.9" range) remember/record/dump then repeat until the outer tube is empty. Can be 'interesting' if there's several inches in the 4" tube and it's still pouring. In that case I take out a small pail, dump both tubes into it and head inside with the inner tube to measure in peace.
-
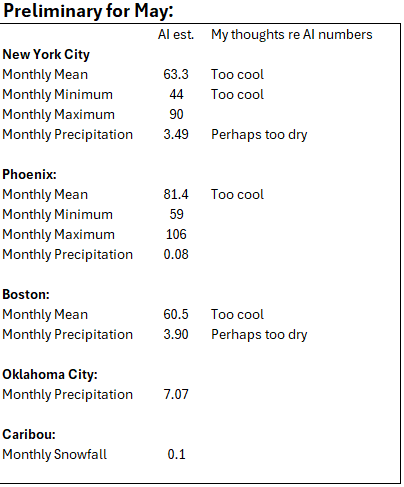
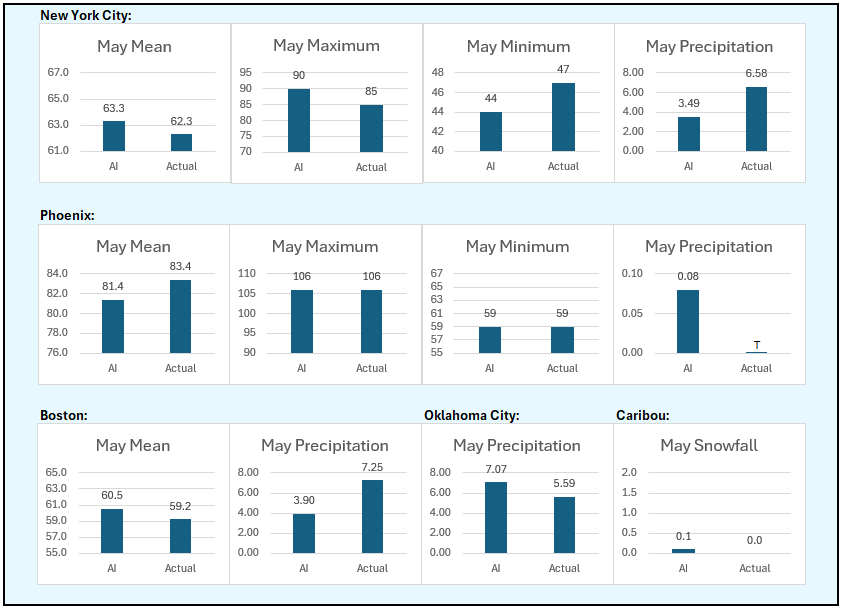
The final AI verification for May:
-
Long range turning to shit again, why is it so hard for these models to jump into summer in New England..
-
The lack of 90° heat this May in the past for the warm spots like Newark has resulted in summers which haven’t exceeded 40 days going over 90°. So this early spring signal would suggest that top tier years for 90° days like 2010 and 2022 when Newark approached 50 days reaching 90° won’t occur this summer. So we are probably in for more onshore flow again this summer with areas west of NYC seeing the strongest heat and cooling sea breezes further east. The only year in the past to reach 40 days with no 90° temperatures at Newark in May was 1983. But that was a much different super El Niño pattern. It was also in the more westerly flow era. These days we have been seeing more summer onshore flow with the elongated ridge to the north and east of New England. All years with no 90° heat at Newark in May Annual and Monthly Number of Days Max Temperature >= 90 for NEWARK LIBERTY INTL AP, NJ following no 90° days in May Click column heading to sort ascending, click again to sort descending. 2025 0 0 M M M M M 0 2020 0 0 5 17 9 0 0 31 2014 0 0 2 8 2 3 0 15 2009 3 0 0 1 10 0 0 14 2008 0 0 6 11 2 3 0 22 2005 0 0 10 11 12 4 0 37 2003 0 0 5 8 7 0 0 20 1997 0 0 7 10 3 0 0 20 1990 2 0 5 9 9 1 0 26 1989 0 0 4 12 8 3 0 27 1984 0 0 8 6 8 0 0 22 1983 0 0 7 15 11 7 0 40 1982 0 0 1 10 1 0 0 12 1976 2 0 7 2 4 0 0 15 1973 0 0 5 9 12 5 0 31 1972 0 0 0 16 4 1 0 21 1971 0 0 6 7 7 2 0 22 1968 0 0 4 9 9 1 0 23 1967 0 0 5 1 1 0 0 7 1966 0 0 10 14 8 1 0 33 1963 0 0 6 11 3 0 0 20 1961 0 0 4 13 8 9 0 34 1960 1 0 3 2 8 1 0 15 1958 0 0 2 11 6 2 0 21 1954 0 0 5 10 3 0 0 18 1952 0 0 8 17 2 4 0 31 1950 0 0 8 6 3 1 0 18 1946 0 0 5 5 2 0 0 12 1940 0 0 2 11 1 1 0 15 1938 0 0 4 4 9 0 1 18 1935 0 0 1 11 2 0 0 14 Years at Newark with 40-50 days reaching 90° with multiple days over 90° in May Monthly Number of Days Max Temperature >= 90 for NEWARK LIBERTY INTL AP, NJ from April to October Click column heading to sort ascending, click again to sort descending. 2010 1 2 13 21 11 6 0 54 2022 0 4 6 20 18 1 0 49 1993 0 3 9 22 11 4 0 49 1988 0 1 10 15 17 0 0 43 2021 0 4 12 11 13 1 0 41 2002 4 1 5 16 14 1 0 41 1991 0 8 10 9 12 2 0 41 2016 0 3 3 16 13 5 0 40 1983 0 0 7 15 11 7 0 40 1959 0 5 5 8 15 6 1 40 Recent years with 50 days reaching 90° at Newark had demonstrated the major heat potential in May. This year Newark only made it to 88° in May. 2022 made it to 98° in May. 2010 reached 95° in May Monthly Highest Max Temperature for NEWARK LIBERTY INTL AP, NJ Click column heading to sort ascending, click again to sort descending. 2025 87 88 M M M M M 88 April to October Monthly Highest Max Temperature for NEWARK LIBERTY INTL AP, NJ Click column heading to sort ascending, click again to sort descending. 2022 88 98 96 102 101 93 76 102 April to October Monthly Highest Max Temperature for NEWARK LIBERTY INTL AP, NJ Click column heading to sort ascending, click again to sort descending. 2010 92 95 98 103 98 98 79 103
- Today
-
PRECIPITATION (IN) YESTERDAY 0.21 amusingly bad, at least fact check first lol
-
May was essentially a tale of two months in NYC. The first half was very warm. The second half was very cool.