All Activity
- Past hour
-
Got some nice crackling thunder and heavy rain this morning. Quality summertime storm.
-

July 2025 Obs/Disco ... possible historic month for heat
dendrite replied to Typhoon Tip's topic in New England
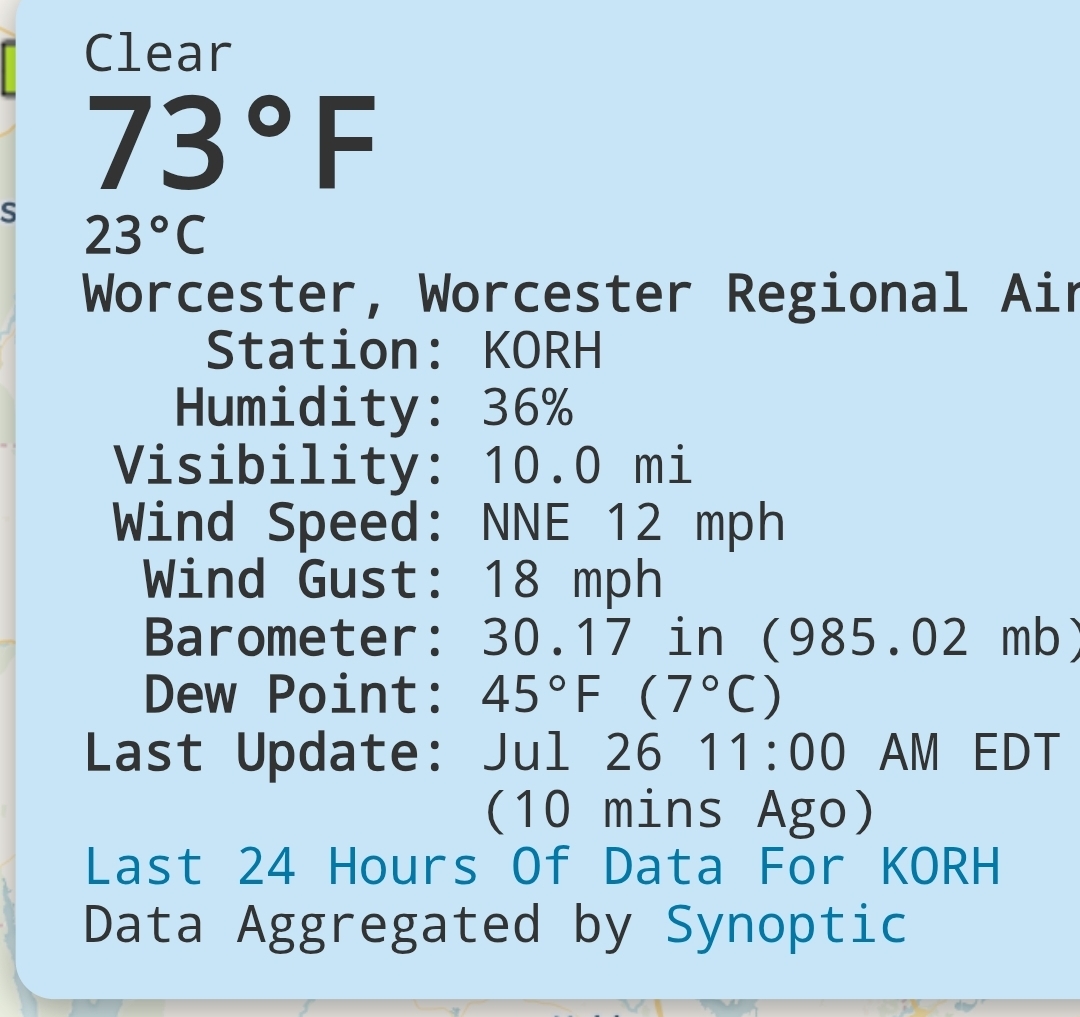
AQI hit 176 here. Almost has an electrical burning smell to the air…not the usual smoke smell. -
LOL!! Actually impervious to conspiracy climate theorist who support doom and gloom and for some reason try to convince folks there is actually something we can do to impact our climate. A great example of one of these conspiracy theorist is our old buddy Al Gore - he is my favorite prophet of climate doom and gloom! Here is Gore speaking at the WEF: "[Greenhouse gases are] now trapping as much extra heat as would be released by 600,000 Hiroshima-class atomic bombs exploding every single day." "That's what's boiling the oceans... and creating the droughts, and melting the ice, and raising the sea level, and causing these waves of climate refugees, predicted to reach one billion in this century." That is just pure loony tunes stuff!!! I wonder how many folks on this forum actually believe any of the above from our pal Al??
-
the politics threads have been hidden or deleted. again, my apologies for your loss, all of our loss really. his life of service to others and the values he held are to be celebrated and emulated.
-

July 2025 Discussion-OBS - seasonable summer variability
bluewave replied to wdrag's topic in New York City Metro
Yeah, easily the worst air quality of July so far here just east of HVN. Jul 26, 11:20 am 84 61 45 84 NE 8 4.00 Haze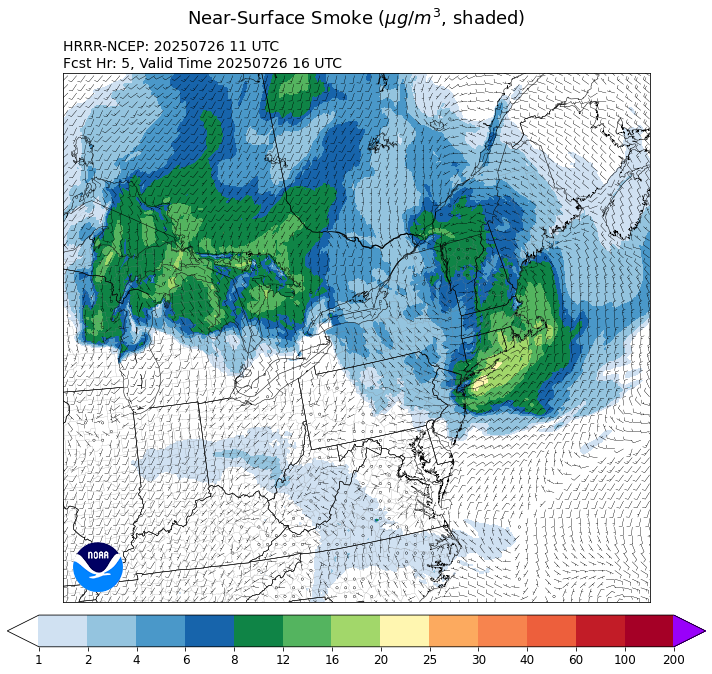
-
Pretty good call here. Hotter wx with stms starting this weekend into early next week for the sub.
-

July 2025 Obs/Disco ... possible historic month for heat
Torch Tiger replied to Typhoon Tip's topic in New England
Stein has settled in the past few weeks. Hopefully a few showers tomorrow, otherwise not too many chances on the horizon. -
Actually it isn't. That's USHCN data, so stns are the same. That dataset doesn't flip stns around. If data is missing, they estimate for the month. Secondly, I've seen a comparison of aftrn n morning stns for max temps, and the pattern is very similar. Sorry I don't have those graphs. The issue we are seeing now isn't max temps so much as higher mins, and less winter cold.
-

2025-2026 ENSO
michsnowfreak replied to 40/70 Benchmark's topic in Weather Forecasting and Discussion
You WANT more 90s? Glutton for punishment Here the dustbowl saw a massive increase from previous decades then calmed down some in the 1960s. Avg annual days of 90+ at Detroit (1870s and 2020s not full decade). 1870s- 4 1880s- 5 1890s- 9 1900s- 6 1910s- 11 1920s- 9 1930s- 19 1940s- 16 1950s- 15 1960s- 11 1970s- 12 1980s- 13 1990s- 12 2000s- 10 2010s- 16 2020s- 12 -
July 2025 Obs/Disco ... possible historic month for heat
dendrite replied to Typhoon Tip's topic in New England
Right into CT
-
July 2025 Discussion-OBS - seasonable summer variability
nycwinter replied to wdrag's topic in New York City Metro
what a refreshing day it today those northeast winds this time of year always feel good.. -

July 2025 Obs/Disco ... possible historic month for heat
kdxken replied to Typhoon Tip's topic in New England
I knew the dew points were going to lower but wasn't expecting mid-forties. Pleasant surprise.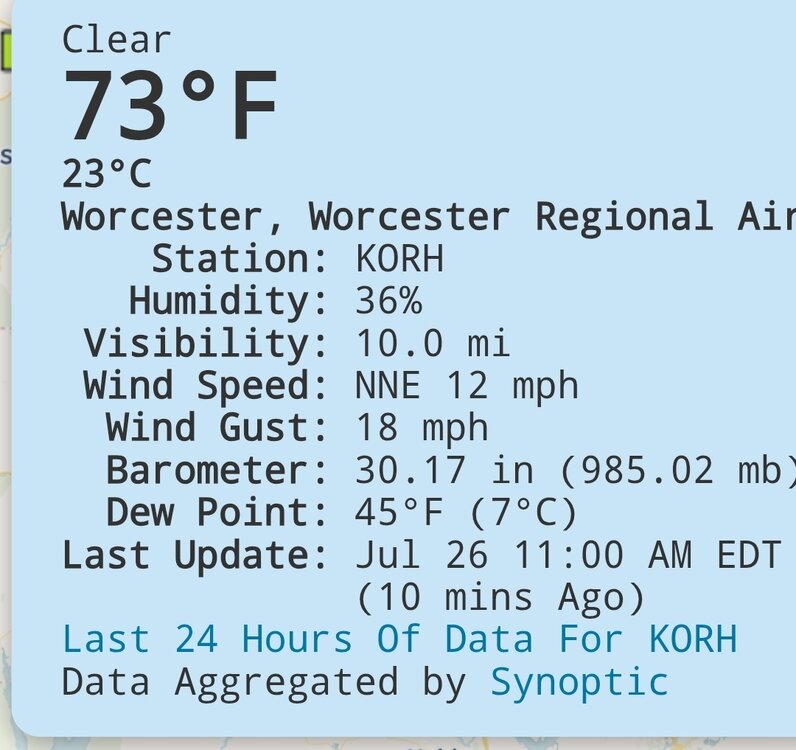
-
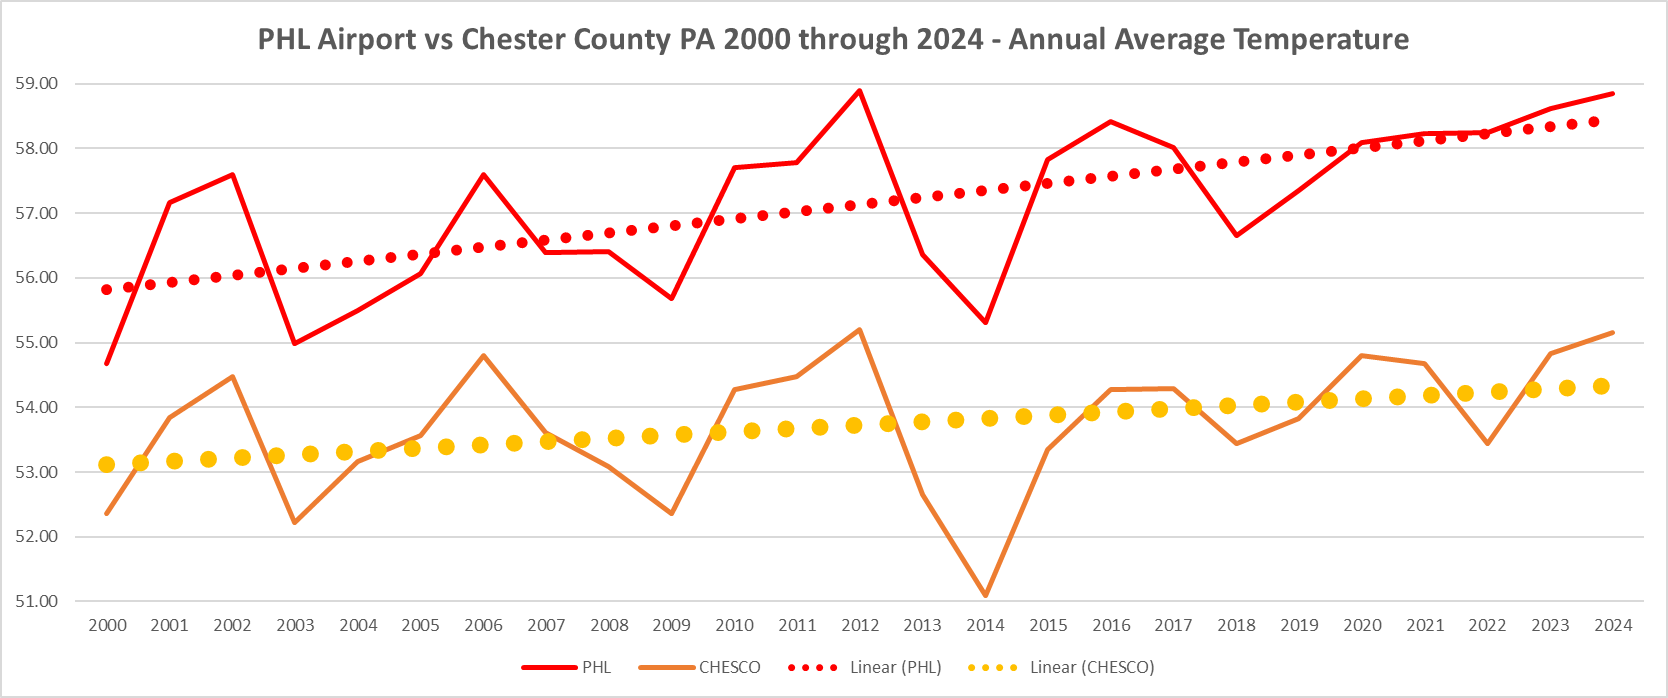
 Fortunately we have actual factual raw data to show how PHL Airport is quite noticeably heating at a rate quite higher compared to PHL during our current warmer climate cycle. The last 25 years as the UHI continues to worsen is the telltale sign based on the analysis. The differences between PHL and Chesco continue to steepen. If we break the average temperature change down to simple 5 year increments highlighting the growing gap between PHL and Chester County we can clearly see the worsening urban heat island that is PHL. From 2000-2004 +5.2% / 2005 - 2009 +5.5% / 2010-2014 +6.9% / 2015-2019 +7.1% / 2020-2024 +7.1% - can't be much clear than that! The gap continues to widen - I suspect with the PHL problems we may start seeing near double digit % gaps with the delta widening from where it is now in the +3.8 degree difference to somewhere near 4.5 degrees within the next decade or so!
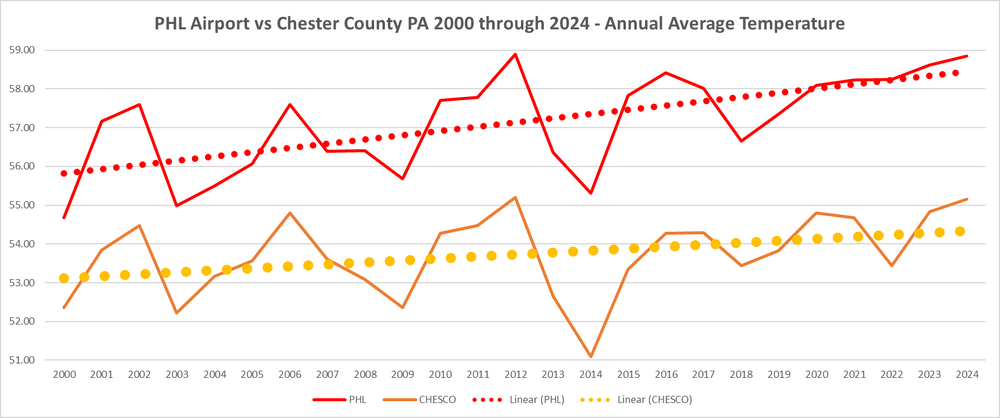
-

2025-2026 ENSO
40/70 Benchmark replied to 40/70 Benchmark's topic in Weather Forecasting and Discussion
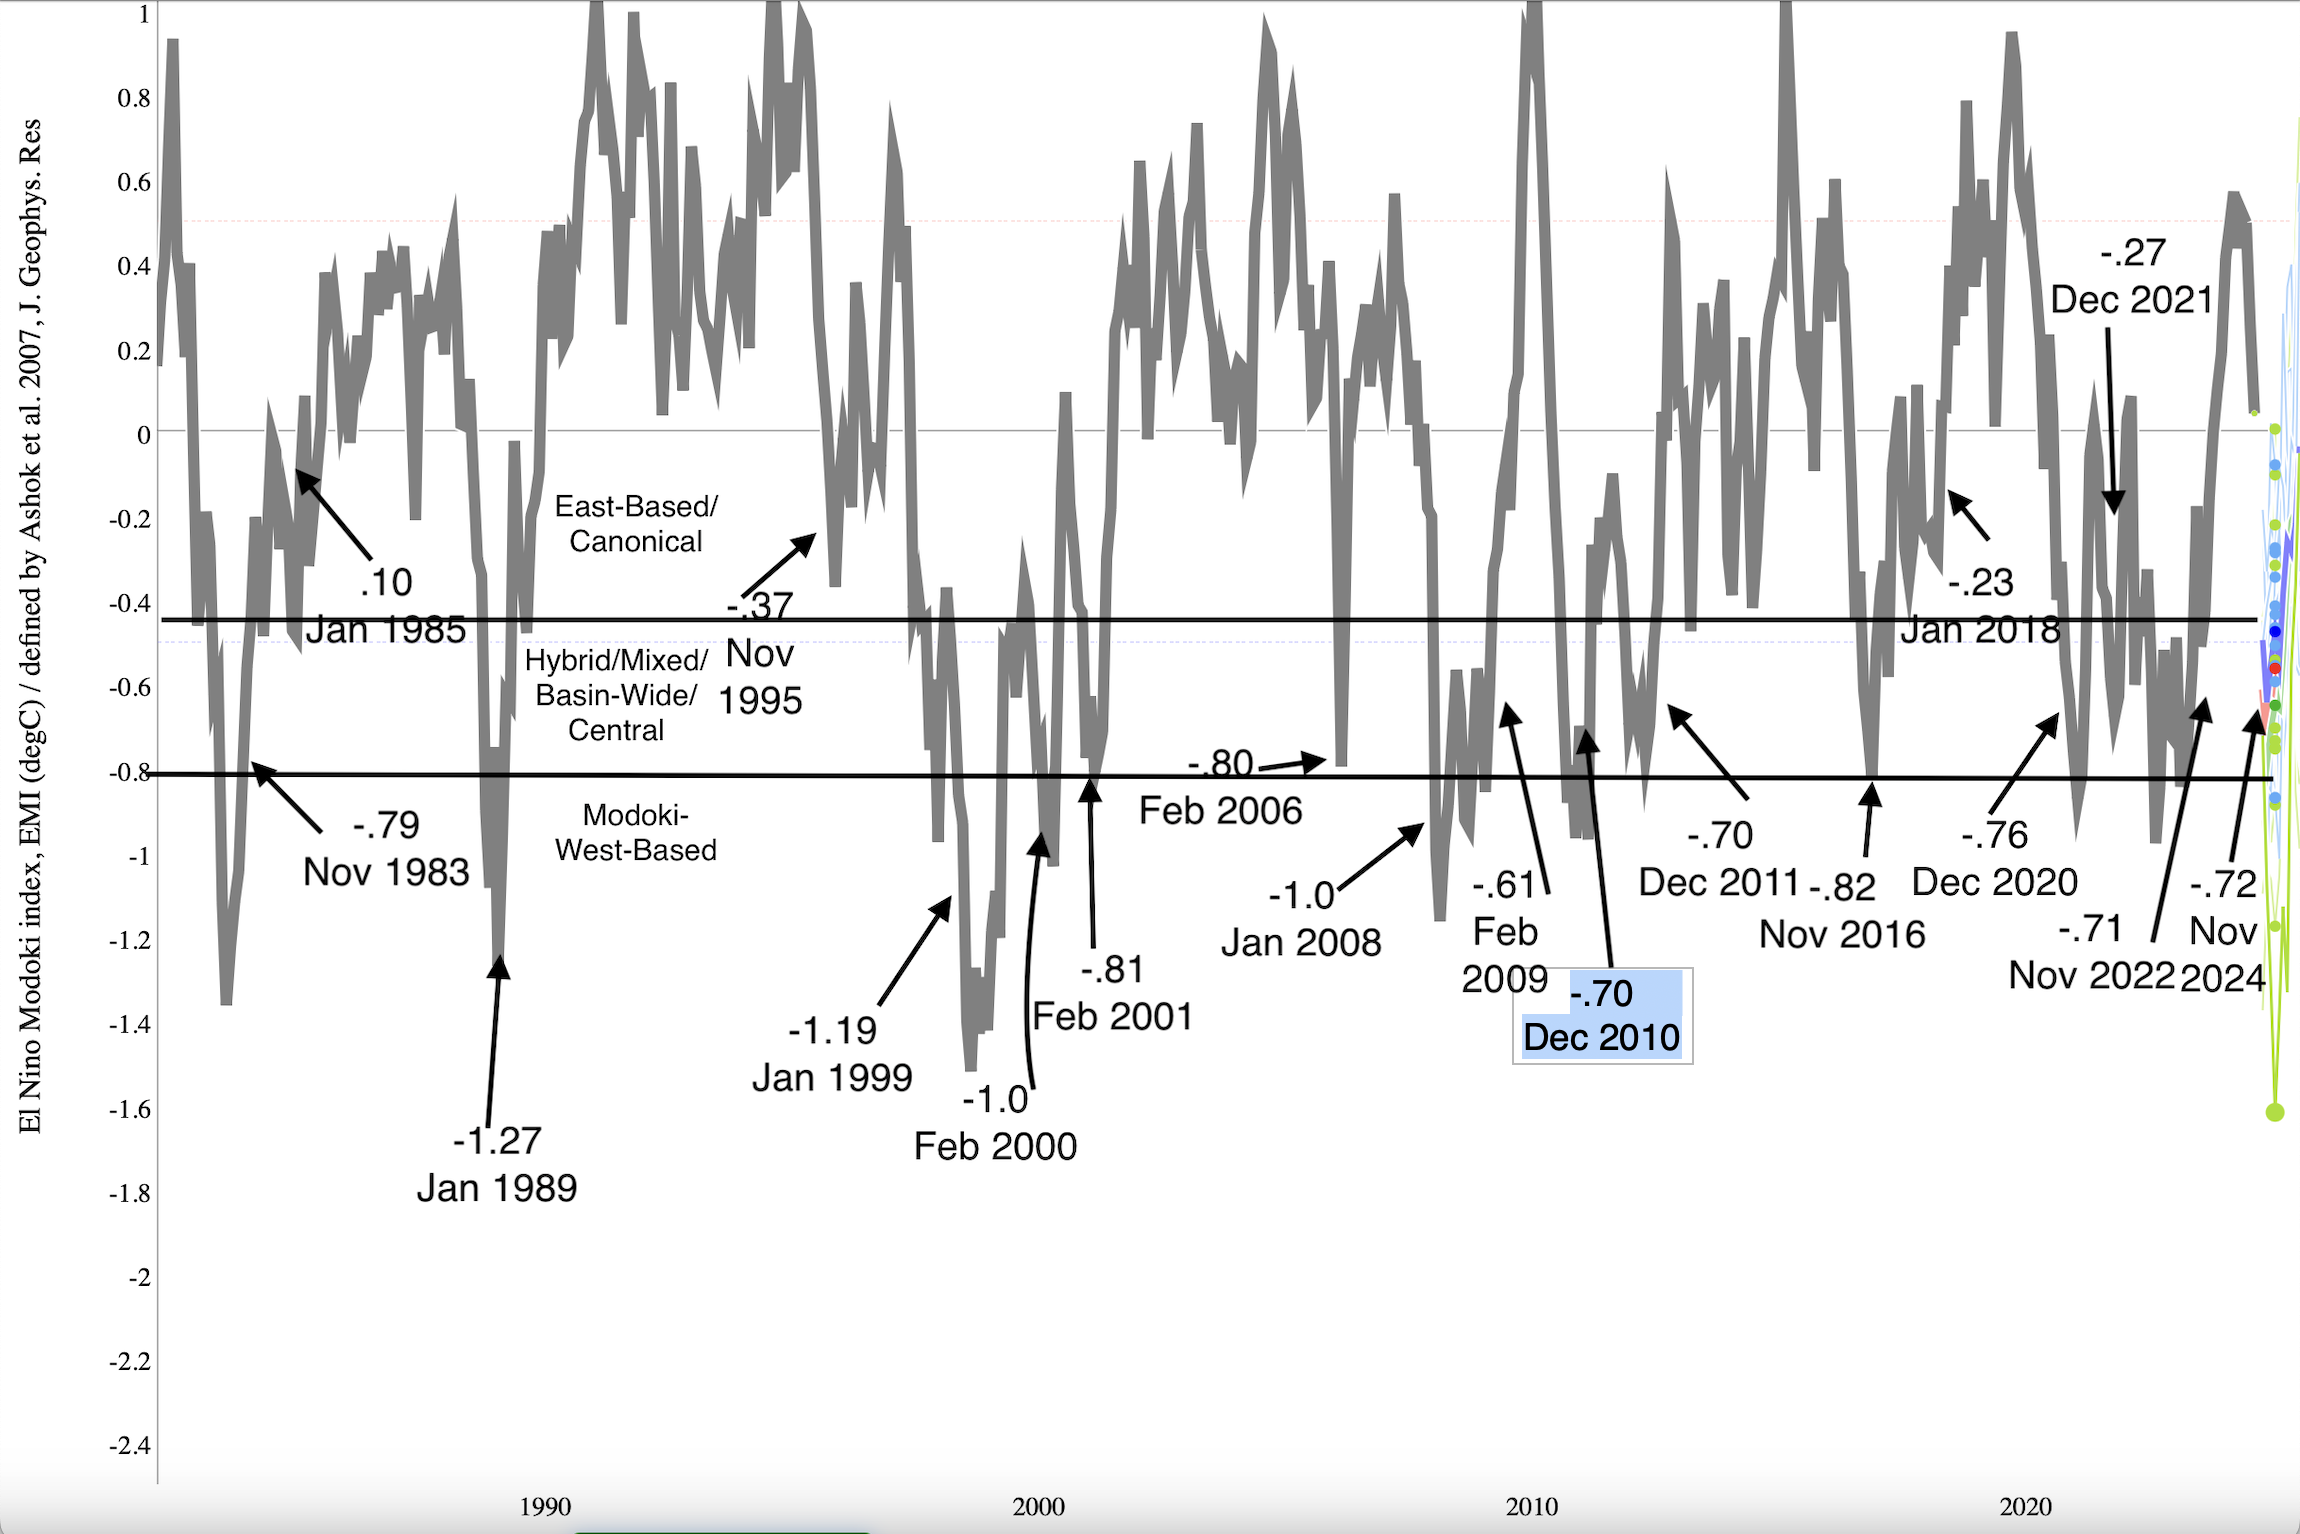
@snowman19 The fact that region 1.2 is so small skews the EMI away from heavily east based events....if you look at this graphic I made of EMI rankings since 1980, the only event in positive territory is 1985, but weakly positive (east-based) events are still considered east-based. The Jamstec ensemble mean forecast is most similar to 1995, 2017 and 2021.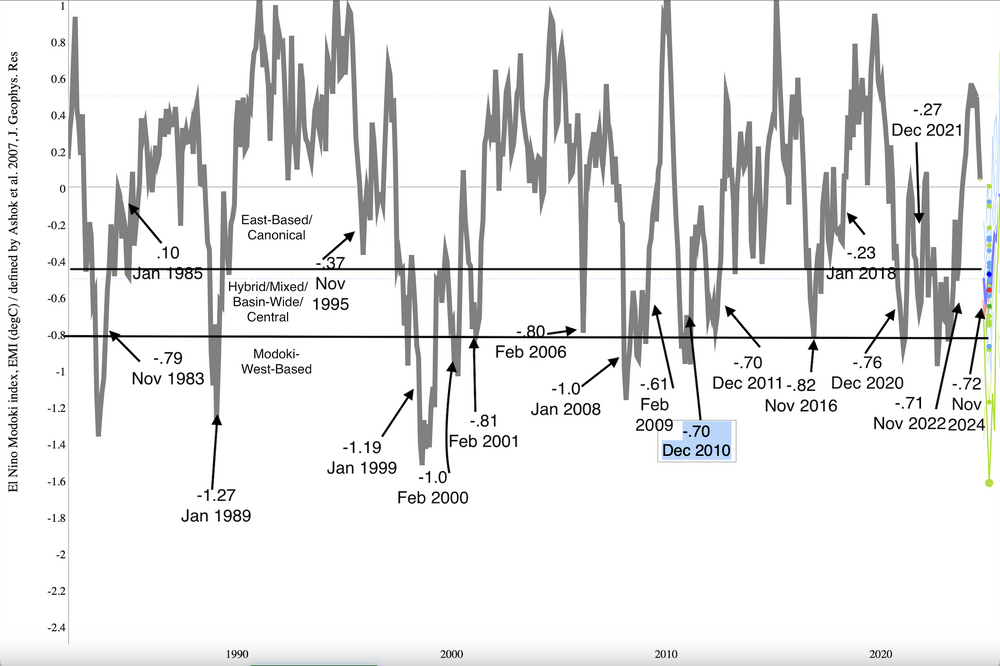
-

July 2025 Discussion-OBS - seasonable summer variability
IrishRob17 replied to wdrag's topic in New York City Metro
“Delightful” strong odor of wildfire out there today. - Today
-
Yes indeed, relief is on the way again! We had a nice couple of days earlier this week as well. As long as we get breaks every other week, I can cope with Summer heat.
-

2025-2026 ENSO
PhiEaglesfan712 replied to 40/70 Benchmark's topic in Weather Forecasting and Discussion
Summers at PHL since 2010: Colder than the 1981-2010 average: 2014, 2023 (although this one ends above average if we use JAS instead of JJA) Warmer than the 1981-2010 average, but colder than the 1991-2020 average: 2013, 2017 Warmer than the 1991-2020 average: all other years (2010-2012, 2015, 2016, 2018-2022, 2024) Looking ahead, it looks like 2018 (which is only 0.2 degrees above the 1991-2020 average) will fall below the 2001-2030 average. Along with years like 2001, 2006, and 2008, which were at the time Top 10 warmest summers on record. -

July 2025 Obs/Disco ... possible historic month for heat
weatherwiz replied to Typhoon Tip's topic in New England
Definitely Smokey out there and at ground level. Clear smell of smoke -
2025-2026 ENSO
40/70 Benchmark replied to 40/70 Benchmark's topic in Weather Forecasting and Discussion
It certainly doesn't argue for a Modoki. I agree that it isn't east-based in the sense that it matches up with the most extreme members of that grouping, but region 1.2 is so small that it doesn't weight the index much. When considering the subsurface cold pool is not below region 4 and is under region 3, the EMI would be biased slightly east, as the JAMSTEC data forecasts. I do agree that it isn't a huge deal since it will be so weak.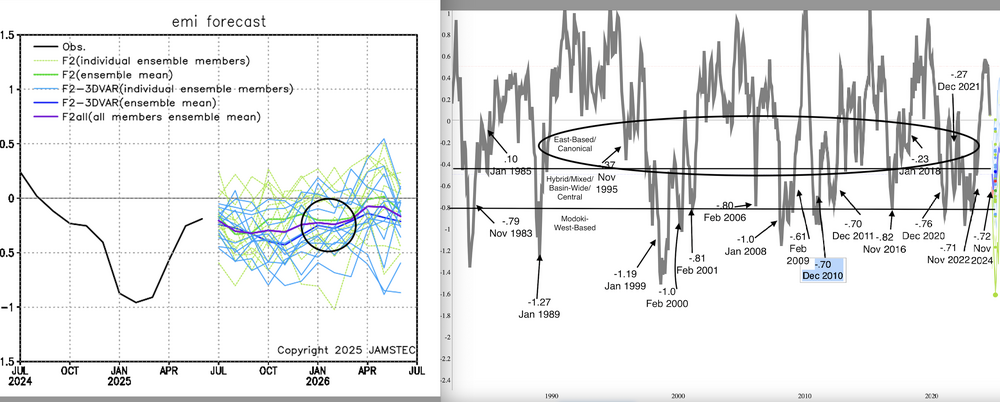
-
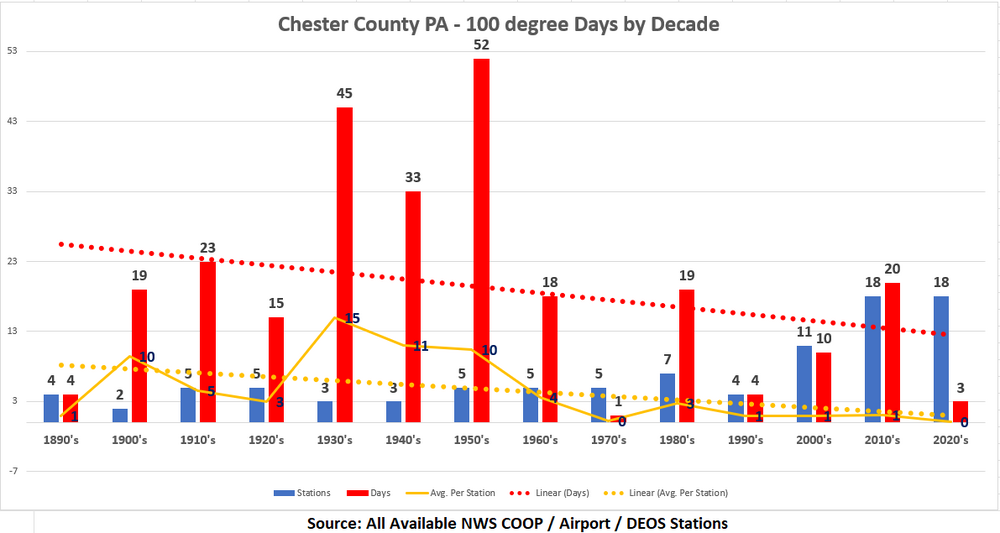
Below is an analysis of excessive heat - represented by temperatures exceeding 100 degrees in Chester County PA by decade from the 1890's through today. There is a clear trend for less excessive heat days with 100-degree readings becoming a relatively rare event compared to the 1900's through the 1950's. On average Chester County PA is down to maybe 1 time per station per decade. The below shows the number of days, average days per station - this is included to take into account many less stations prior to the 1990's. Of interest is even though there are more current stations at similar elevations relatively close to those older historic stations excessive heat is just not like it was for our parents and grandparents.
-
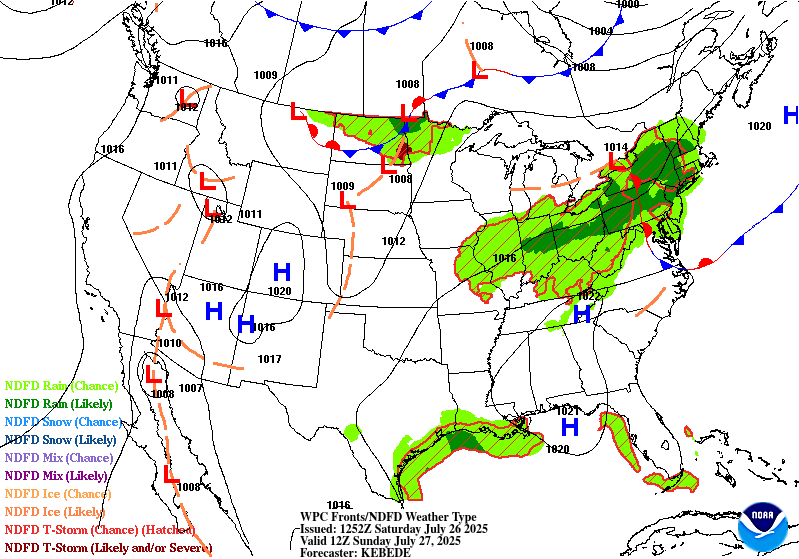
After reading this from the GSP NWS, I am looking forward to next weekend. .LONG TERM /TUESDAY THROUGH FRIDAY/... As of 139 AM EDT Friday: Deep upper ridging will continue through the middle of the week, and as a result widespread heat issues will continue at least through Wednesday. Meanwhile, a robust 500mb low will develop over eastern Canada, gaining momentum and pivoting into Quebec on Thursday...and resulting in markedly lowered heights over the Southeastern U.S. This should, at long last, bring an end to the heat wave. Models begin to diverge toward the end of the period, but the general consensus is that sometime on Friday into next weekend, a cold front will dig out of the Ohio Valley into the Carolinas, spurring an increase in shower/thunderstorm activity while ushering a cooler, drier air mass into the region. Despite ensemble variability by this point, confidence is improving in low severe potential with this system...as even the more aggressive end of the ensemble envelop keeps deep shear too low for anything more than loose organization, and a distinct lack of dry air aloft should keep DCAPE limited.
-
Below is an analysis of excessive heat - represented by temperatures exceeding 100 degrees in Chester County PA by decade from the 1890's through today. There is a clear trend for less excessive heat days with 100-degree readings becoming a relatively rare event compared to the 1900's through the 1950's. On average Chester County PA is down to maybe 1 time per station per decade. The below shows the number of days, average days per station - this is included to take into account many less stations prior to the 1990's. Of interest is even though there are more current stations at similar elevations relatively close to those older historic stations excessive heat is just not like it was for our parents and grandparents.
-
E PA/NJ/DE Summer 2025 Obs/Discussion
ChescoWx replied to Hurricane Agnes's topic in Philadelphia Region
Below is an analysis of excessive heat - represented by temperatures exceeding 100 degrees in Chester County PA by decade from the 1890's through today. There is a clear trend for less excessive heat days with 100-degree readings becoming a relatively rare event compared to the 1900's through the 1950's. On average Chester County PA is down to maybe 1 time per station per decade. The below shows the number of days, average days per station - this is included to take into account many less stations prior to the 1990's. Of interest is even though there are more current stations at similar elevations relatively close to those older historic stations excessive heat is just not like it was for our parents and grandparents.
-
2025-2026 ENSO
40/70 Benchmark replied to 40/70 Benchmark's topic in Weather Forecasting and Discussion
Completely agree with your bolded take. -
I don't think that means they've given up on Adley yet. (And the 1st pick is likely to become an OF, imo). Now I'm thinking they eventually alternate Basallo and Adley at DH...