All Activity
- Past hour
-
Moving this to banter, I installed a 8.5 kw system about the same time you did and also have 1 for 1 net metering. I don't have a minimum charge and have a large credit with the POCO for excess generation the system generates more power than my family uses on average. It was up to $1,200 last summer but the inverter died and was replaced (under warranty) and lost 2+ months of good generation (August-October). This winter has also been bad, February was the lowest generation month I've recorded since install, persistent snow and cold kept the panels covered. I still have 7 that have some snow on them even now. I would consider a heat pump but I don't like forced air heating. When the badly designed and installed forced air heat system in my house died 10 years ago, it was replaced with a high efficiency warm water baseboard system. That system operates at less than 130F and could be run off a warm water heat pump some day. But for the now the gas boiler installed 10 year ago has been economical and has operated flawlessly (and also provides hot water).
-
For me this week pushed this winter to an A. I think we’re now above our seasonal average and probably more snow to fall. The snowpack has been relentless and quite deep for a long stretches. We’ve had good cold. I don’t need to have a record breaking cold to rate the winter and A, just solid, long, lasting cold that gives us long periods of time where rain isn’t even a possibility. This is really been the best wall-to-wall winter in quite a long time for up here
-
Got some nice rolling boomers this morning. Love it.
-
We had good cold aside from 10 days or so. And CT was able to cash in a bit on smaller events so I can see why people from there would rate that period better than you or I.
-
Of course it nailed this stool-softener of a event, nut shipped on the blizzard getting up here.
-
Mid DEC until late JAN wasn't great. Mostly dry with a couple rain events, and a couple torch periods.
-
2 hour delay for my daughter here in Methuen.
-
NARCAN was coating to 2" last night....should have known, but + depth change maps were still like 2-5". Oh well....1.5" of mostly sleet......heavy as fu(k.
-

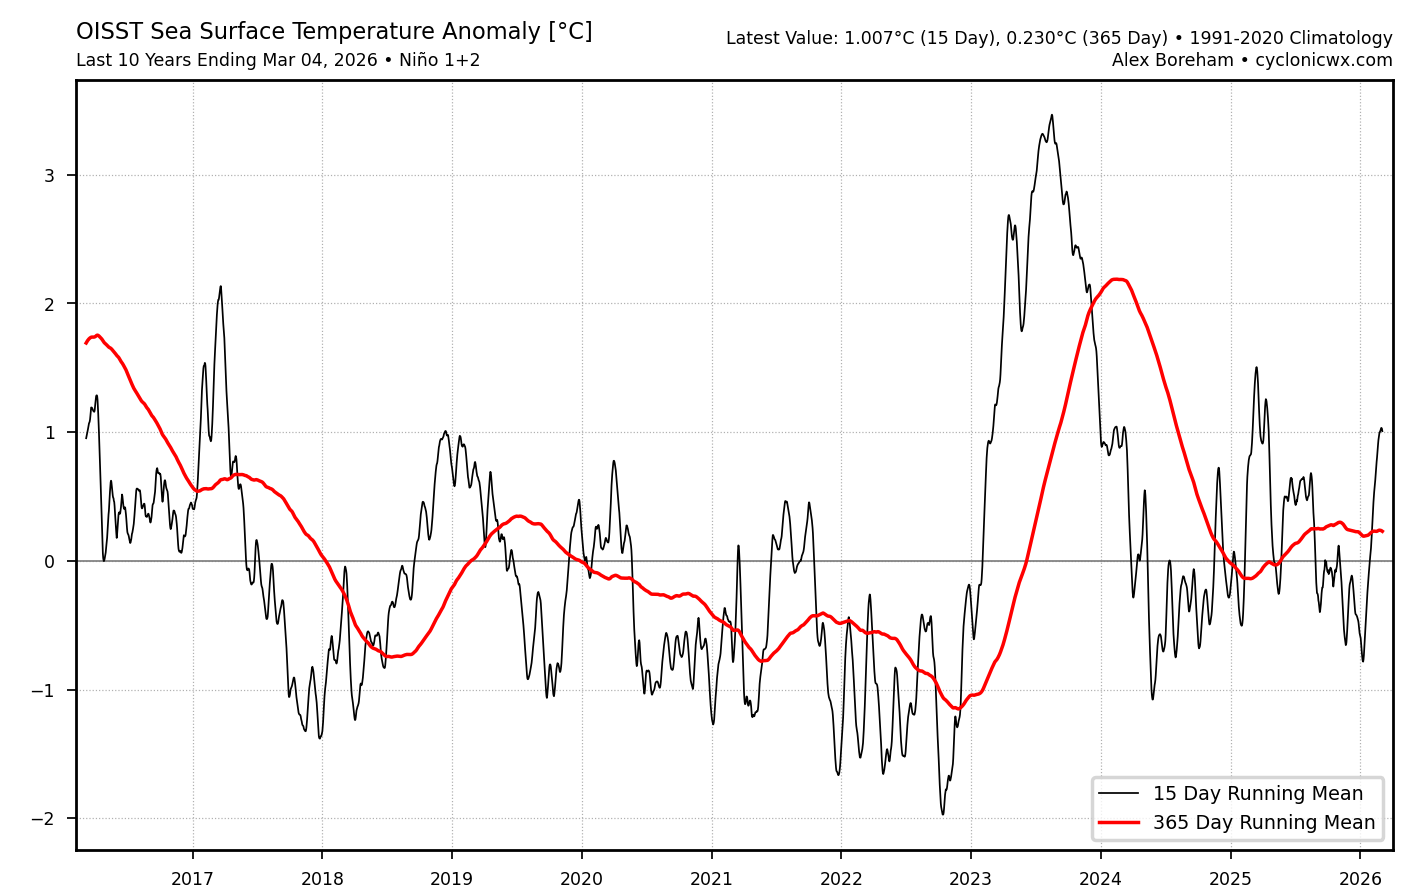
2026-2027 El Nino
bluewave replied to Stormchaserchuck1's topic in Weather Forecasting and Discussion
The Nino 1+2 based RONI was much higher and is better correlated with the global temperature jump since early 2023 with the Nino 1+2 ONI peaking over +3. The global temperature rise around the 2023-2024 El Niño was of a greater magnitude than just using a Nino 3.4 based RONI. This may be part of the reason that the winter of 2023-2024 had the atmospheric response and North American warmth greater than past even stronger El Niños .Plus the warmth extending west of the Dateline set records for those regions also. So the totality of the warmth gave a weaker RONI reading in 3.4. It also highlights the weakness of relying on RONI for El Niños is a warmer world. As RONI seems to be more relevant when we get La Ninas due to the SST gradient between the WPAC and EPAC. We still aren’t completely sure why the warming started so much earlier in 2023 than any event without the El Niño warming lag that we got in the past.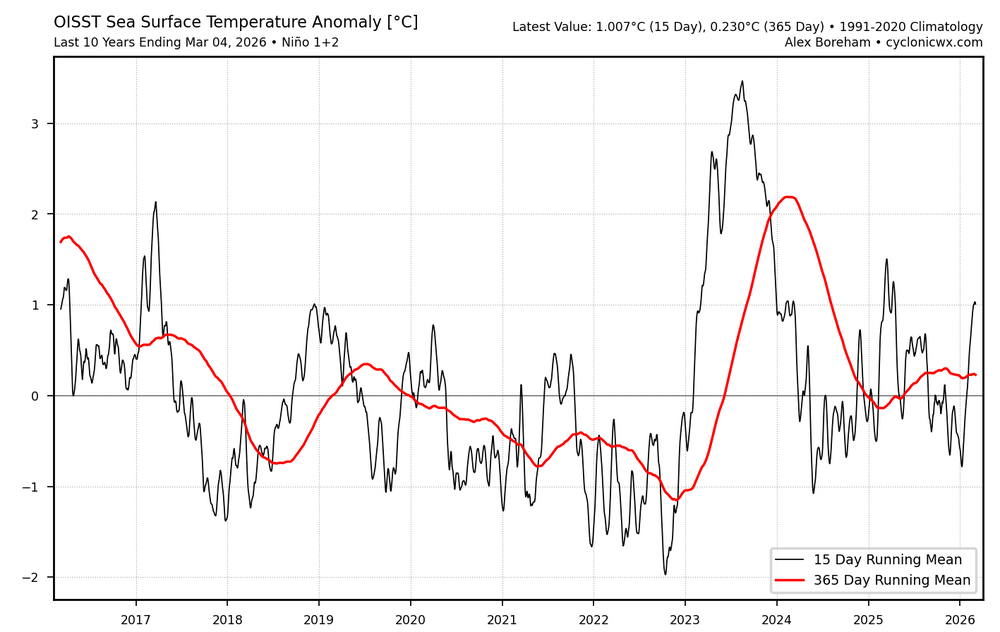
-
KBOS doesn’t have an on duty observer. Just someone that reports snowfall.
-
A drier week Today - Mar 12, still think we need to watch the front Wed 11th.
-

Central PA Spring 2026 Discussion/Obs Thread
Mount Joy Snowman replied to Voyager's topic in Upstate New York/Pennsylvania
Low of 39. Did much better than I thought here with .77" of rainfall. Off to have some beers with the fellas and head to The Giant Center this afternoon. Happy Friday, all. -
Records: Highs: EWR: 69 (2022) NYC: 68 (2022) LGA: 68 (2022) JFK: 63 (2004) Lows: EWR: 12 (2015) NYC: 5 (1872) LGA: 14 (2007) JFK: 13 (2015) Historical: 1872 - A cold wave hit the East coast sending the mercury plunging to 8 degrees below zero at Boston. It was the most severe March cold wave in modern history. (David Ludlum) 1875: Heavy snow fell in much of Arkansas, with the highest amounts in the central and west. Twelve inches of snow fell at Little Rock, which remains the highest calendar day snowfall on record in the capital city. 30 inches fell near Mena. 1900 - A chinook wind blowing down the slopes of the Rockies through Havre MT raised the temperature 31 degrees in just three minutes. (The Weather Channel) 1908: A tropical storm developed about 500 miles northeast of San Juan, Puerto Rice, on March 6. The storm intensified to Category 2 strength near the Leeward Islands of Saint-Barthélemy and Saint Kitts. Since 1842, this was the only hurricane to develop in the Atlantic Ocean in March. 1954 - Florida received its greatest modern-day snowfall of record, with 4.0 inches at the Milton Experimental Station. Pensacola FL equalled their 24-hour record with 2.1 inches of snow. (The Weather Channel) 1961: The maximum temperature for the date is 81 °F in Washington, DC. (Ref. Washington Weather Records - KDCA) 1962: The strongest nor'easter of this century struck the Mid-Atlantic Region on March 5-9, 1962. It is known as the "Ash Wednesday Storm" and caused over $200 million (1962 dollars) in property damage and significant coastal erosion from North Carolina to Long Island, New York. It was estimated to have destroyed or significantly damaged 45,000 homes in New Jersey alone. The Red Cross recorded that the storm killed 40 people. It hit during "Spring Tide." When the sun and moon are in phase, they produce a higher-than-average astronomical tide. Water reached nine feet at Norfolk (flooding begins around five feet). Houses were toppled into the ocean, and boardwalks were broken and twisted. The islands of Chincoteague and Assateague, Maryland, were completely underwater. Ocean City, Maryland, sustained significant damage, mainly to the island's south end. Winds up to 70 mph built 40-foot waves at sea. Heavy snow fell in the Appalachian Mountains. Big Meadows, southeast of Luray, recorded Virginia's greatest 24-hour snowfall with 33 inches and the most significant single storm snowfall with 42 inches. (Luray, Virginia reported 33.5 inches on March 2-3, 1994, making this later snow their maximum 24-hour snowfall total.) Roads were blocked, and electrical service was out for several days. Washington and Baltimore fell into the mixed precipitation zone. The Ash Wednesday storm is noteworthy for producing devastating tidal flooding along the Atlantic Coast and record snows and the interior of Virginia. The extremely high tides and massive waves caused tremendous damage -worst than many hurricanes that have hit the region. Along the Atlantic Coast, tide ran for 2 to 6 ft above average with 20 to 40 ft waves crashing ashore. National Airport received only 4 inches of snow with a liquid equivalent of 1.33 inches. However, close-in suburbs, such as Silver Spring, Maryland, and Falls Church, Virginia, received 11 inches of snow. Outlying areas such as Rockville, Maryland, received 19 inches of snow, and Leesburg, Virginia, received 20 inches of snow. Other snow totals included 15 inches at Richmond; 23 inches at Culpeper; 26 inches at Charlottesville; 32 inches at Winchester; and 35 inches at Fort Royal, Virginia, and Big Meadows on the Skyline Drive top the list with 42 inches of snow. 1987 - Twenty-eight cities in the north central U.S. reported record high temperatures for the date. Pickstown SD was the hot spot in the nation with a reading of 83 degrees. The high of 71 at Saint Cloud MN smashed their previous record by 21 degrees. (The National Weather Summary) 1988 - Wintry weather developed in the Rockies and the Plateau Region as arctic air swept in from the northwest. Blizzard conditions in southeast Idaho claimed the lives of two teenagers. Thunderstorms developed in Utah and Idaho. (The National Weather Summary) (Storm Data) 1989 - A winter storm in the south central U.S. left parts of Missouri and Arkansas buried under more than a foot of snow. Heavier snowfall totals in Missouri included 14 inches at Springfield and 16 inches at Lebanon. Totals in Benton County AR ranged up to 14 inches. (The National Weather Summary) (Storm Data) 1990 - Colorado's strongest winter storm of the season moved northeastward across the state producing 50 inches of snow at Echo Lake, 46.5 inches on Buckhorn Mountain, and 46 inches near the top of Coal Canyon. Snow fell at the rate of several inches per hour during the height of the storm, while winds gusted above 50 mph. Several hundred rush hour commuters, including the state governor, were stranded in blizzard conditions along Highway 36 between Denver and Boulder. Drifts up to twelve feet high had to be cleared southeast of Boulder. (The National Weather Summary) (Storm Data) 2004: More snow fell on March 6, 2004, than ever recorded for a single day in March since the Korea Meteorological Administration began keeping records in 1904. According to news reports, the city of Daejon (Taejon) in central South Korea received 19 inches of snow on Friday, with an additional 6 inches (15 centimeters) forecast for Saturday. As the storm moved away from the peninsula on March 7. 2010: At least seven funnel clouds were observed along the Orange County coast in southern California. Two were spotted near John Wayne Airport. 2014: The Great Lakes saw some of their worst ice covers in nearly four decades because of a frigid winter with months of below-freezing temperatures in large sections of the northern United States, the National Ocean and Atmospheric Administration said. As of Mach 6, 2014, the federal agency said that 92.2 percent of the five lakes were under ice, breaking a record set in 1973 but still short of the 94.7 percent established in 1979. 2017: Early data from the GOES-East satellite warned forecasters from the NWS office in Dodge City, Kansas, about a wildfire before any 911 calls were made. As a result, they were able to start planning evacuations sooner and saving lives. 2017: A line of storms brought widespread wind damage and tornadoes to Minnesota, Wisconsin, Iowa, and northern Missouri.
-
About an inch of crusty icy mixed stuff here. Roads are a mess. All of the local school districts that had delays shifted to closures. My district waited until the last minute to close. Those HRRR and GFS snows never came close.
-
39 / 38 .97 in the bucket. Clouds hanging tough today but drying out. Warmer but looking cloudy weekend. Much warmer Sunday through Wed with hopefully some sunshine Mon - Tue and part of Wed before the front. Max temps 70s but perhaps a stray 80 in the warmest spot but looking well south now. Moderation back towards normal by Thursday then tough and much chillier look Mar 16 - Marcch 20. A drier week overall vs this week. Beyond there a bit back and forth. 3/6 - 3/7 : Near / slightly below normal 3/8 - 3/11 : Warmer to much warmer first 60s/70s since last Nov/Oct 3/12 - 3/15 : Back near normal 3/16 - 3/20 : Below to much below normal 3/21 - Beyond : Back and forth overall near normal
-
Yup…that system came back overnight that Friday into Saturday morning in all modeling…and we had a nice Martin Luther king weekend…And then it has been full steam ahead from there. But December was good and cold too..with a nice system on 12/26.
-
The Euro ENSO forecasts have a warm bias per looking at 20+ years of forecasts even as late as forecasts issued in early summer. Also, this chart is predicting ONI. RONI has now replaced ONI for official NWS monitoring: https://www.cpc.ncep.noaa.gov/products/analysis_monitoring/enso/roni/ RONI is currently ~0.5C cooler than ONI meaning that this chart is implicitly predicting only ~+1.6 in Sept rather than +2.1. If one then does a bias correction, they’d come up with only a low +1s RONI for Sept (moderate as of then) although it’s still rising then on the chart implying higher later. @Stormchaserchuck1
-
And it might not all be dog $hit. There could be some human mixed in there as well... At least when it was frozen it wouldn't get everywhere.
-
We hit 82 yesterday. Amazingly, I didn't have to turn on the AC.
-
Not sure any amount of rain can wash away all the dog $hit on the sidewalks.
-
Bit of a bust here. Flipped to sleet for a while before going back to snow. 2.25"
-
Does anyone know why KBOS stopped reporting daily snow depth in the late 1990s? This year would be in the top 10, except the data cuts off around 2000. 1977 and 1978 both had two solid months, and 1994 and 1996 both had 30+ days. I have to assume 2015 would be right near the top of the list. KMQE does have data going back longer, right now is sitting at 46 days, 29th longest. Longer this century: 56 (2001), 70 (2015), 77 (2011), 84 (2003). Record of 100 ending 3/23/1923.
-

Central PA Spring 2026 Discussion/Obs Thread
pasnownut replied to Voyager's topic in Upstate New York/Pennsylvania
Next weekend surely looks to get a trough back in the east. It's been showing on the LR guidance for a while now, so were getting close enough to think its legit cold. Just need to see how things line up. As Mag suggested, GFS/Euro worlds apart in evolution for 3/16 event, so that raises a flag. Looks like you got one more period to track though. -
Too much PV strung out across the Canadian Shield for me to like big warm ups along the NP-GL-NE garland. I mentioned this over a week ago, when that was in the guidance ens longer range means; because of that the warm ups should be held in check. I called it melt and mud season. I now wonder if we get that much but will hold for now. If the former should prove more poorly/unseen confluences causing wedge highs to undercut ...no shocker. I've also been observing these models runs ever since... inch by inch have been eroding/rasping the tops off the N latitude of the warm bulges. I don't think the aforementioned PV constraints are entirely unrelated to that sneaky correction tendency/leans.
-
I got 1.00" of rain this morning. There was a close lightning strike and huge crack of thunder at the leading edge of the rain, around 3am. It knocked my internet out for a few hours.