All Activity
- Past hour
-
Thank you! This is awesome stuff. Really appreciate your time and effort to put it all together. It's a great read and easy to understand.
-
There’s an outside chance Minnesota sees it’s earliest accumulating snow on record. September 14th 1964 0.3” fell at International Falls, so if anything accumulates the record will be shattered.
-
Min 51.5°….CON 50° Getting to the point where that isn’t much BN anymore.
-

2025-2026 ENSO
donsutherland1 replied to 40/70 Benchmark's topic in Weather Forecasting and Discussion
The bad information is unbelievable. -
We warned em
-
@DonSutherland1 We are in a “grand solar minimum”. Lmfaooo Last year they were saying we were in a -QBO. The mis-information on twitter is hilarious [emoji23]
-
55/53 IMBY. Fake cold I guess. I see a bunch of stations all around that are in the low to mid 60's. 66 at KSNC!
-
It's all based off of coop and other data and is a quick summary so it's going to be highly dependent on how many reports are in region and how many of those are "winners" vs "losers" in the summer storm lottery. It's quick and dirty and I did not clean the data so I'm sure errors abound Sent from my SM-G970U1 using Tapatalk
-
Deep trough in plains and srly flow here. Signs of winter pattern.
-
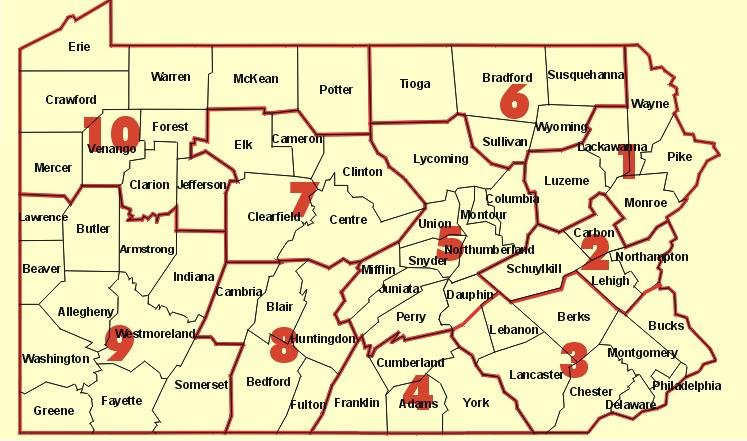
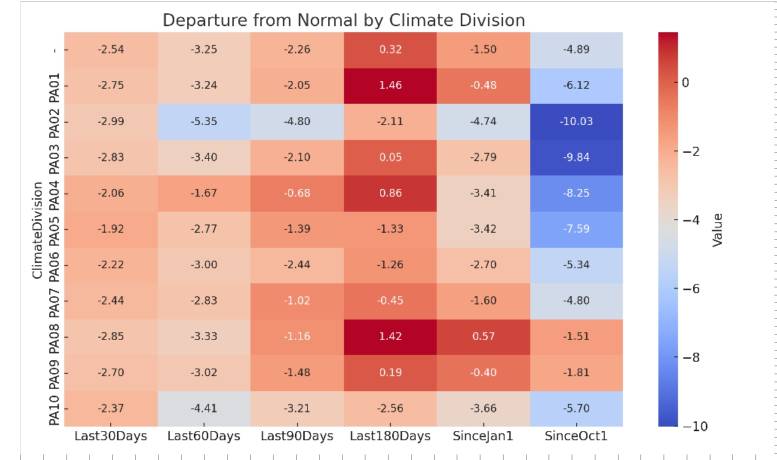
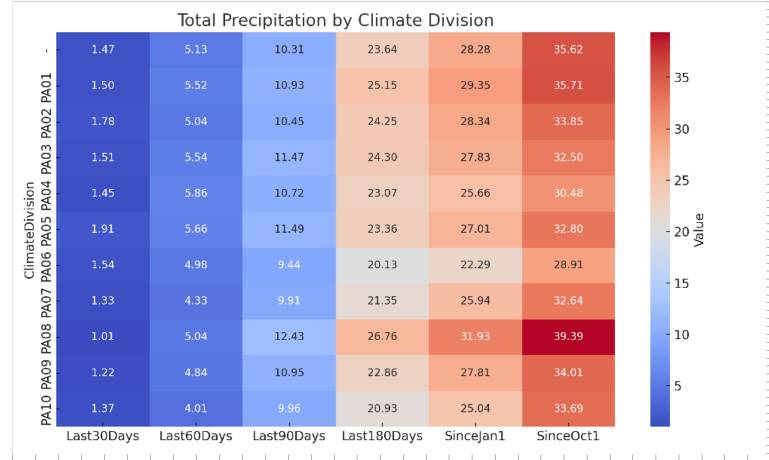
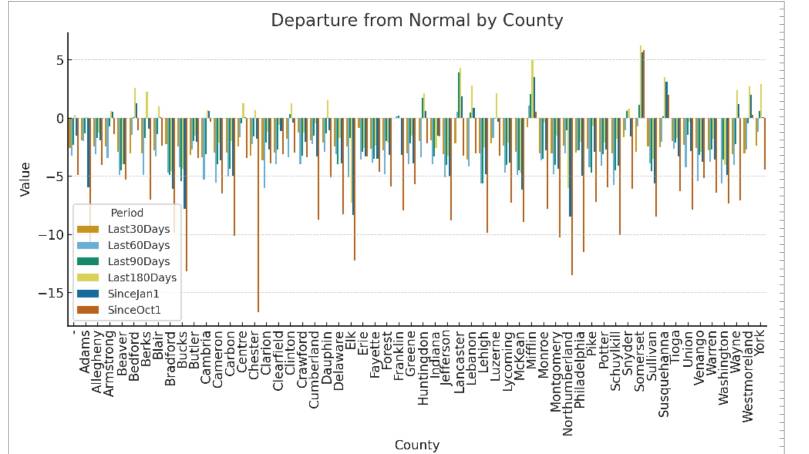
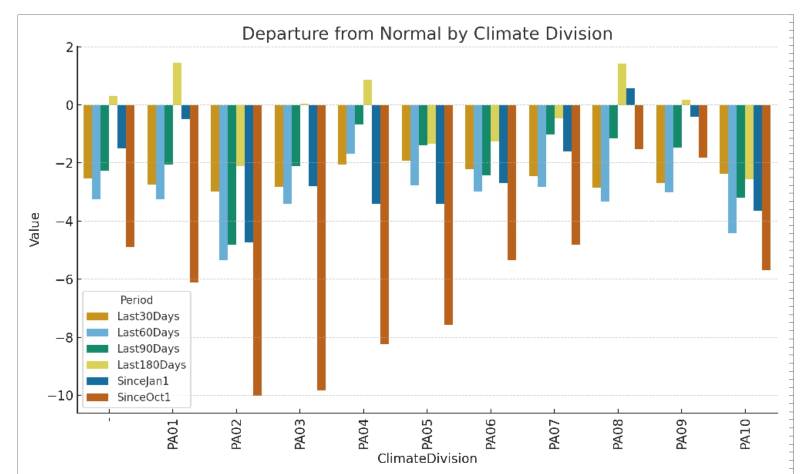
I thought people might enjoy these bar charts and heat maps I made regarding preceiptitation for Pennsylvania. The PA climate division map is included for reference Sent from my SM-G970U1 using Tapatalk
-
B.A.F.
-
I suspect there are competing forces going on right under anyone's awareness. There's been trough anchored over Quebec, and static confluence parking a low thermodynamic surface ridge right over head, which really shuts off continental heat conveyors from getting in here. while there is 540 DM heights and even grapple/wet snow over the NP of Michigan and probably hard frosts N of the ST Lawrence Sea Way up there NW of Maine. This pattern is not a warm one when/if that is the case, but the stalled sfc ridging combining with aspect of CC are combining to host modest H850 warm anomalies/heights to stall over our sub-continental space. Like a sub-anomaly. As an interesting aside, these stalled highs were always part of autumn climatology last century, usually in October and associated with Indian Summers in Novembers, too. Anyway, so we're approaching 80 in the afternoons, during these above other circumstances outside our region due to a semi-coherent +PNA. It's more unusual than some may know. There's also another dimension to this worldly change that is under the radar: warm intrusions, which can and do happen even in cooler profiled hemispheres, are warmer than they were 30 years ago. Two consecutive days of hydrostatic heights nearing or even exceeding 570 dm, like the consensus appeal the models have for this Fri/Sat window, is getting late in climo and thus "seems" like a warmer than normal pattern. But it's just a warm sector during a cool index mode ... still is taking place in the midst of at least a modest +PNA with the 'real' heat packed back west over the western continent. In 1990, that'd be 74 with 62 dps probably. So how does one separate the two? which is it? Is it a warmer than normal pattern... or is the pattern just over-producing a warm transience in cool hemisphere, because CC is obfuscating what's really going on along with everyone's ability to understand what is really happening? I really need to see a -PNA with a neutral EPO actually manifest, otherwise ... we are over performing warmth in a cool larger sense of it. As far as this Margrave whatever you spell him, I suspect he has a chilly functional bias, yeah... Upon sensing the abstraction of any cooler anything, his willingness to pounce is a bit transparent to and annoying. So, we he detects a +PNA lurking in the "subplot" of the models, but is going to probably stop where ever the cool quotient is seen - and thus not seeing these competing deeper aspects. Because the saga of 2025's late summer and now early autumn is deeper and more complex than those CPCs charts. Which, it's not clear he understands the difference between 60% chance of cooler than normal, vs blue colors intending to actually say it will be cooler than normal. For some reason... how to use those charts doesn't get learned by people. That means there's a 40% chance it will be above normal, btw -
-
NWS has flakes in the forecast for the arrowhead of MN…pretty wild for 9/4.
-
Yes! And it also likes a possible second round on the primary front. I’ll take anything I can get.
-
44.5 this morning. The lows this week since Monday, 40.7, 42.3, 44.5 would be normal for mid October. .80" rain total for August. 28.39 total for the year. 27.99 normal.
-
COC as far as the eye can see
-

2025 Atlantic Hurricane Season
BarryStantonGBP replied to BarryStantonGBP's topic in Tropical Headquarters
Did you see the thing in the gulf on the ensembles lads -
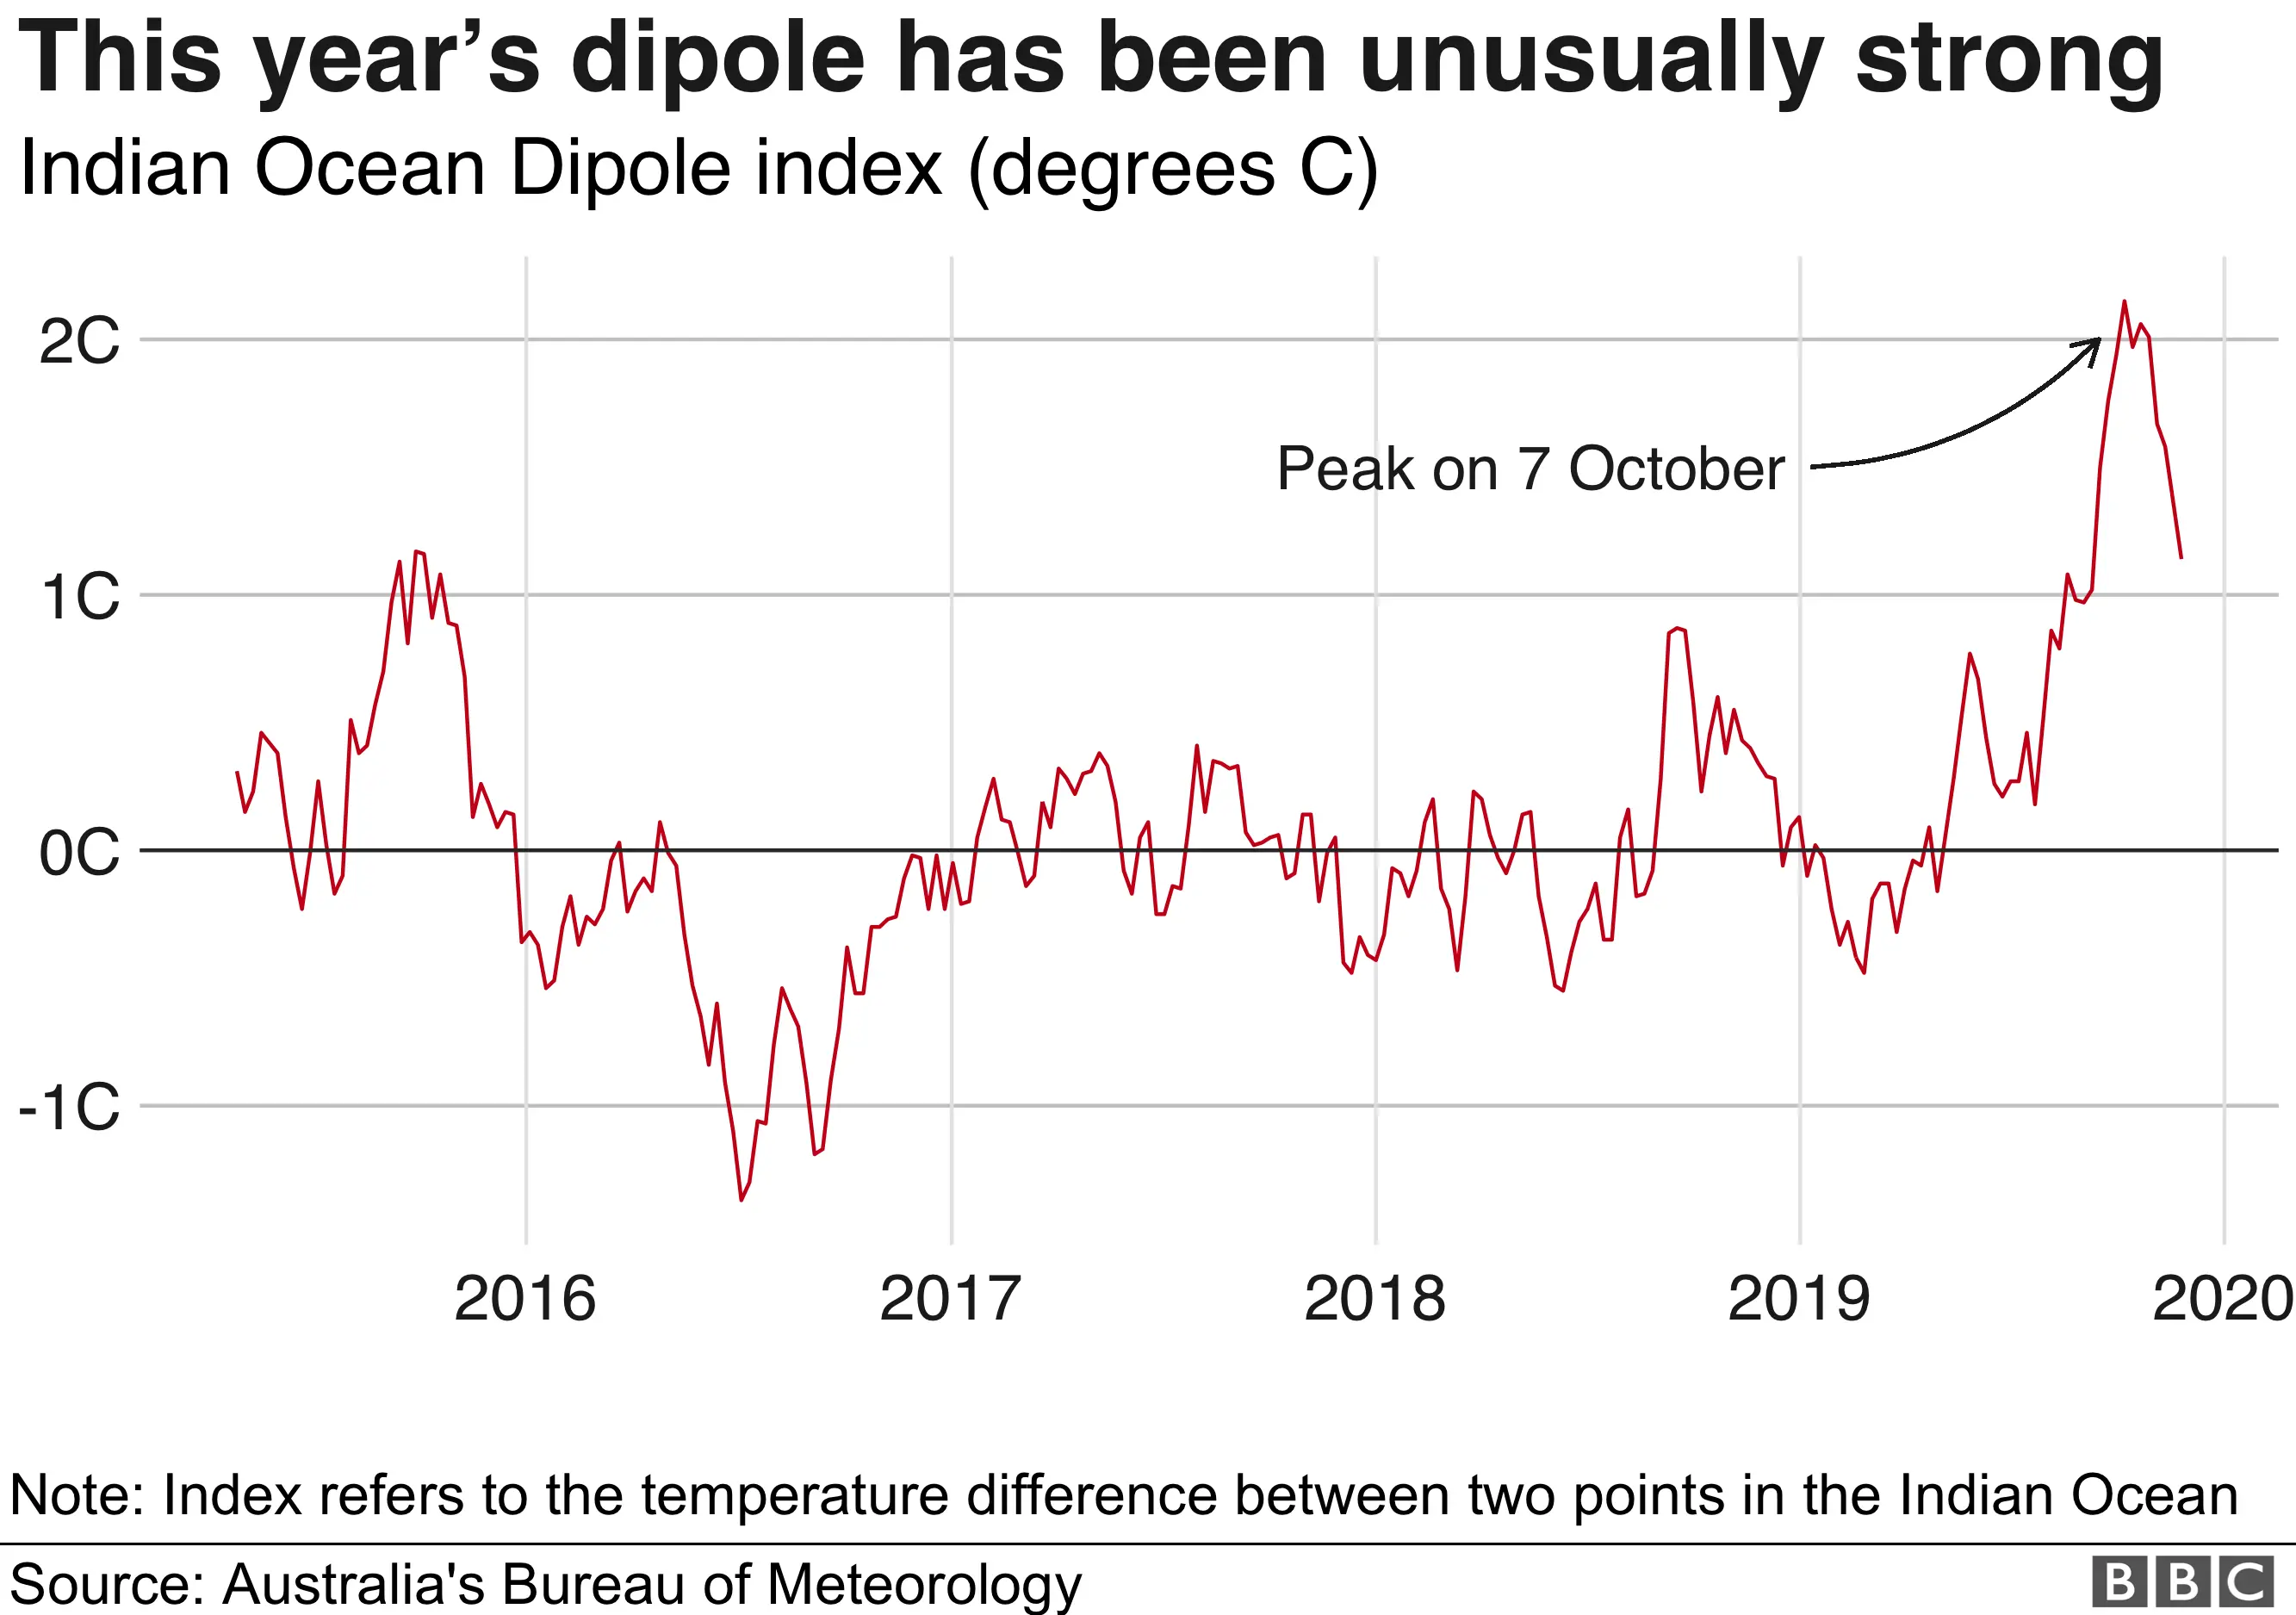
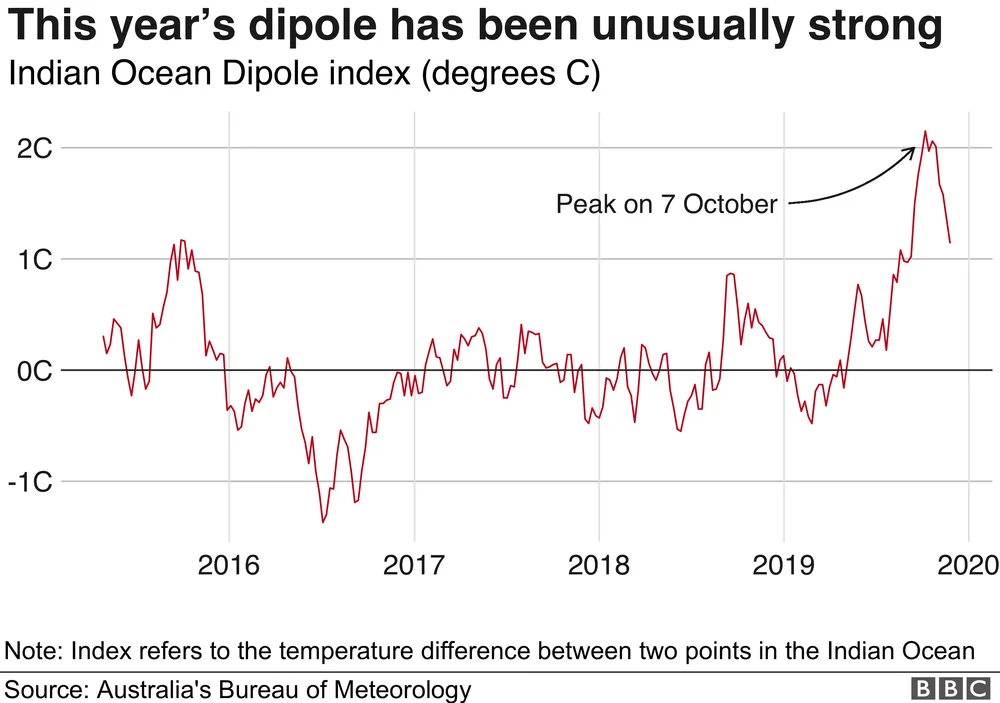
This is the strongest -IOD since the 22-23 and 16-17 La Ninas. My guess for the rest of this season is that the ACE will finish below the 161 level of last year. But we have to watch for a rebound in hurricane activity from mid to late September right into October which has been common since 2012.
-
Friday and Saturday look quite warm and humid.
-
Only if they are below/blue. Not sure he posts ones that show AN, ha.
-
I do think the steering pattern gets more “favorable” in the extended with ridging returning, but I’m not sure that’s in time for whatever pops from this current cherry in the tropical Atlantic.
-
- Today
-
Now that it’s really getting going (-IOD) it’s going to form a positive feedback loop with the developing Niña/SOI and really accelerate the EWBs, trade winds, which the models are projecting going further into September. A weak Niña state by the end of this month appears inevitable at this point. As to your last post on the Atlantic hurricane season:
-
Watch out for rattlesnakes!
-

2025 Atlantic Hurricane Season
NorthHillsWx replied to BarryStantonGBP's topic in Tropical Headquarters
EPS and GEFS both show notable upticks in activity beyond the 10th. As were in the peak of hurricane season that is not surprising. The good news is that at least through mid month, the eastern trough hangs on which continues to be a deterrent to any storm approaching from the east. I think the CAG seen on some GFS runs is overblown as it tends to do but with La Niña developing and a tendency for shear to decrease this time of year I’d expect to start looking to the carribean and southern gulf. SSTs continue to decrease off the east coast from NC northward and I fished Friday out of Morehead and can confirm how much it has cooled. Water was 76-77 until about 35 miles out and warmed to 82 in the stream. Contrast to when I fished last week of July in same location and the temp never fell below 83 from the inlet to the stream and the stream was 87. That’s a huge difference in energy available of anything threatens NC-northward from a month ago. To me, this feels like the lid is starting to come off a bit in the Atlantic and mid month looks to be quite active