All Activity
- Past hour
-
18z euro also shows this
-
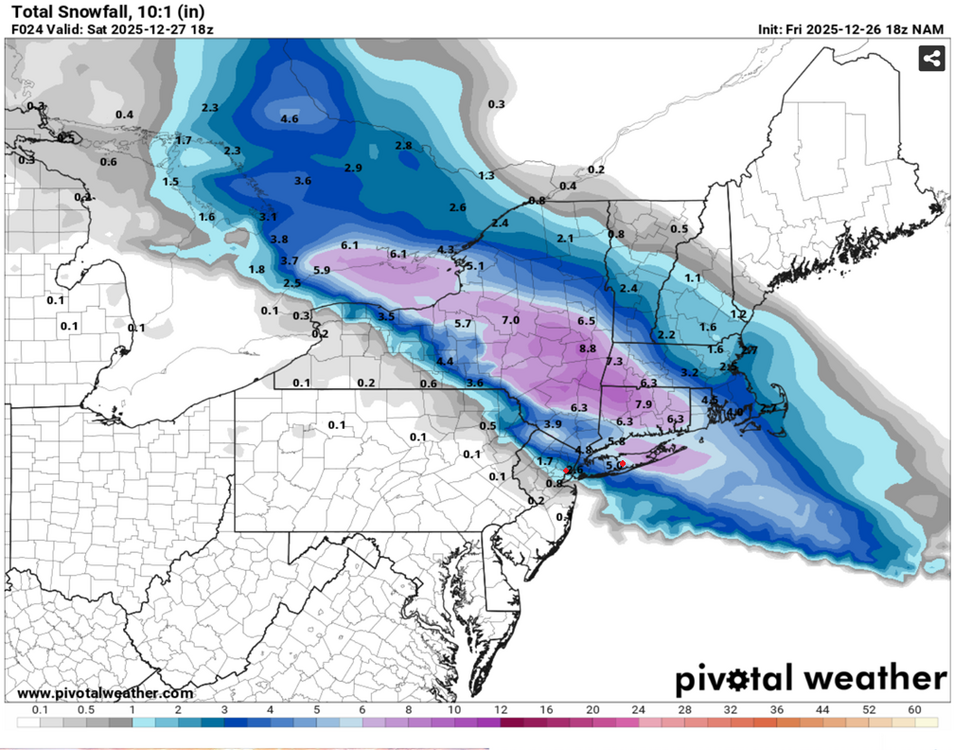
The numbers from the 18z 12/26 NAM run on Pivotal (which doesn't add anything to the totals for sleet) were: Bridgeport: 5.8 Islip Airport: 5.0 Central Park: 2.8 Newark Airport: 0.8 However, the annotated totals shown for NWS reporting stations don't match the colored boundaries drawn on the map. I've marked Newark Airport and MacArthur Airport with red dots as an example. Based on the graphical boundaries and the legend, the estimated NAM totals are: Bridgeport: 5.5 Islip Airport: 5.5 Central Park: 2.8 Newark Airport: 1.8 So now I'm wondering how the values shown on Pivotal get populated. Is the data drawn from the exact lat lon of the reporting station cross referenced to the raw NAM data, or is there some kind of apprimation going on...?
-
Thanks, it’s other drivers who always worry me. MNDOT and the local agencies will do a fine job as always.
-

December 2025 regional war/obs/disco thread
Sey-Mour Snow replied to Torch Tiger's topic in New England
Where is your sidekick poster from last year?? -
December 2025 regional war/obs/disco thread
Sey-Mour Snow replied to Torch Tiger's topic in New England
What’s up with the influx of users I’ve never heard of ? -
Need better then
-
I'm not going to get my hopes up and believe in a Miller-anything until it shows up on the HRRR.
-
Saw that just now. On one hand I'm glad I won't be here but on the other hand I would like to see some snow whipped around at 65mph.
-
There could be a few tenths additional snow by end of month, and some might consider the first event (2.9") to be under-measured relative to long-times-past standards, so I have included all Decembers from 6.3" to 9.7" in this table of snowfall analogues ... I included 1869 because it was (regionally) a very cold December and it probably had plenty of snow (Dec 1868) just to make a note of it. Winter ____ OCT _NOV _DEC _JAN _FEB _MAR _APR ___ TOTAL ___ (Year) 1868-69 __ no data Oct-Dec _15.1 __ 9.6 __ 0.8 __ 0.0 _ _ 25.5+ ___ 1873-74 ___ 0.0 __ 2.0 __ 9.3 __ 6.6 _ 19.0 __ 0.3 __ 0.5 _ _ 37.7 ___ 1887-88 ___ 0.0 __ 0.2 __ 9.0 __11.1 __ 3.0 _ 22.2 __ 0.0 _ _ 45.5 ___ 1893-94 ___ 0.0 __ 0.0 __ 8.3 __ 9.4 _ 20.5 __ Tr __ 1.0 _ _ 39.2 ___ 1903-04 ___ Tr ___ 0.0 __ 6.4 __15.6 __ 5.0 __ 5.4 __ Tr _ _ 32.4 ___ 1909-10 ___ 0.0 __ 0.8 __ 9.0 __ 11.1 __ 5.0 __ 1.3 __ 0.0 _ _ 27.2 ___ 1911-12 ____0.0 __ 1.0 __ 8.5 __ 13.0 __ 2.5 __ 4.5 __ Tr __ _ 29.5 ___ 1915-16 ____0.0 __ Tr ___ 8.1 ___ 0.7 __13.1 _ 25.5 __ 3.3 _ _ 50.7 ___ 1916-17 ____0.0 __ Tr __ 14.5 __ 5.8 __ 12.2 _ 11.7 __ 6.5 _ _ 50.7 ___ 1919-20 ____0.0 __ Tr ___ 8.8 __ 8.2 _ 25.3 __ 5.3 __ Tr __ _ 47.6 ___ 1921-22 ____0.0 __ Tr ___ 7.3 __ 9.4 __ 7.2 __ 3.9 __ 0.0 _ _ 27.8 ___ 1922-23 ____0.0 __1.0 __ 8.0 __24.5 __18.8 __ 8.1 __ 0.0 _ _ 60.4 ___ 1932-33 ___ 0.0 __ 0.0 __ 9.4 ___ Tr __12.8 __ 4.8 __ Tr __ _ 27.0 ____ 1935-36 ___ 0.0 __ 2.7 __ 6.6 __12.1 __ 10.3 __ 1.5 __ Tr __ _ 33.2 ___ 1942-43 ___ 0.0 __ Tr ___ 8.5 __ 9.5 __ 4.4 __ 7.1 ___Tr __ _ 29.5 ___ 1944-45 ___ Tr ___ Tr ___ 6.7 __12.3 __ 8.1 __ Tr ___ 0.0 _ _ 27.1 ____ 1952-53 ___ 0.5 __ 1.7 __ 7.5 ___ 4.1 __ 0.4 __ 0.9 ___ Tr __ _ 15.1 ___ 1957-58 ___ 0.0 __ Tr ___ 8.7 __ 9.2 __10.7 _ 15.9 __ 0.2 __ _ 44.7 ___ 1961-62 ___ 0.0 __ Tr ___ 7.7 __ 0.6 __ 9.6 __ 0.2 __ Tr __ _ 18.1 ____ 1966-67 ___ 0.0 __ 0.0 __ 9.1 __ 1.4 __23.6 __17.4 __ Tr __ _ 51.5 ___ 1968-69 ___ 0.0 __ Tr ___ 7.0 __ 1.0 __ 16.6 __ 5.6 __ 0.0 _ _ 30.2 ___ 1969-70 ___ 0.0 __ Tr ___ 6.8 __ 8.4 __ 6.4 __ 4.0 __ Tr __ _ 25.6 ___ 1990-91 ___ 0.0 __ 0.0 __ 7.2 __ 8.4 __ 9.1 __ 0.2 __ 0.0 _ _ 24.9 ___ 1993-94 ___ 0.0 __ Tr ___ 6.9 __12.0 _ 26.4 _ 8.1 __ 0.0 _ _ 53.4 ___ 2005-06 ___ 0.0 __ Tr ___ 9.7 __ 2.0 _ 26.9 __ 1.3 __ 0.1 _ _ 40.0 ___ 2013-14 ___ 0.0 __ Tr ___ 8.6 __19.7 _ 29.0 __ 0.1 __ Tr __ _ 57.4 ___ 2017-18 ___ 0.0 __ Tr ___ 7.7 __ 11.2 __ 4.9 __11.6 __ 5.5 _ _ 40.9 ___ ==================== Quite a few very cold Januaries in this group, and good snowfall winters like 1887-88, 1922-23, 1966-67, 2013-14, 2017-18.
-

Wounded Duck Strikes Back: Dec 26 & 27th Winter Storm Obs
rgwp96 replied to WxWatcher007's topic in New England
I ended up with 3.8. Can’t complain I’ve have 11.4 for December but every storm I’ve had has been under in the forecasted amounts lol. -
Yes please !!

-
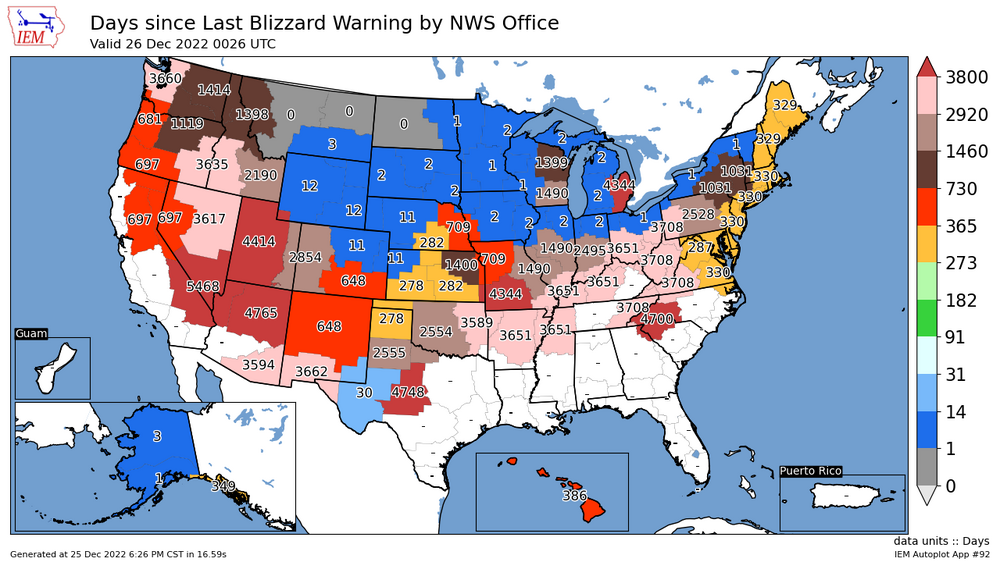
Technically NO, only 3 yrs since the pre-Christmas bomb. You know, the one that was forecast to bomb much earlier and actually be a legit bliz for The Mitt. Instead it finally got going good up in Canada and serious wind-driven +SN was confined to the usual LES Belts of both peninsulas. LP is way over-due for a wound-up powerhouse storm, to say nothing of a CAT-5 (20+) storm that delivers such to more than a couple county region like Jan '99. You can add another 1,095 days for SEMI/DTX since this map in '22
-
stormy is in quite a stormy mood
-

December 2025 regional war/obs/disco thread
VivaManchVegas replied to Torch Tiger's topic in New England
This was a weather station less than a mile away from me but +500 feet.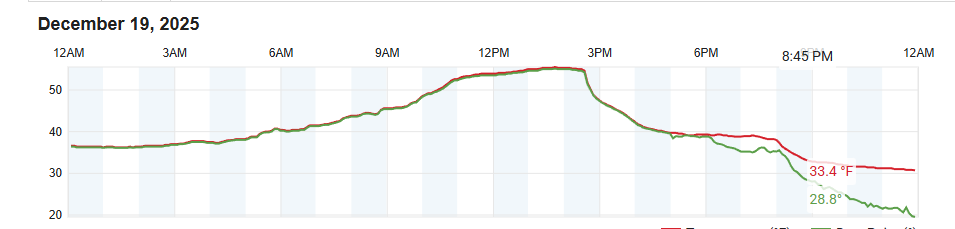
-
Yeah that's the flaw with the ignore feature. Sorry!
-
Looks pretty significant to me but not much talk on here, going to cancel the kids ski lessons on Monday
-

Wounded Duck Strikes Back: Dec 26 & 27th Winter Storm Obs
vortex95 replied to WxWatcher007's topic in New England
Saw 3 reports from Weymouth -- 4.2, 3.5, and 3.3. Which one was CoastalWx? Overall, a quite good event for Dec, esp. CT/RI/SE MA where ocean temps often are a big issue this early. Many locations now have above avg snowfall for Dec. Couple that w/ the solid snowfall in NNE, best winter month for the region in some time! So I don't want to hear it fro CoastalWx! -
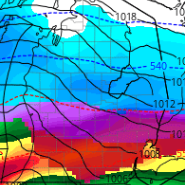
Gefs 18z a bit better than 12z, more like 06z
-
I dont see it unless ya'll quote it.....Just saying.
-
Weird dude
-
He cant help himself lol.
-
CAPE is one of the best posters here and you disparage him over nothing. take a break lol
-
Yes this year we've not had any sweet spot tracks. Just accumulated the nickel and dime like a boss per usual. Im antsy for a good 6"+ storm. BTW when did Toronto get 2? Its harder to look up their data since they're Canada. I remember they had 1 within the last few years after some unusually low winters...mother nature always evens it out...I gave the warning years ago that we were gonna pay for our above avg snow seasons here....and I feel we've done that so time to turn it back around.
-
December 2025 regional war/obs/disco thread
VivaManchVegas replied to Torch Tiger's topic in New England
Our temps held out much longer than forecasted on the 19th. It was a good 3 or 4 hours longer than forecasted by the local mets. Where I live, its in a valley with 500 plus foot elevation change just to my north (within a mile). I took a drive up over the hills after that storm and they had lost all of the snow, while we kept a covering in the open areas. This should be an interesting storm.
-
It wasn't a question....................................................dumbass