All Activity
- Past hour
-
Still looking dry the next 10 days at least.
-
For me, notable weather events help to trigger memories of other things, as well as the storms themselves. Finished with 6.7" and 0.65" LE, moist but not sloppy.
-
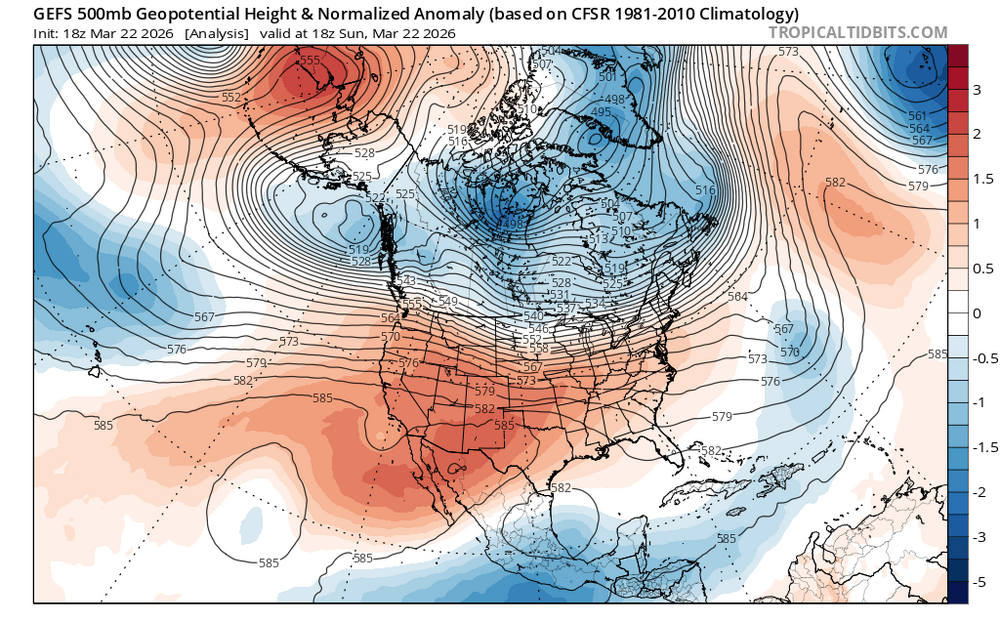
We pray. But I want to see it inside d5 again before I believe it. Seeing BN heights in New Foundland is giving me PTSD.
-

2026-2027 El Nino
roardog replied to Stormchaserchuck1's topic in Weather Forecasting and Discussion
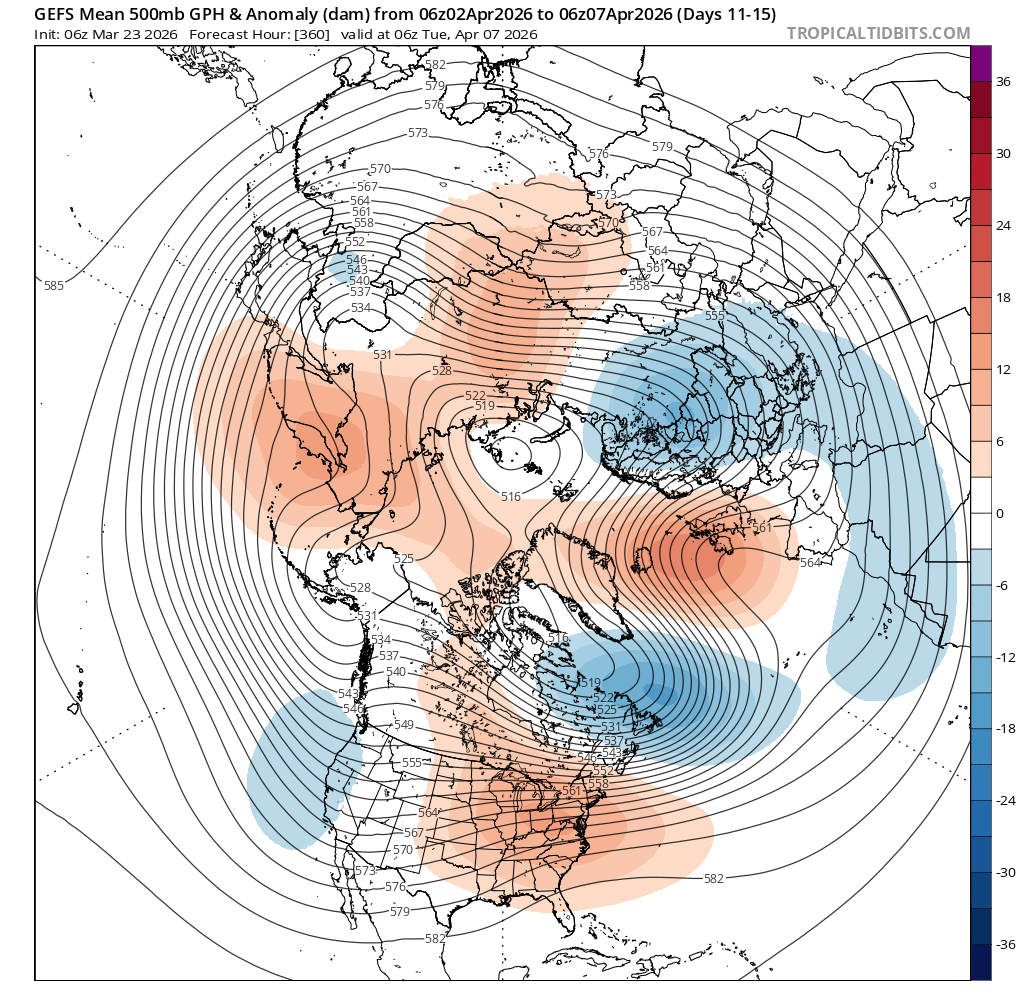
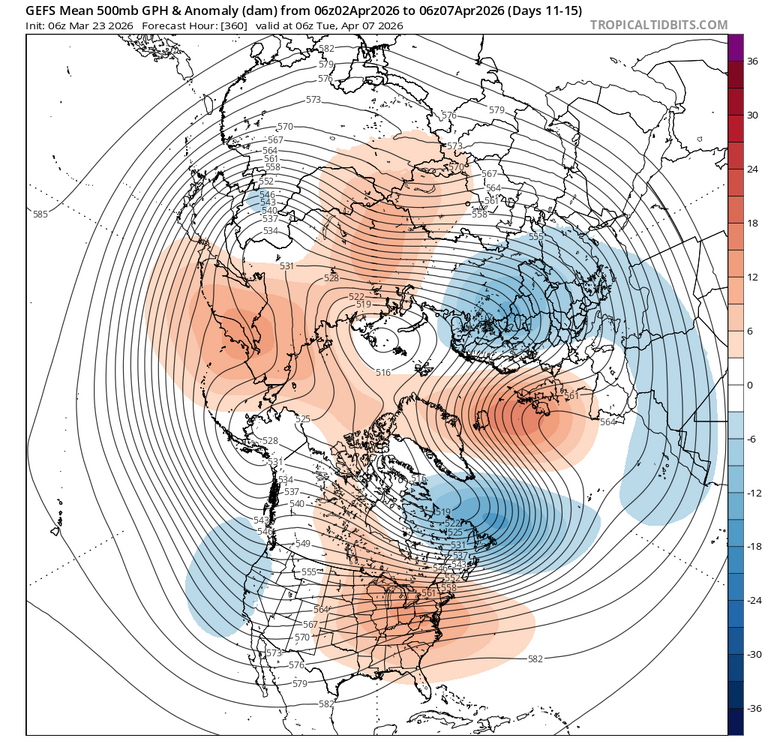
I know RONI is the “official” way to measure Enso now but it’s not perfect with the old ONI measurement. If you showed me a 500mb anomaly map of the 23-24 winter over North America, I certainly wouldn’t think moderate/ borderline strong Nino. I would think very strong Nino with a -PDO like 72-73. -
Records: Highs: EWR: 82 (1938) NYC: 76 (2012) LGA: 74 (2012) JFK: 77 (2012) Lows: EWR: 13 (1934) NYC: 13 (1934) LGA: 19 (1940) JFK: 20 (1959) Historical: 1765: A major snowstorm struck the eastern seaboard from Massachusetts inland to Pennsylvania. Reports showed as much as 2.5 feet of snow fell in some locations. (Ref. Wilson Wx. History) 1899: An amazing 141 inches of snow fell at Ruby, CO between the 23rd and 30th to establish the state record for greatest snowfall from a single storm. (Ref. Wilson Wx. History) 1907: Today was the warmest March day ever recorded in Washington, DC with a maximum temperature of 93 degrees. Washington DC has seen three, 90 degrees days in March, all of which occurred in 1907. The warmest March dates ever recorded in Richmond, VA. The maximum temperature was 94 °F on the March 23rd and 29th of 1907. (Ref. Richmond Weather Records - KRIC) 1913 - A vicious tornado hit the city of Omaha, NE. The tornado struck during the late afternoon on Easter Sunday, and in just twelve minutes cut a swath of total destruction five miles long and two blocks wide across the city killing 94 persons and causing 3.5 million dollars property damage. (David Ludlum) 1916 - Pocatello, ID, received a record 14.6 inches of snow in 24 hours. (The Weather Channel) 1987 - A blizzard raged across western Kansas, and the panhandle of Texas and Oklahoma. Pampa TX received 21 inches of snow, and winds gusted to 78 mph at Dodge City KS Altus OK. Governor Hayden declared forty-six counties in western Kansas a disaster area. In southwest Kansas, the storm was described as the worst in thirty years. (The National Weather Summary) (Storm Data) 1988 - Thunderstorms developing along a strong cold front spawned tornadoes near Roberts ID and Bridger MT. Strong and gusty winds prevailed in the western U.S. Wind gusts in the southwest part of Reno NV reached 89 mph. (The National Weather Summary) (Storm Data) 1989 - Charlotte and Wilmington, NC, reported rainfall records for the date as showers and thunderstorms prevailed in the southeastern U.S. Freezing rain glazed parts of North Carolina and southern Virginia. Gale force winds produced a heavy surf along the coast of North Carolina. (The National Weather Summary) (Storm Data) 1990 - An upper level storm system produced heavy snow in the Lower Missouri Valley. Snowfall totals ranged up to nine inches at Kansas City MO, with eight inches reported at Falls City NE, Columbia MO and Saint Louis MO. Thunderstorms produced heavy snow in the Kansas City area during the evening rush hour. (The National Weather Summary) (Storm Data) 1996: The third storm in 10 days brought heavy snow to the parts of the Rockies. Golden Gate Canyon reported 18 inches and Nederland had 10 inches in the foothills of Colorado. Snowfall generally ranged from 4 to 8 inches across Denver, CO. As the storm moved east, blizzard conditions developed on the 24th and 25th closing both I-70 and I-76 east of Denver. (Ref. Wilson Wx. History) 2007 - A trailer is thrown through a bowling alley as a tornado moves through Clovis, NM. About 100 homes and businesses are destroyed, at least three schools are damaged and telephone poles are snapped. Thirteen tornadoes struck a dozen communities along the New Mexico/Texas border. Two people were critically injured. 2011 - A series of tornados are spawned from severe thunderstorms in Pennsylvania. In Hempfield Township dozens of homes and a high school auditorium where students are rehearsing a play are severely damaged. 2012Chicago-O’Hare • This was the 6th record warm low set since March 14th and the 10th consecutive day a record warm temperature of any type was set. This was the end of the Mid-West heat wave. - Summary • Chicago broke or tied daily high temperature records on nine consecutive days from March 14-22. This was the second longest stretch of standing daily temperature records of any type for Chicago dating back to 1871. The record for standing consecutive temperature records is ten daily high temperature records from August 25-September 3, 1953. • 8 of 18 (roughly 44%) of Chicago's 80° days in March, dating back to 1871, have occurred in March of 2012. For Rockford, ILL 6 out of 18 (roughly 33%) of Rockford's 80° days in March have occurred this March of 2012.(Ref. NWS) (Ref. Climate Central 2012, NOAA 2012,Ham Wx. Record Events Map)(Ref. NOAA, Image of US Heat by NASA)
-
Pretty much have to get through March before we can get persistent AN. That’s the guidance. Right around the first we’ll start seeing a shift to AN tendency.
-

2026-2027 El Nino
40/70 Benchmark replied to Stormchaserchuck1's topic in Weather Forecasting and Discussion
Take out that west warm pool and I think 2023-2024 would have been in line with the ONI, which was bordered on super-designation. The expression was partially stifled throughout the hemisphere. -
44 / 42 coolest of the next 7-10 days and perhaps well beyond that. 0.38 un the bucket. Lats of the rain / showers moving through W - E this morning. Still coole Tuesday mid 40s to low 50s - warmest spots. Moderation warmer Wed - Thu then cooler Fri / Sat. Overall near normal 3/28 - 4/1 before much warmer 4/3 - 4/6 as ridge builds east. A drier week in the cards next 7 days <0.50.
-
2026-2027 El Nino
40/70 Benchmark replied to Stormchaserchuck1's topic in Weather Forecasting and Discussion
I would argue that the 2023-2024 El Nino coupled, but it was partially masked by the prevailing west warm pool, so there was some mixed cool-ENSO like attributes to the pattern. -
Lol
-
It, of course, still remains to be seen whether there will actually be a super Nino. The last one was in reality 2015-6 as 2023-4 peaked at only borderline moderate/strong per RONI, which is now the official way of measuring. Currently, RONI is ~0.5C cooler than ONI. Most model progs are only of ONI.
-
2026-2027 El Nino
40/70 Benchmark replied to Stormchaserchuck1's topic in Weather Forecasting and Discussion
If El Nino doesn't become exceedingly strong, I wonder if we don't see this same type of warm west/cold east pattern stagnate into next season...a la a 2002-2003 type of warm ENSO. -
even warmer just sw (inland) of EWR on a few of those days 3/16, 3/20, 3/22
-
1.96" - will end up closer to 2.5" at this rate
-
Yup…a week ending looks imminent. Oh well…it was a very good season overall. We take and appreciate.
-
...I held out hoping March would be a special month, but hope faded as the days went by. Oh well. Rain happens.
-
Yeah, I'm far from an expert, but the idea that this pattern would produce 90 degree temperatures in March in the Mid Atlantic really seems abnormal. 70s, sure. But this doesn't look record breaking. I would think you'd need a big Bermuda High and a ridge centered over the East Coast itself.
-

2026-2027 El Nino
Typhoon Tip replied to Stormchaserchuck1's topic in Weather Forecasting and Discussion
maybe a super nino will finally couple to the mid latitudes more convincingly. -

Central PA Spring 2026 Discussion/Obs Thread
Mount Joy Snowman replied to Voyager's topic in Upstate New York/Pennsylvania
Current temp of 50 is the low and .52” of rain. -
2026-2027 El Nino
40/70 Benchmark replied to Stormchaserchuck1's topic in Weather Forecasting and Discussion
I think wetter and warmer than this past winter in the NE is a good guess for next season. -
Oh I got an idea. So do most climate scientists
-
You’re welcome. No points scored. But If you notice the usual suspects are giving you weenies for pointing out very valid points…because it doesn’t fit in with the narratives. Then they wonder why these narratives aren’t taken seriously, and have very serious flaws. But thank you for pointing out these obvious issues…that some of us have realized. But when it comes from a pro…it carries a little more weight.
-
Have only had three 60°+ days here while it’s been like a different season in NJ. Climatological Data for NEW HAVEN TWEED AP, CT - March 2026 Click column heading to sort ascending, click again to sort descending. 2026-03-01 41 26 33.5 -1.2 31 0 T 2026-03-02 27 15 21.0 -13.9 44 0 0.00 2026-03-03 34 15 24.5 -10.6 40 0 0.41 2026-03-04 48 28 38.0 2.6 27 0 0.10 2026-03-05 40 28 34.0 -1.6 31 0 0.75 2026-03-06 39 35 37.0 1.2 28 0 0.31 2026-03-07 41 34 37.5 1.4 27 0 0.09 2026-03-08 55 35 45.0 8.7 20 0 T 2026-03-09 64 30 47.0 10.4 18 0 0.00 2026-03-10 63 31 47.0 10.2 18 0 0.00 2026-03-11 60 41 50.5 13.4 14 0 0.30 2026-03-12 53 32 42.5 5.2 22 0 0.22 2026-03-13 39 31 35.0 -2.6 30 0 0.00 2026-03-14 47 30 38.5 0.7 26 0 0.00 2026-03-15 42 29 35.5 -2.6 29 0 0.00 2026-03-16 55 40 47.5 9.1 17 0 1.68 2026-03-17 53 31 42.0 3.3 23 0 0.01 2026-03-18 35 26 30.5 -8.4 34 0 0.00 2026-03-19 38 28 33.0 -6.2 32 0 0.00 2026-03-20 49 27 38.0 -1.5 27 0 0.08 2026-03-21 53 41 47.0 7.2 18 0 0.00 2026-03-22 48 40 44.0 3.9 21 0 0.17 Climatological Data for NEWARK LIBERTY INTL AP, NJ - March 2026 Click column heading to sort ascending, click again to sort descending. 2026-03-01 44 29 36.5 -1.8 28 0 T T 1 2026-03-02 34 21 27.5 -11.0 37 0 0.00 0.0 1 2026-03-03 38 30 34.0 -4.8 31 0 0.42 T T 2026-03-04 47 37 42.0 2.9 23 0 T 0.0 0 2026-03-05 44 39 41.5 2.2 23 0 1.62 0.0 0 2026-03-06 43 37 40.0 0.4 25 0 0.16 0.0 0 2026-03-07 50 37 43.5 3.7 21 0 T 0.0 0 2026-03-08 73 48 60.5 20.4 4 0 T 0.0 0 2026-03-09 73 44 58.5 18.1 6 0 0.00 0.0 0 2026-03-10 82 46 64.0 23.3 1 0 0.00 0.0 0 2026-03-11 82 53 67.5 26.6 0 3 0.35 0.0 0 2026-03-12 64 35 49.5 8.3 15 0 0.07 T 0 2026-03-13 45 30 37.5 -4.0 27 0 0.00 0.0 0 2026-03-14 53 34 43.5 1.7 21 0 0.00 0.0 0 2026-03-15 46 36 41.0 -1.1 24 0 T 0.0 0 2026-03-16 67 45 56.0 13.6 9 0 0.60 0.0 0 2026-03-17 47 31 39.0 -3.7 26 0 T 0.0 0 2026-03-18 37 25 31.0 -12.0 34 0 0.00 0.0 0 2026-03-19 44 32 38.0 -5.3 27 0 0.00 0.0 0 2026-03-20 66 35 50.5 6.9 14 0 0.07 0.0 0 2026-03-21 60 48 54.0 10.1 11 0 0.00 0.0 0 2026-03-22 64 44 54.0 9.7 11 0 0.08 0.0 0
-
E PA/NJ/DE Spring 2026 Obs/Discussion
JTA66 replied to PhiEaglesfan712's topic in Philadelphia Region
About .40” in the bucket this morning. Trash cans survived the onslaught of overnight showers. 49F -
Sound waters are colder than average so it makes sense