All Activity
- Past hour
-
-
Today's high was 61 and we will be going down to the 40s tonight!
-

2026-2027 Strong/Super El Nino
roardog replied to Stormchaserchuck1's topic in Weather Forecasting and Discussion
My memory might be failing me but I think 1997 was the year of the November snowstorm bust here. We had a winter storm warning for 6-10 inches for the next day. By morning the warning was dropped and the forecast was for 1-3 inches. We never got a flake. It was all down toward you. -
82/45 is tops when you are sitting outside with a book.
-

2026-2027 Strong/Super El Nino
MJO812 replied to Stormchaserchuck1's topic in Weather Forecasting and Discussion
Should we cancel winter? - Today
-
All the snow weenies care about are 10:1 and Kuchera
-
"A real-time parallel feed of RRFS and REFS will be available on or about July 7, 2026, on NOMADS for both NCEP Web services and NOAAPORT" SCN26-048-Updated_RRFS_and_REFS_Implementation.aaa.pdf
-
"A real-time parallel feed of RRFS and REFS will be available on or about July 7, 2026, on NOMADS for both NCEP Web services and NOAAPORT." SCN26-048-Updated_RRFS_and_REFS_Implementation.aaa.pdf
-

2026-2027 Strong/Super El Nino
GaWx replied to Stormchaserchuck1's topic in Weather Forecasting and Discussion
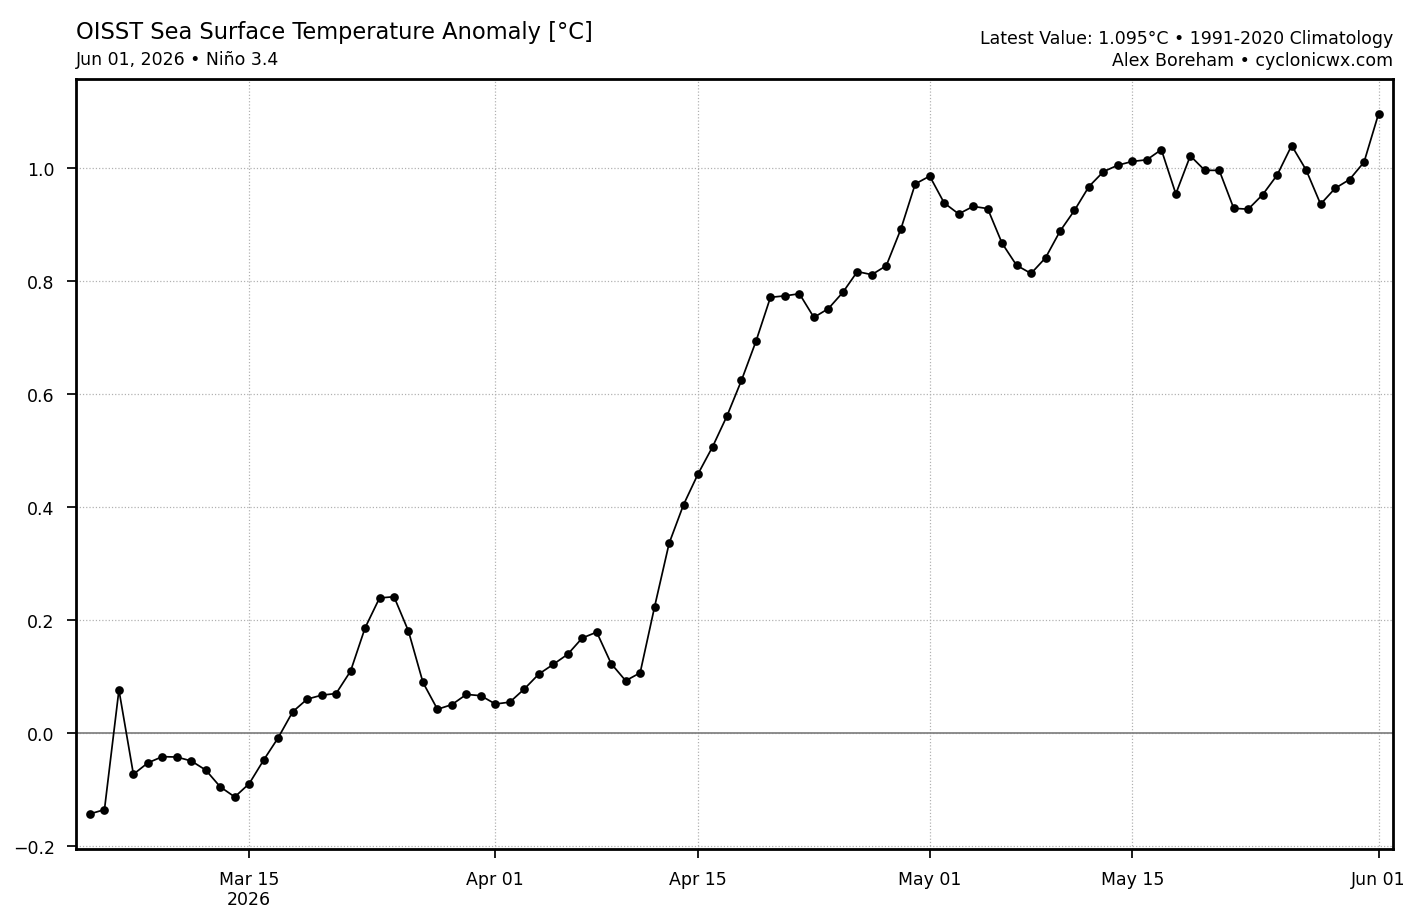
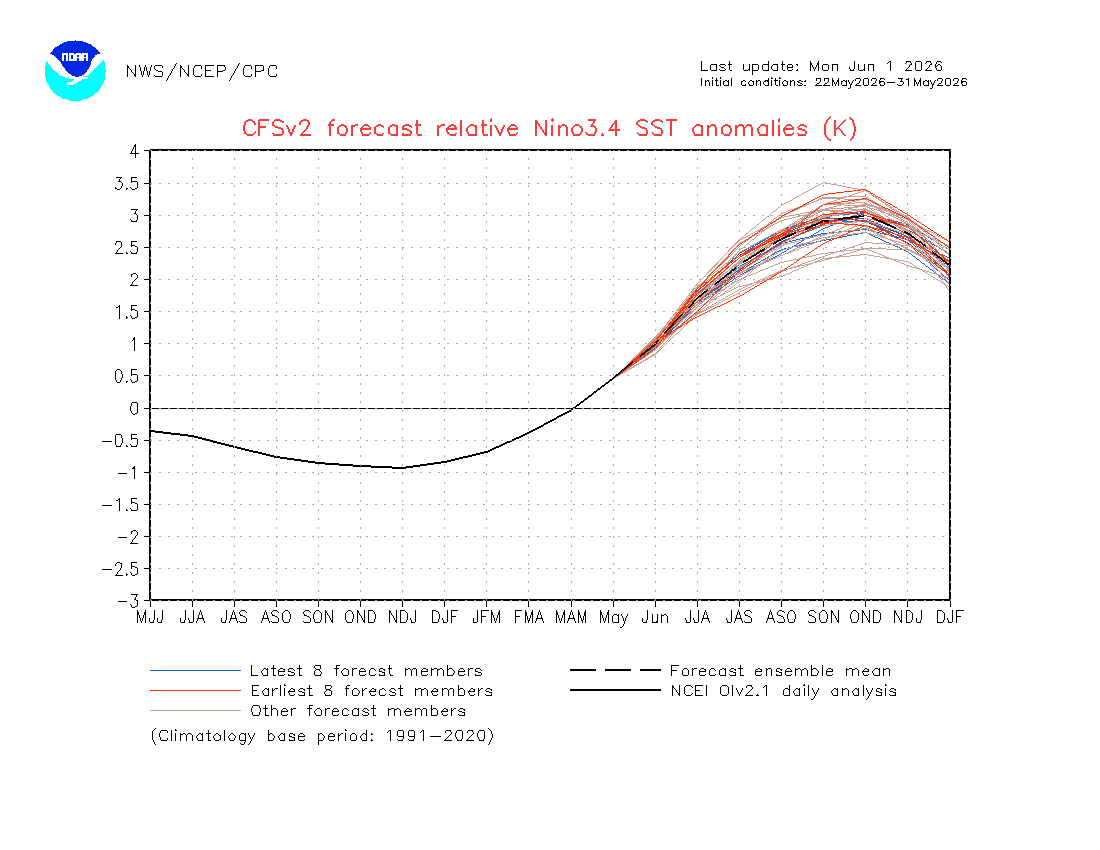
OISST rose on June 1st a whopping ~0.09C, which is the largest gain in one day since way back on April 13th! Is this just the start of an overall big warming? Based on the recent SOI and models, I think it is:
-
PVA? I haven't heard that term used in some time. Back in the day, it was DA BOMB in wx talk! Not saying it is not important, but just looking at how the lingo has evolved. Now it seems we use UVV, frontogenesis, deformation, and WAA/CAA more for the S+ weenie terms!
-
Pattern looks similar - don't see a consistent big heat signal. You'll get your warm days, hot days, then cooler days mixed in. Rinse wash, repeat.
-
It so easy to be misled, even for learned mets. I would think there is better way to convey temps in the long range. The colors CPC uses are ok, but you go on other sites, and it has been skewed towards warm colors even for cool temps in recent years. It used to be very hot was dark red, but due to the shift up, you now get brownish-red and white! At the same, colors used for cooler temps like the 50s and 60s, are no longer yellow or green, they are shades of orange. This skews perception big time thinking it is "hotter" overall. It's no different that what you see in some TV markets (OKC is one) where they jack up radar reflectivity levels so tstms look "meaner" than for conventional color tables have been used for decades. This has real impacts. I recall during the Iceland volcanic eruption in 2010 that shut down airspace for weeks across the NATL, forecast ash plumes from they HYSPLIT model and others, some would chose these eye-catching bright colors for ash levels/concentration, and you look at it thinking the entire NATL was covered in dense ash! The economic impact here alone can be be understated. it should be standardized colors across all platforms for color tables used so you are comparing graphics apples to apples. The avg person has trouble enough w/ interpreting or understanding wx, so don't make it any more complex that it needs to be!
-
2026-2027 Strong/Super El Nino
GaWx replied to Stormchaserchuck1's topic in Weather Forecasting and Discussion
Latest CFS run’s peak: +3.0 (record is 1982’s +2.5). Whereas this could easily be overdone based on the past, getting at least a 1982 like record peak of +2.5 is likely at this point. This has June at +1.0. With today near +0.6, there’s going to need to be pretty rapid warming within the next couple of weeks to keep up with this. Based on the recent/current strong -SOI, this is quite doable as of now: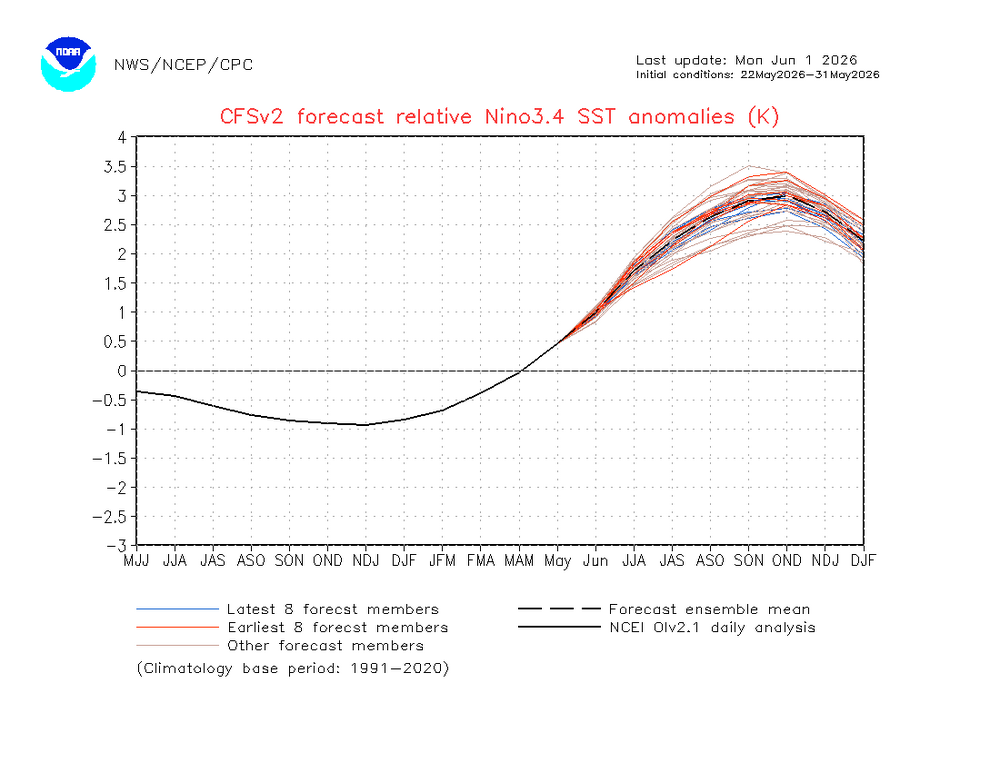
-
Posts like that from CWG are disappointing. They feed a false narrative that [insert thing or secret organization here] are controlling the weather. They should know better than that.
-
Signs were there for this I think. PVA streaming from the north and still pretty cold at 500
-
here it is...300 mb
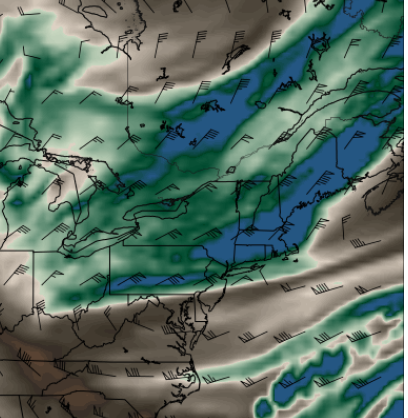
-
Models either missed this 300 mb shit streak or it was just not noticed but it's been completely slam shut ceilings here right during the big warming hours of the day, so ...yet again, 2026 finding the coldest way to weasel bust
-

2026-2027 Strong/Super El Nino
forkyfork replied to Stormchaserchuck1's topic in Weather Forecasting and Discussion
boy you people are desperate -

2026-2027 Strong/Super El Nino
PhiEaglesfan712 replied to Stormchaserchuck1's topic in Weather Forecasting and Discussion
Global temperatures will jump, unless we get an eruption of Mt. Rainier (and really soon). Remember, Pinatubo erupted in mid-June of a developing strong el nino. Prevented a temperature jump from happening in 1992, and in fact temporarily caused a decrease in global temperatures. Also, led to one of the coldest summers on record CONUS in 1992, as well as contributed to the great winters of 1992-93, 1993-94, and 1995-96 in the Eastern US. -

2026-2027 Strong/Super El Nino
bluewave replied to Stormchaserchuck1's topic in Weather Forecasting and Discussion
The EPS weeklies actually did a decent job beginning in late October into November seeing the general 500mb pattern. But the Western ridge verified much stronger skewing the total CONUS significantly warmer. This allowed our area to beat the guidance to the colder side for a change. The first colder winter with above average snowfall in 11 years for our region made it really stand out against the sea of warmth since 2015-2016. -
Hartford too-40 breaks the previous low of 42 in 2020.
-

2026-2027 Strong/Super El Nino
40/70 Benchmark replied to Stormchaserchuck1's topic in Weather Forecasting and Discussion
I think the CANSIPS did best last winter, granted non of the models accurately incorporate the magnitude of CC attributed ridge expansion. Just saying...not mean to imply it necessarily will again. -
Idalia (in 2023) should have been retired as well. I guess there must be a shortage of I names that they need to keep them in there unless there is a truly historic storm.
-
 I can't imagine where you're talking about.
 -
Yeah we'll see as we get closer but a total washout seems unlikely