All Activity
- Past hour
-
47° +RA
-
40 degrees this morning. Bumped the gas fireplace on to take the chill off. .35” was the rain total yesterday. A lot of pop up 1 minute showers….weird Probably another mow coming this weekend. 4.6” for the month
-
.LONG TERM /TUESDAY THROUGH FRIDAY/... -- Changed Discussion -- Rounds of rain and rumbles are likely Tuesday into the second half of next week as a strong influx of deep moisture from the Gulf and western Atlantic is directed into the area on the east side of slow moving upper level low. There may be some opportunity for heavy rainfall with PA on the northern edge of the D4 WPC ERO MRGL risk. There is high confidence in above normal temperatures and increasing humidity levels through the end of the period.
-
A cold, damp foggy 38 this morning.
-
1.32 rain for the event, 4.11 for the month, 11.01 for the year. Creek is running high. I don't need any more rain for at least a week or two. It has to dry out now.
-
1.3" here since Thursday afternoon. Still getting showers. 44.8°
-
Day 4-8 Convective Outlook NWS Storm Prediction Center Norman OK 0400 AM CDT Sat May 10 2025 Valid 131200Z - 181200Z ...DISCUSSION... Medium-range guidance indicates that a generally amplified, split mid/upper flow will persist across the mid-latitude Pacific through North America next week. It appears that this will include at least a couple of significant troughs digging inland of the U.S. Pacific Coast. The first may already be in the process of developing eastward across the Intermountain West early in this period (Tuesday), before progressing across the Rockies, Great Plains and Mississippi Valley during the middle through latter portion of next week. This may be followed by another significant trough digging inland of the Pacific coast by early next weekend. The lead trough will be relatively close on the heels of the remnants of an initially broad quasi-stationary/cut-off low, which may only slowly progress east of the Mississippi Valley through Atlantic Seaboard during the early to middle portion of next week. Low-level moisture return, in the wake of this perturbation and ahead of the mid-level trough emerging from the West, may continue to be impacted across at least parts of the Great Plains into mid week. Thereafter, there appears a general consensus that there will be a better coupling of large-scale forcing for ascent, aided by surface cyclogenesis, with a notable increase in low-level moisture and destabilization across the lower Missouri Valley into the Upper Midwest and lower Ohio Valley by late next Thursday into Thursday night. In the presence of strong shear, it appears that this environment could become supportive of supercells and/or one or two organizing severe storm clusters. Machine learning output and other guidance suggests that potential for strong to severe thunderstorms could persist and potentially become more widespread across the Ohio Valley into Mid Atlantic, and southern Great Plains, next Friday and Saturday. However, uncertainties remain too large at this time to introduce greater than 15 percent severe probabilities. ..Kerr.. 05/10/2025
-
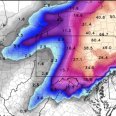
Morning AFD from LWX suggests we all take .LONG TERM /TUESDAY THROUGH FRIDAY/... Main feature through the long term will be an ULL tracking from the Lower Mississippi Valley into the Mid-Atlantic before shearing out late in the week. Rain chances increase notably Tuesday into Wednesday as the ULL moves nearby. Unlike the past several ULLs to impact the area, this one originating from the Gulf will bring much more moisture with it. However, considerable uncertainty remains with QPF amounts among ensemble guidance, though a notable uptick from 24 hours ago. The probabilities of 1" of QPF is now in the 50- 70% range for much of the CWA. Given the spread, 2" probs are generally low, with the exception of the eastern slopes of the Blue Ridge where ensemble guidance highlights generally 30-40% probabilities. It should be noted some members do have several inches of rain across the FA, which could result in flooding if that came to fruition. The Weather Prediction Center has introduced a Slight Risk for excessive rainfall for portions of the area Tuesday/Tuesday night. Hopefully more clarity over the next several forecast cycles.
-
You mean northern va lol
-
WPC has our area outlooked on Days 3 and 4 for excessive rainfall https://www.wpc.ncep.noaa.gov/qpf/excessive_rainfall_outlook_ero.php
- Today
-

2025-2026 ENSO
Stormchaserchuck1 replied to 40/70 Benchmark's topic in Weather Forecasting and Discussion
Very interesting. I think we need to separate the top half and bottom half for "max" and "min". Within that, we assign a +0-9 year lead for best predicted NAO state. For example: If year 2000-2009 is Solar Min with 2004 Solar Min peak (not really data, I am just making an example), we are saying +0-9 years makes 2004-2013 the highest probability for -NAO. I think 2024 was the peak for this Solar Max (correct me if I'm wrong), so we're saying the tendency is for 2024-2033 to be highest likelihood for +NAO, since the next 4-5 years will be declining, but still in the top half, most likely. It is only 1 year before the next Solar Cycle peaks (so coming Solar Min peak) before the NAO tendency actually changes from previous Solar Max peak! Edit: I see 11 years is for the whole cycle to circulate, not to go from one to the other.. so it's just a +NAO tendency until 1 year before coming Solar Min peak, which your research is saying 6-7 years after Solar Max peak, so 2030-2031.. +NAO tendency until ~2029-2030 -
Chuck, If you’d look real closely at the cycles, you’d actually see that the average length from min to max is significantly shorter than that for max to min: Cycle: Min to Max (years)/Max to Min (years) 1: 6/5 2: 3/6 3: 3/6 4: 3/11 5: 6/6 6: 6/7 7: 7/3 8: 4/6 9: 5/8 10: 4/7 11: 3/8 12: 5/6 13: 4/8 14: 4/8 15: 4/6 16: 5/5 17: 4/7 18: 3/7 19: 3/7 20: 4/8 21: 3/7 22: 3/7 23: 4/8 24: 6/5 (25: likely 5/?) Avg of 1-24: 4.3/6.8 % of cycles with shorter rise than fall: 79% % with opposite only 13% —————— Aside: -% with 11 year cycle only 25% though 11 is the average; 29% had 10 year (the mode) -Range 9-14 -Next min very likely within 2030-32. https://www.sidc.be/SILSO/DATA/SN_y_tot_V2.0.txt
-

E PA/NJ/DE Spring 2025 Obs/Discussion
PhiEaglesfan712 replied to PhiEaglesfan712's topic in Philadelphia Region
Today's highs Downtown LA - 91 Long Beach - 89 LAX - 71 -
I got 0.26" here. This after getting only 0.75" from that Thursday through Sunday wet period. My area keeps missing out on the big rain totals, but at least it has been enough to water the vegetable garden over the last week. My tomatoes are growing very quickly.
-
2025-2026 ENSO
Stormchaserchuck1 replied to 40/70 Benchmark's topic in Weather Forecasting and Discussion
You can do "lags" and "leads" A lead is the index comes first.. +1-24 months A lag is the 500mb composite comes before the index.. -1-24 months So -24 months is 2 years before a Solar Max There is actually a -NAO signal at -24 months -12 months before.. transitioning to Neutral So since Solar cycles are almost perfectly cyclical, there is actually a +correlation all the way until 1 year before the next Solar peak (Min or Max)! So if the average cycle is 11 years, that's a 0 to +9 year NAO correlation composite -
You lost me with the bolded.
-
2025-2026 ENSO
Stormchaserchuck1 replied to 40/70 Benchmark's topic in Weather Forecasting and Discussion
I think you get it. If Min = -NAO = +2. If Max = +NAO = +2. If Min = +NAO = -2, If Max =+NAO = +2, so the 2nd set would be "0", and the first set "+4". It's too bad it doesn't go out further. I've tried several times, hoping they would update. It's a 73-year base period, so there is not that much data cut off going out +3-4 years. To do the full 11 years, it would have to be manual, but you can see what NAO state is favored 1-2 years before a Solar Max/Min event at least (weaker overall correlation) -
Thanks. 1) So, for the 6 years, is this correct going from the most -NAO to the most +NAO? min+2 min +1 min max max +1 max +2 2) It’s too bad we can’t see the other 5 years of the 11 year average cycle. But with cycles’ length differing cycle to cycle as opposed to always being 11 yrs, perhaps it would be less useful to go out 3-5 years from max.
-
Nice? 0.35" or > @BDL 6 of the first 9 days including over an inch twice and only 2 of 9 days without measurable rain. Beer?
-
I looked at an apartment in Bristol yesterday and it was a dump lol. Couldnt believe how congested it is on West St. Hope the place you're at doesn't suck.
-
Sitting at 1.6" for the day. On both Sunday and yesterday we had some of the heaviest downpours in quite some time, at least since any convection last summer. From Sunday through today, I'm at almost 5 inches, I think we're good for a bit.
-
2025-2026 ENSO
Stormchaserchuck1 replied to 40/70 Benchmark's topic in Weather Forecasting and Discussion
To bluewave's point, here is the following Winter +1 year after a +PNA December December +12 months January +13 months February +14 months Somewhat of a signal there for warmer than average temps in the eastern 1/2. I didn't sort it out by negative ENSO, but the general gives you a lot more data points. It's on ok signal (ENSO usually changes state the year after a relative PNA Winter, which I will say again is interesting. It's counter-intuitive) -
2025-2026 ENSO
Stormchaserchuck1 replied to 40/70 Benchmark's topic in Weather Forecasting and Discussion
Solar Min is included in the maps. It's Max minus Min If the Solar is 500 (Min) and Max is 1500 (Max) and the average is 1000, Min is [-500] and Max is [+500] The map is default positive phase, with both included, so for the Min, just flip the correlation coefficient around (+0.3 over Greenland vs -0.3). But it's also part of the same map. -
Likely Tropospheric ducting, a atmospheric phenomenon that allows VHF and FM radio signals to travel over a thousand miles beyond their normal range.
-
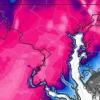
Obviously it's going to be modified for this subforum, but the warmer temps are definitely on track for next week as the Omega Block finally breaks down (which is typicaly how temps respond with the strong subsidence in its wake). In fact, a record high of 101*F (you read that right, not a typo) is forecasted here on Wednesday, with 90s expected all next week starting Tuesday. That said, in the mean time, looking at a mostly cloudy weekend on the western fringe of the ULL with highs in the 70s.