All Activity
- Past hour
-
You could almost predict that the separate layer of interpretive modeling wouldn't even be necessary. A lot of the cause behind their creation was/is to cure both error that's known, but anticipation and suspicion, upon each model run. But therein is the source of the human error...right? In a future whence QC modeling cores are like ...terrifyingly accurate out to 17 some odd days, the interpretations become just a veneer technology layer at the output end of each cycle - more for readability. Yeah ..that would soup to nuts be a bad day for weather forecasters as a profession, wouldn't it?
-

2026-2027 Strong/Super El Nino
GaWx replied to Stormchaserchuck1's topic in Weather Forecasting and Discussion
Latest CDAS suggests resumption of warming started: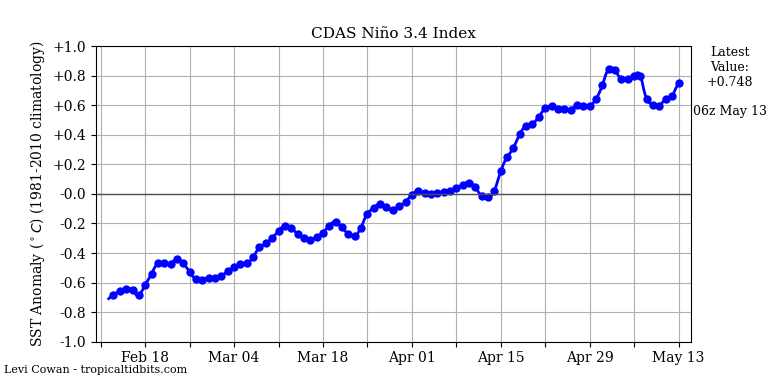
-
I know you have stated this over the years and it's something I believe in as well, but introduce quantum computing and improve model initialization schemes and we will see forecast accuracy improve drastically - and not just accuracy but we probably see less wavering. But who knows...maybe this is a nice theory lol
-
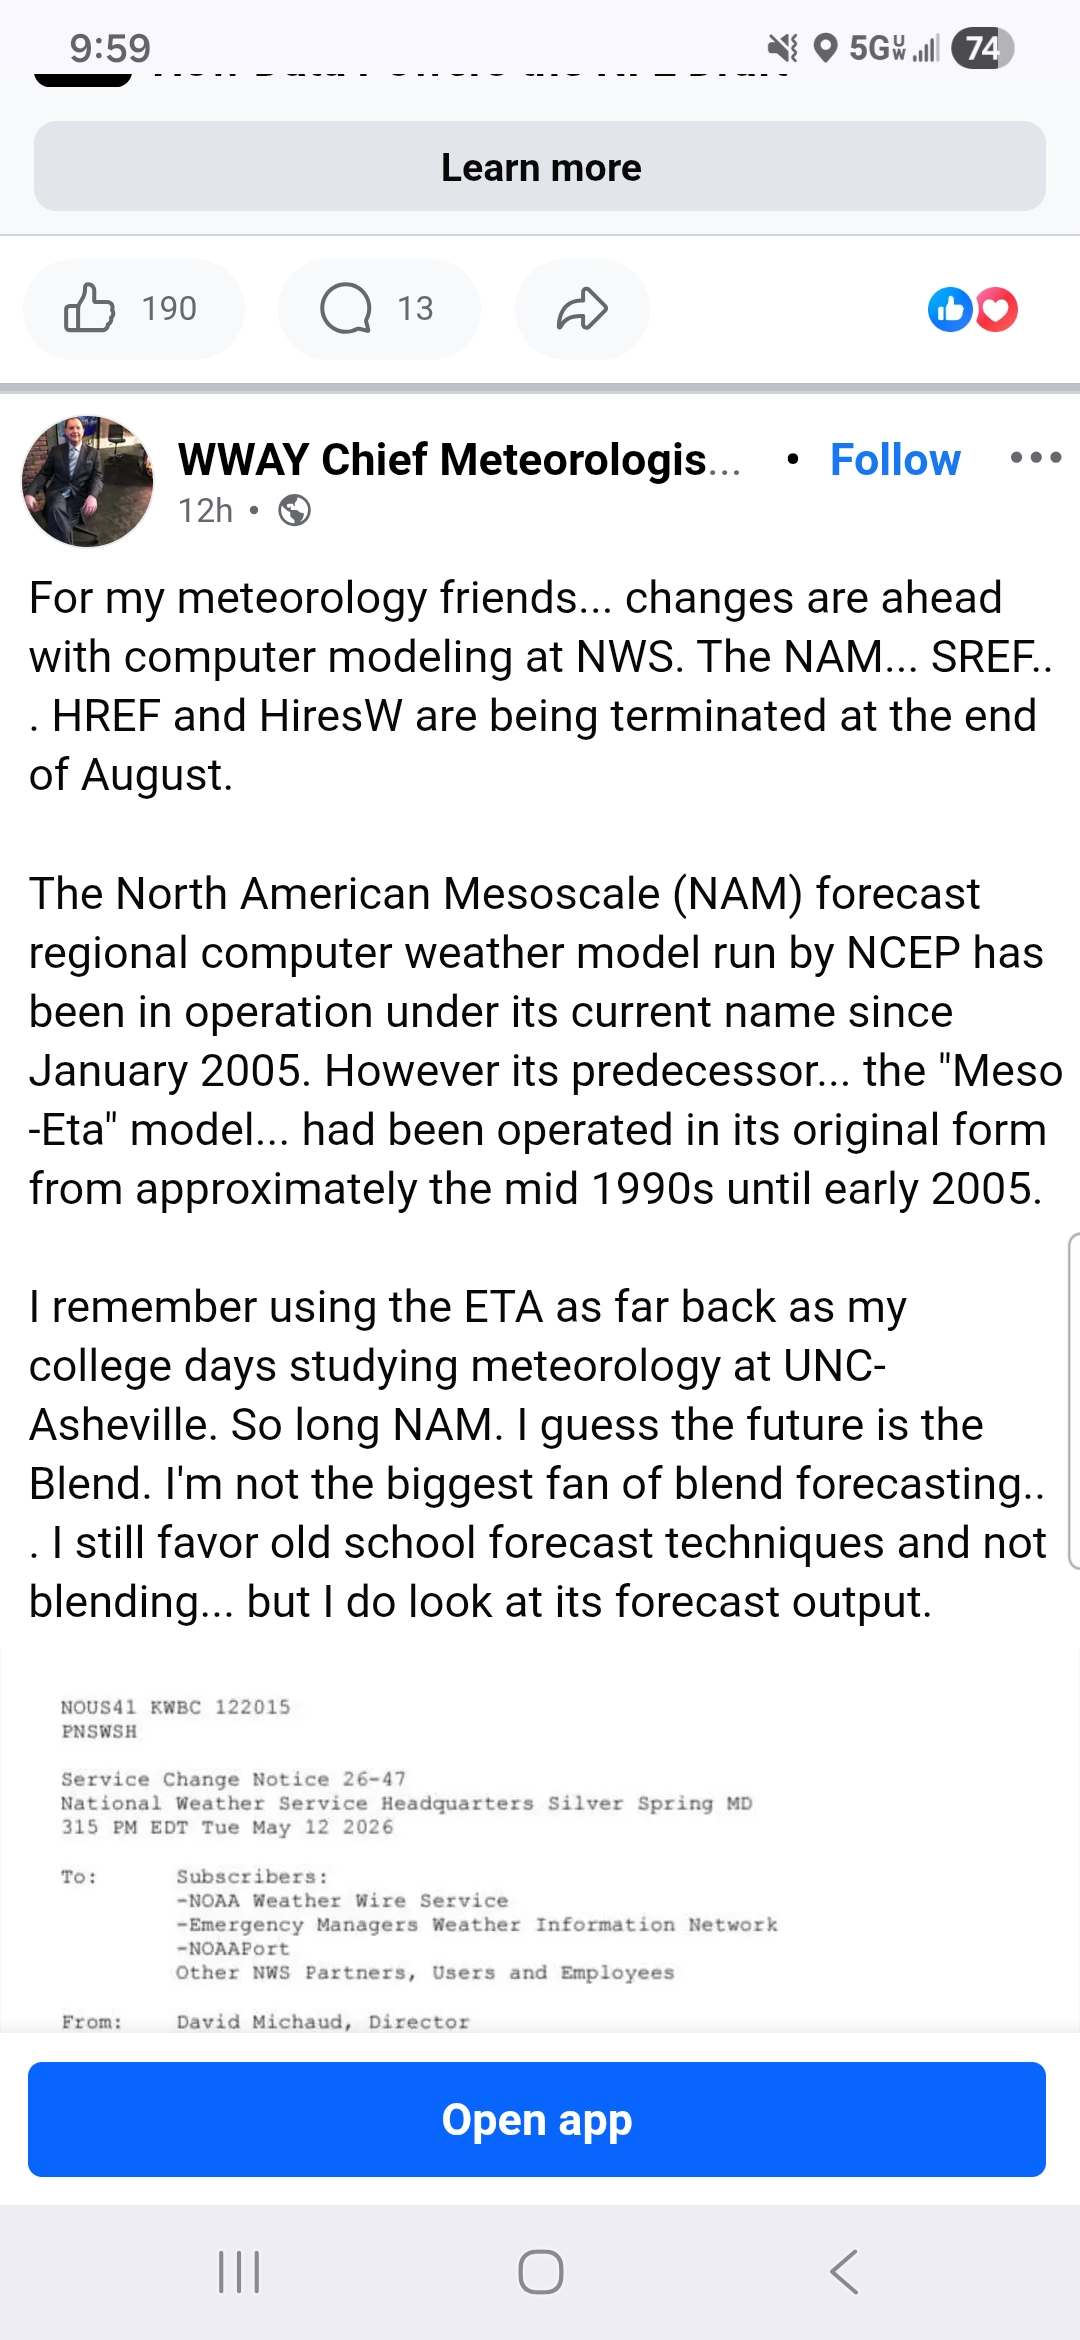
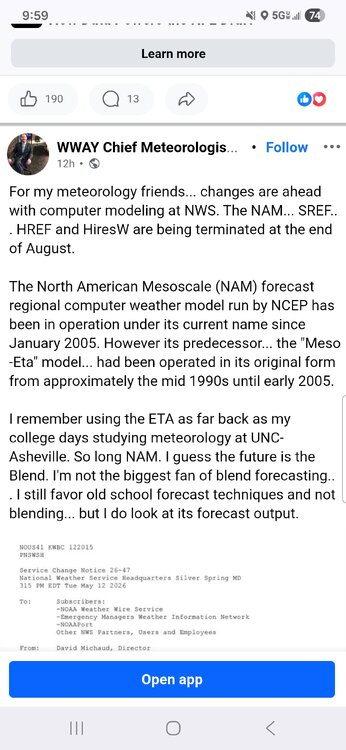
I take everything with a grain of salt, but I think I heard someone mention it in here in the past as well....im gonna miss being NAM'd.... in both good ways and bad lol
-
2026-2027 Strong/Super El Nino
GaWx replied to Stormchaserchuck1's topic in Weather Forecasting and Discussion
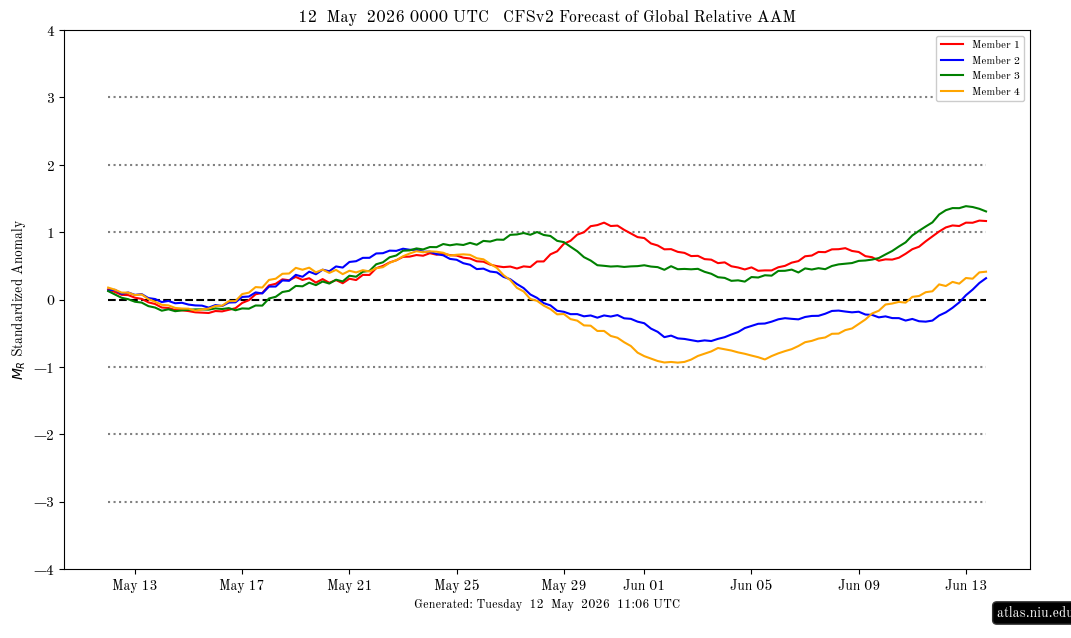
Latest CFSv2 ens AAM prog: nothing notable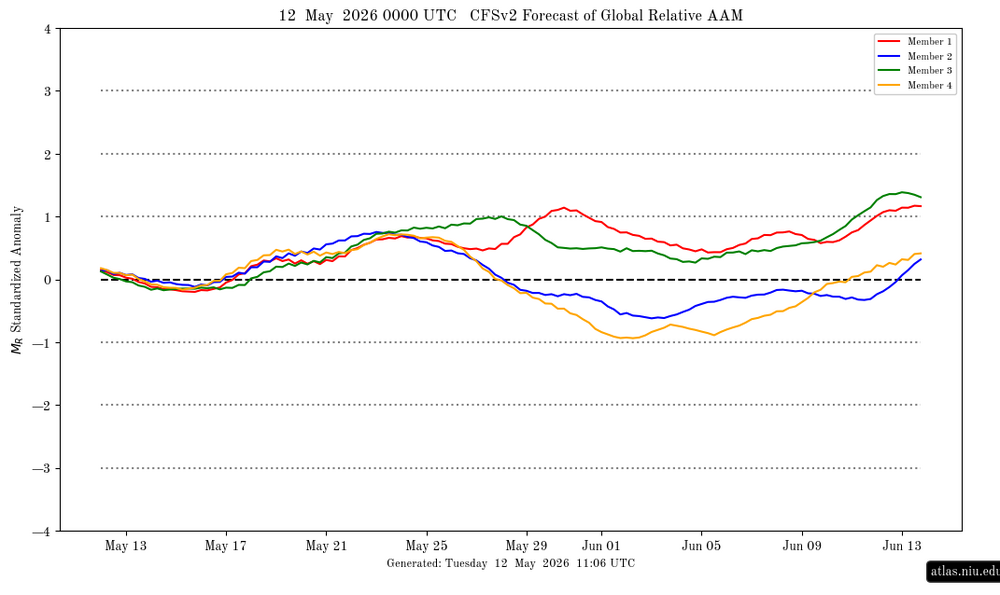
-
Yeah, but those are interpretive tools, after that fact. Ha! Interpretative tools like that compendium you gave there, they are created by humans. You know what that means ... it means we're likely to introduce a whole new layer of potential error. LOL Drool human aside ... one might suspect general error improves, in step, with/if the raw data source improves; because obviously interpretive algorithms are tapping into less error...etc.
-
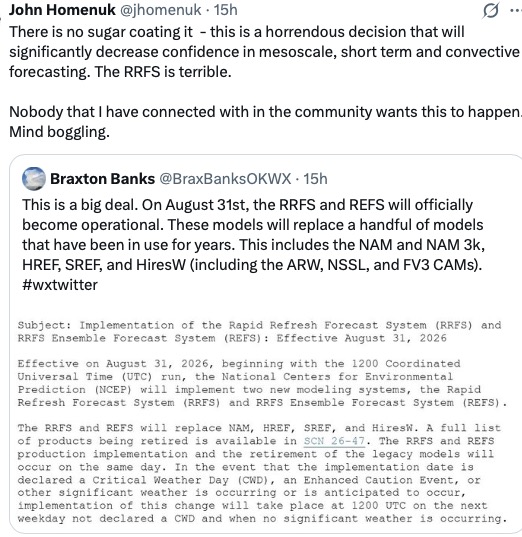
So now what do we say when the RRFS crushes us with wind?
-
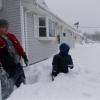
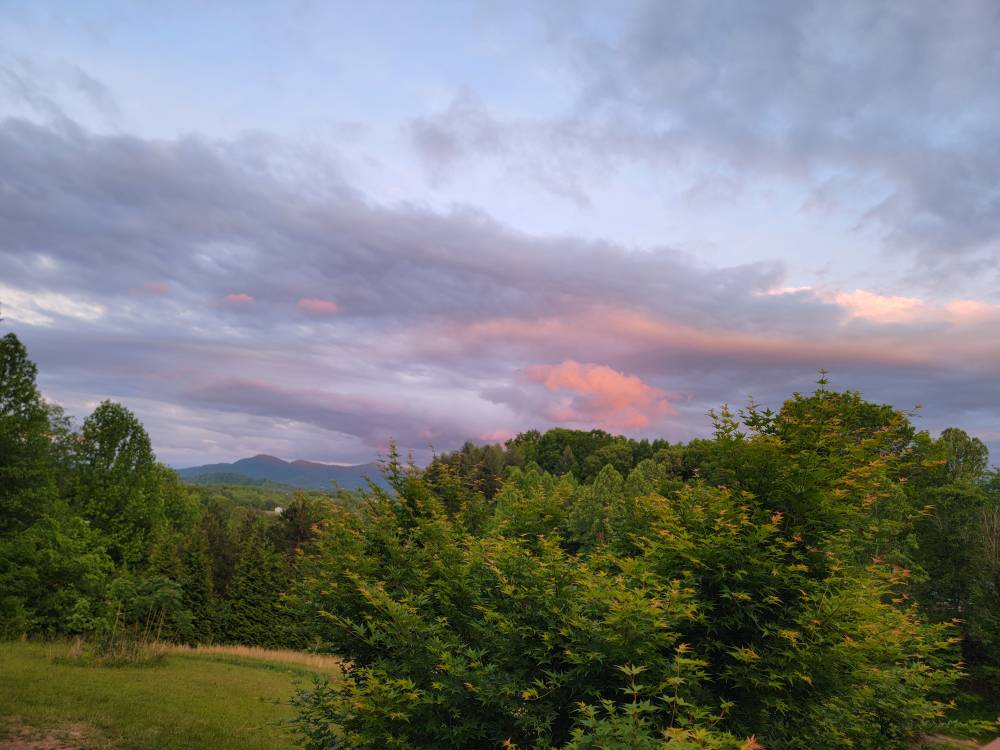
A beautiful sunset the other evening. Sent from my SM-G998U using Tapatalk
-
This week has been beautiful. Highs in the 60s and lows in the 40s.
-
Part of the degrading in forecasting too is all of these stupid products that exist. Model snowfall maps, Freezing Rain Accumulation maps, Supercell Composite Parameter, Significant Tornado Parameter, the stupid hazard type at the bottom right of the SHARPpy forecast soundings, maybe throw updraft helicity swaths in here too
-
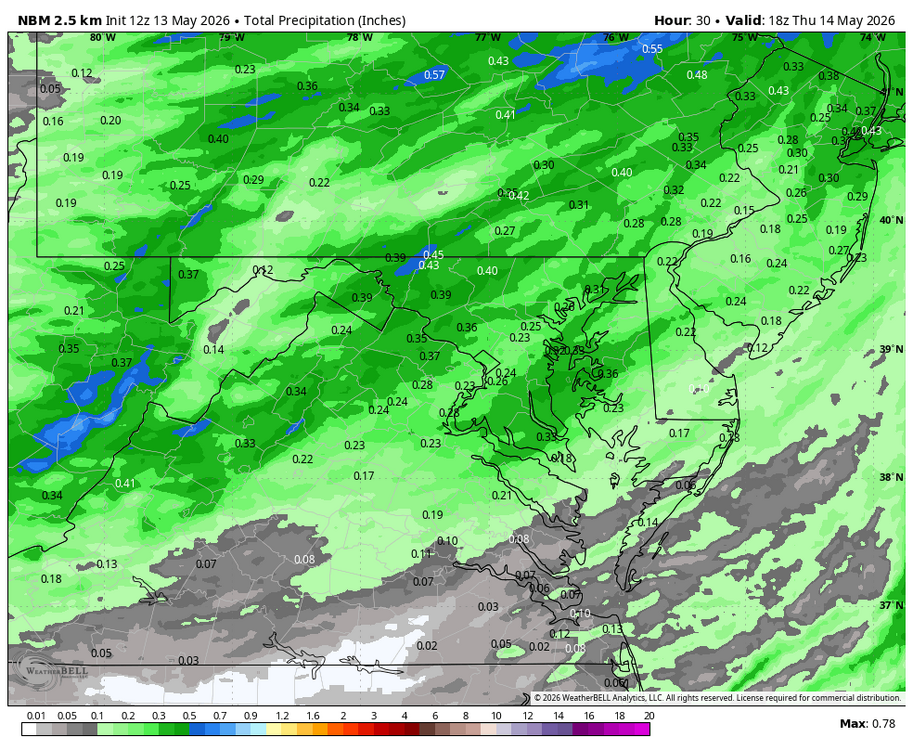
Looks like tomorrow's rain event is fizzling again. Maybe .25"
-
The dry period has been nice after weeks of rain, but after 2+ weeks of nothing we need rain again. Fortunately, we should get it this weekend into early next week.
-
As long as it's not 50 degrees in the daytime soon thereafter, I'll be okay with this.
-
WB 12Z NBM for upcoming "rain" event....
-
Today won't be terrible here once we get this warm front north. 65-70 most of CT.
-
Not that anyone asked but imho, this sort of evolution was both inevitable, but quite possibly necessary to keep up. It kind of goes along with arguing against those with AI paranoia ( in general...), posturing all these dystopian fears over a future guided by x-y-z plausible consequence... There may be value in those concerns, but unfortunately, where was all this improving computing power over the generations going to go in the first place? The advent in technological history of Artificial Intelligence, at least to the scale of an Asimovian simulacra, was going to eventually result - and it's not impossible that actual self-awareness ( currently dubbed 'the singularity' in popular culture ) will one soon enough arrive. Digression thee, but in the same sense an evolution of these modeling systems is just as inevitable. Beyond that concept, these rapid update species make more sense to have in place with the inevitability of a more ubiquitous as Quantum Computing "comes on line". This latter aspect is going to be the biggest game changer in forecast modeling since Fourier Transform theory was integrated by Navier-Stokes fluid mechanics - the fundamental principle of how wave mechanics are propagated through the atmospheric medium. .. caressed by thermodynamics, 3-D integral vector calculus and parameterized by the Coriolis Parameter... one can perhaps intuitively see how/why this becomes exponentially more blown up by chaos out in time, because all those tiny wave functions both initially, and emergent along the processing way, feed back on crippling the outlook by corruption. Quantum Computing does such a vastly improved ability at predicting where and most importantly whence those area fabricated, it can also tell something about whether they are fictitious or real. Keep the real; toss the sci-fi. What remains is ...panacea for random contamination if you will, a fix for what the original modeler forefathers warned, 'because we can't asses the actual quantum states of every particle in space and time, chaos that results means that no weather model will be sufficiently accurate beyond a certain number of days' In the years since ...that had been extended considerably just by coming up with more physically proven mechanics, combined with denser empirical input data ( initialization of grids and so forth). A lot of error production while processing comes from interpolation to "fill" gaps in data sparseness...etc, because interpolation is estimating. In other word, probability guess-work. Thus, input density and increased conventional computing power did/does extend outward by reducing the uncertainty cost. But there's ultimately still a theoretical limit; if we are not sampling at the discrete-est levels, and then computing in the same scalar space, we are about as far as we can go to improve using conventional tech. With ever improving sensory technology combined with arriving Quantum Computing ... that sounds quite a bit like we closing that gap on Quantum blindness. Sorry...just some op ed'ing.
-
Yeah, the last Nam upgrade was in March of 2017. It nailed the January 2016 event. Sad to see the SPC HREF go as its ensemble max snowfall was actually pretty good with the split bands west and east of NYC and 20”+ amounts for the February 2026 event. https://www.noaa.gov/media-release/review-of-jan-2016-blizzard-preliminary-snow-totals-validates-dc-measurement The preliminary Central Park measurement will be adjusted upward to 27.5 inches, which will become an all-time snowfall record for New York City when certified by NOAA’s National Centers for Environmental Information. A communication error between the weather forecast office in Upton, New York, and the Central Park Conservancy, which volunteers to take official snow measurements in Central Park, led to an inaccurate preliminary total of 26.8 inches. The snow team found the mistake when reviewing the Conservancy’s logbook.
-
awww yeah. gonna cook
-
People swear it's not windy here. It's always windy.
-
Devastating. We'll never get NAM'd again.
-
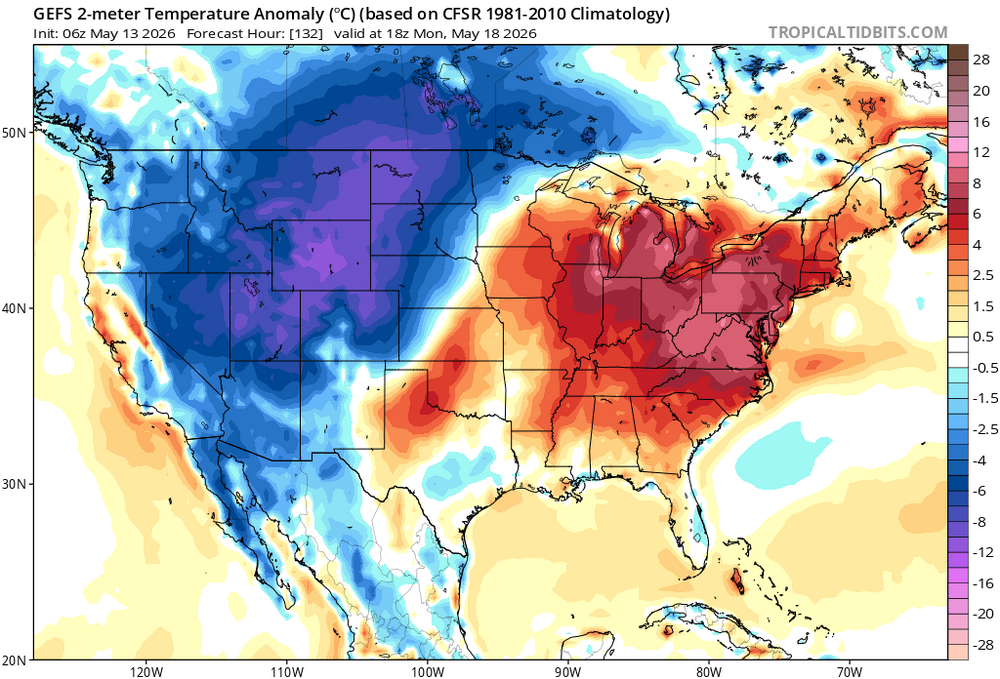
Can confirm. The warm season is ready to come in like a banshee
-
Records: Highs: EWR: 92 (1956) NYC: 89 (1956) LGA: 89 (1956) JFK: 82 (2004) Lows: EWR: 37 (1938) NYC: 39 (1895) LGA: 42 (2019) JFK: 41 (2020) Historical: 1866: A tornado destroyed a toll bridge near Barnet, VT. (Ref. Wilson Wx. History) 1878: Record low temperature for Washington, DC for the date is 39 °F. (Ref. Washington Weather Records - KDCA) 1881: Record maximum temperature for Washington, DC for the date is 95 °F. (Ref. Washington Weather Records - KDCA) 1922: A mid-afternoon hailstorm dropped hailstones 0.5 inches in diameter at Montpelier, VT. Along the 550 yard wide and 3 to 4 mile long hail swath, ice laid 4 inches deep with local piles up to two feet deep. (Ref. Wilson Wx. History) 1930 - A man was killed when caught in an open field during a hailstorm northwest of Lubbock TX. It was the first, and perhaps the only, authentic death by hail in U.S. weather records. (David Ludlum) 1961: A late season storm covered Cheyenne, WY with 10.3 inches of snow. (Ref. Wilson Wx. History) 1975: Severe thunderstorm winds lasting 20-30 minutes damaged over 90 of the 600 planes based at the Ft. Lauderdale International Airport. The FAA tower measured winds gusting to 101 mph. Tied down aircraft were ripped from their moorings. The roof of the terminal was slightly damaged, hail was reported and two inches of rain fell in an hour. Tennis-ball size hail fell at Wernersville, PA. Hail accumulated to a depth of 10 inches. (Ref. Wilson Wx. History) 1980: An F3 tornado ripped directly through the center of Kalamazoo, Michigan, killing five people, injuring 79, leaving 1,200 homeless and causing $50 million in damage. The tornado passed directly over the American Bank, where a barograph reported a pressure drop of 0.59 inches. 1981 - A tornado 450 yards in width destroyed ninety percent of Emberson TX. People did not see a tornado, but rather a wall of debris. Homes were leveled, a man in a bathtub was hurled a quarter of a mile, and a 1500 pound recreational vehicle was hurled 500 yards. Miraculously no deaths occurred in the tornado. (The Weather Channel) 1987 - A cold front brought an end to the early season warm spell in the north central U.S., but not before the temperature at Sioux City IA soared to a record warm 95 degrees. Strong southwesterly winds ahead of the cold front gusted to 52 mph at Marais MI. Evening thunderstorms produced golf ball size hail at Rockford MN, and wind gusts to 75 mph at Belmond IA. (Storm Data) (The National Weather Summary) 1988 - Strong winds along a cold front ushering cold air into the northwestern U.S. gusted to 69 mph at Myton UT. Temperatures warmed into the 80s ahead of the cold front, as far north as Montana. (The National Weather Summary) (Storm Data) 1989 - Thunderstorms developing along a warm front produced severe weather in the Southern Plains Region during the afternoon and night. A thunderstorm at Killeen TX produced wind gusts to 95 mph damaging 200 helicopters at Fort Hood causing nearly 500 million dollars damage. Another thunderstorm produced softball size hail at Hodges TX. (The National Weather Summary) (Storm Data) 1990 - Thunderstorms developing ahead of a cold front spawned ten tornadoes from eastern Wyoming to northern Kansas, including seven in western Nebraska. Thunderstorms forming ahead of a cold front in the eastern U.S. spawned five tornadoes from northeastern North Carolina to southern Pennsylvania. Thunderstorms over southeast Louisiana deluged the New Orleans area with four to eight inches of rain between 7 AM and Noon. (The National Weather Summary) (Storm Data) 1995: This outbreak produced tornadoes extending from the Mississippi River near Burlington, Iowa, to the west of Bloomington, Illinois. Two violent tornadoes, each ranked at F4 intensity, were reported. The first tornado traveled 60 miles from near Fort Madison, Iowa, to the southeast of Galesburg, Illinois producing over $10 million damage. The town of Raritan, Illinois was hit the hardest. The second violent tornado traveled 7 miles across Fulton County from Ipava to Lewistown, Illinois producing $6 million damage. Another strong tornado took a 25-mile path across parts of Fulton, Mason, and Tazewell Counties. The storms also produced softball-size hail south and northwest of Macomb in Illinois. Five men were injured in Lawrence County, Indiana when lightning struck one of them and traveled to the other four. There were 184 reports of severe weather, including over three dozen tornadoes. 2001: Two brothers hiking with their family in the Zion National Park in Utah were swept away when flash flooding suddenly struck after a burst of heavy rain. The youngsters were ahead of the rest of their family when they came to a part of the trail that was underwater. They were swept away as they attempted the cross the flooded part of the trail. 2002: (12th-13th) flash flooding occurred on almost every watercourse in MO’s Iron County; $5.5 million damage. Many people trapped in cars by flood waters. Near Ironton, a man crossing Stouts Creek by foot to rescue his dogs was swept away/drowned. (Ref. Weather Guide Calendar with Phenomenal Weather Events 2011 Accord Pub. 2010, USA) 2008: Shreveport-Bossier, Louisiana: Torrential rainfall breaks several records, including the most rain to fall in a 20-minute interval and the most rainfall in a 180-minute period. More than 10 inches of rain deluged the Shreveport area, flooding at least 125 homes. The National Weather Service reports 4.43 inches fell in one hour braking the old record of 3.16 inches. (Ref. WxDoctor)
-
63 / 48 clouds and showers shunted north for now. Clouds coming in maybe some stray showers/light rain later. Wet Thursday 0.25 - 0.50. The cut off trough ull slowly moves through and out Friday with late clearing but cool. Moderation quickly to a much warmer pattern Sat (5/16) - beyond. >80s Sat - Wed for many and perhaps some 90 degree readings on Mon/Tue. After a transient front , ridge rebuilds and outside of onshore tenedency an overall warm to very warm period ensuing through the Memorial day weekend and the the week of may 26th.
-

2026-2027 Strong/Super El Nino
snowman19 replied to Stormchaserchuck1's topic in Weather Forecasting and Discussion
If this traditional ONI projection is correct, we would not only set a record for the traditional ONI since 1950, it would also set a record for the new RONI. If we assume the RONI lags the ONI by .05C to 0.6C and the traditional ONI peaks at that level, it would very easily beat the highest RONI on record since 1950, which was 1982-83 at +2.5C ^ “Well, after looking through the climate reanalysis on SST anomalies dating back to 1980. If the Preliminary SSTs get confirmed. We are now ahead of the 3 most famous El Niños on record. 1982-1983, 1997-1998 & 2015-2016. Again, I'm not kidding, we are running about 0.18 °C higher. This El Niño has a very high ceiling with a possible peak in November & December of this year of 3.5-3.9 °C above average. Not only that, there is a slim possibility that SST in the Niño 3.4 region may hit a new all-time record of 29.9-30.0 °C, which is 85-87 F.” -
Not a popular move. I feel the same way...see above.