All Activity
- Past hour
-
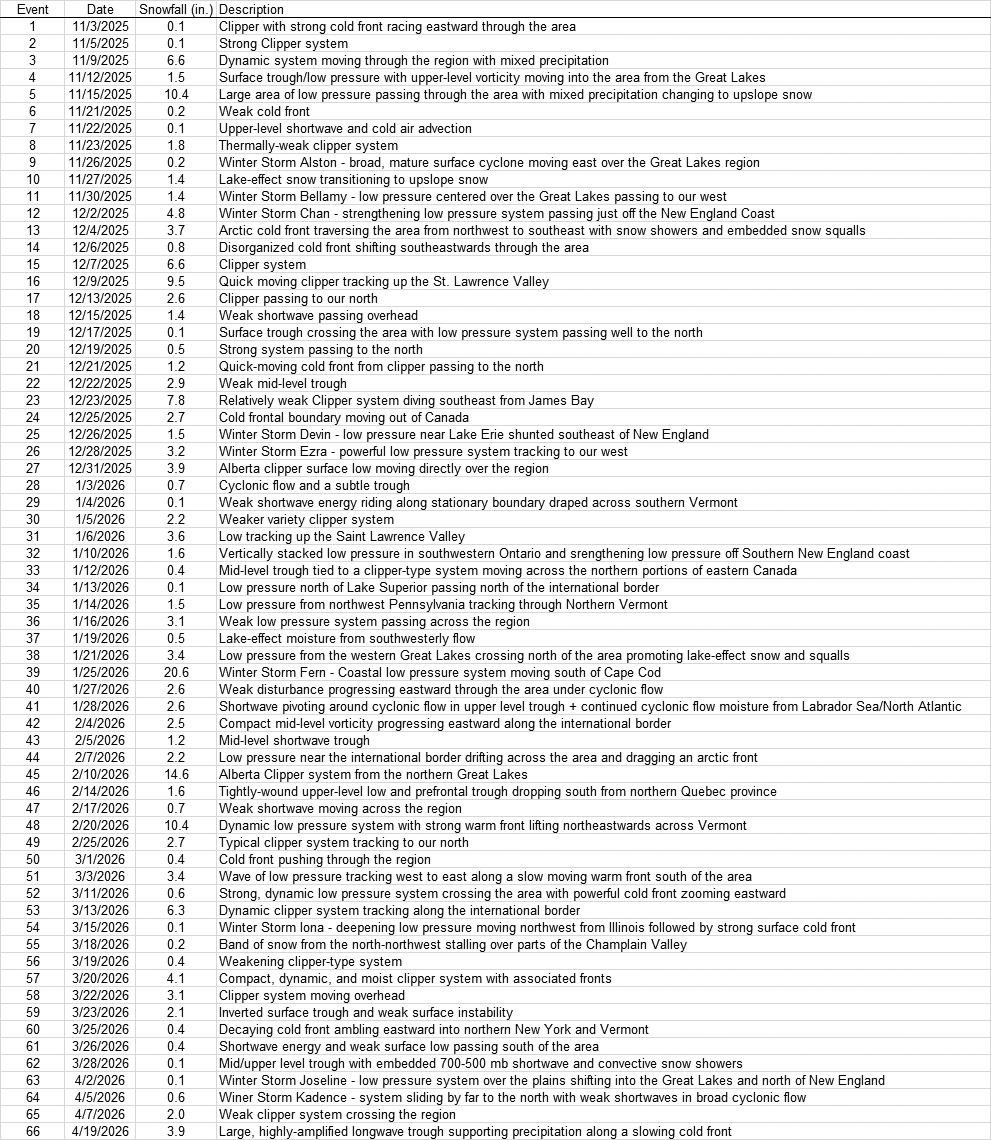
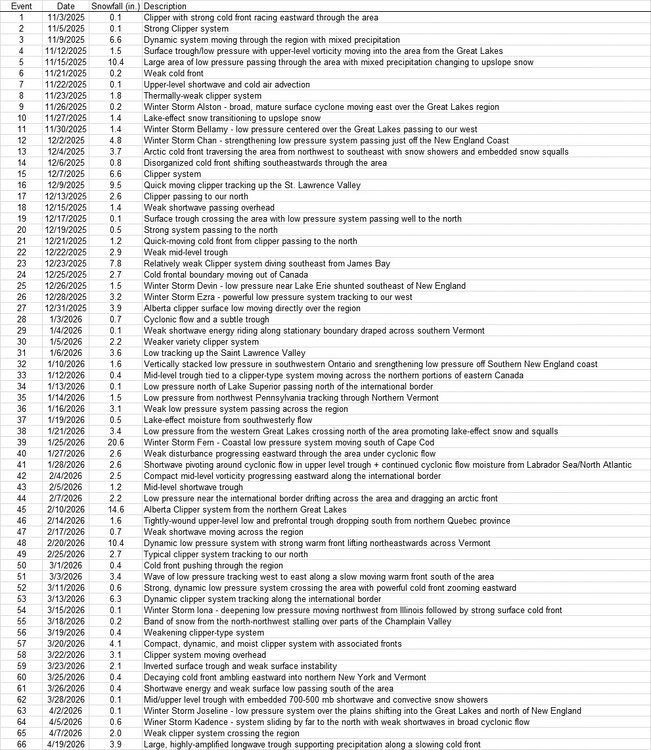
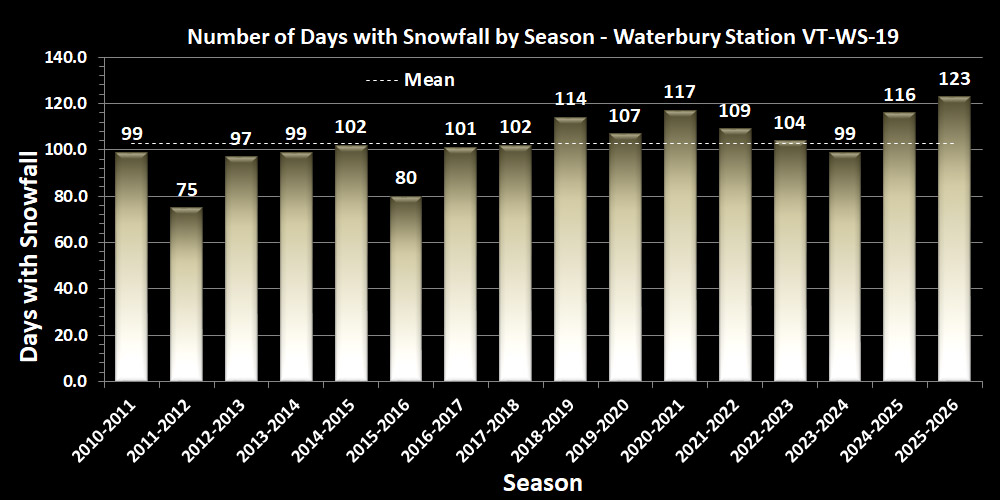
We’re onto summer around here, and I’ve now had a chance to assemble our site’s snow data for the past winter. It was a decent season, with 184.1” of total snow accumulation, and all eight snowfall months of October through May were either above or near their average snowfall numbers. That means that none of the months were notably poor performers in the snowfall department, which is a testament to the high level of winter consistency we had throughout the season. In that same vein, none of the months were absolute blockbusters either. A wintry November got the snowfall season off to a strong start with plenty of cold and snow, and that early snowpack helped to set up a great ski season. Although it was a solidly snowy November, it didn’t set a lot of records. The winter snowpack started on November 11th , and the month had 23 days with snow on the ground. There were 11 snowstorms, 23.5” of total snow, and 20 days with snowfall. The 20 days of snowfall for the month was actually a record, besting November 2023 by 1 day. Another record acquired during the month was the earliest double digit snowstorm I’ve recorded here, which was attributed to the November 15th storm. That’s not a record specific to November, but it certainly helped reinforce the wintry tenor of the month. Overall, it was a great month to lock in the wintry vibe for the holiday season and indeed the rest of the winter here in the mountains. For a while it looked like things were setting up for back-to-back 200”+ snowfall seasons here in the valley, but there was no big final snowfall push in March and April; they were just decently average snowfall months, and the season didn’t quite get to that 200” mark. In the end, 2025-2026 wound up in 6th place for total season snowfall in the site records. Although total snowfall wasn’t near a record, there were a lot of days with snow, so the season can certainly be highlighted for its consistent snowfall. Along with November, December, January, and March all tied or broke records for their number of days with snowfall, so it’s not surprising that the overall season broke the record as well by having 123 days in which new snow was recorded. That number meant that this past season beat out the previous record holder, 2020-2021, by 6 days. If this past season’s snowfall days were stacked together, that would be over four months in which it snowed, every day. It speaks to the emphasis on putting your vehicles in a garage or getting them under some other sort of cover if you don’t want to constantly be cleaning the snow off them. In line with the snowy theme for the season, we also had a ton of snowstorms – a record number of them in fact. This season tied the record for the number of December snowstorms with 16, broke the record for the most March snowstorms with 13, and set the record for the greatest number of accumulating storms of any season at 66. This season beat out the previous record of 64 storms held by the 2018-2019 season, and this season’s detailed winter storm list to date is posted after rest of the data. The season’s snow data are listed below, with parameters that set or tied records highlighted in green. Total Snowfall: 184.1” October Snowfall: 0.0” November Snowfall: 23.5” December Snowfall: 49.8” January Snowfall: 46.6” February Snowfall: 36.0” March Snowfall: 21.6” April Snowfall: 6.6” May Snowfall: 0.0” Total Days with Snowfall: 123 October Days with Snowfall: 0 November Days with Snowfall: 20 December Days with Snowfall: 27 January Days with Snowfall: 29 February Days with Snowfall: 22 March Days with Snowfall: 19 April Days with Snowfall: 6 May Days with Snowfall: 0 Snowstorms: 66 October Storms: 0 November Storms: 11 December Storms: 16 January Storms: 14 February Storms: 8 March Storms: 13 April Storms: 4 May Storms: 0 Average Snowfall per Storm: 2.8” Largest Storm: 20.6” 2nd Largest Storm: 14.6” 3rd Largest Storm: 10.4” 4th Largest Storm: 10.4” 5th Largest Storm: 9.5” Sum of 5 Largest Storms: 65.5” Storms ≥10": 4 Date of Largest Storm: 1/25/26 Earliest Frozen Precipitation: 11/4/25 Earliest Accumulating Snowfall: 11/4/25 Earliest 1" Storm: 11/10/25 Earliest 2" Storm: 11/11/25 Earliest 3" Storm: 11/11/25 Earliest 4" Storm: 11/11/25 Earliest 6" Storm: 11/11/25 Earliest 8" Storm: 11/17/25 Earliest 10" Storm: 11/18/25 Earliest 12" Storm: 1/26/26 Latest Accumulating Snowfall: 4/20/26 Latest Frozen Precipitation: 4/20/26 Length of Snowfall Season: 168 days Start of Season Snowpack: 11/11/25 October days with Snowpack: 0 November days with Snowpack: 21 December days with Snowpack: 31 January days with Snowpack: 31 February days with Snowpack: 28 March days with Snowpack: 31 April days with Snowpack: 12 May days with Snowpack: 0 Days with >0" Snowpack: 154 Days with >0.5" Snowpack: 137 Days with ≥1" Snowpack: 132 Days with ≥2" Snowpack: 127 Days with ≥3" Snowpack: 118 Days with ≥4" Snowpack: 114 Days with ≥6" Snowpack: 100 Days with ≥8" Snowpack: 87 Days with ≥10" Snowpack: 62 Days with ≥12" Snowpack: 47 Days with ≥15" Snowpack: 42 Days with ≥18" Snowpack: 34 Days with ≥20" Snowpack: 29 Days with ≥24" Snowpack: 13 Days with ≥30" Snowpack: 0 Days with ≥36" Snowpack: 0 Max Snow Depth: 29.0” Date of Max Snow Depth: 2/21/26 End of Season Snowpack: 4/10/26 Continuous Snowpack Season: 151 days Snow-Depth Days: 1528.0 inch-days SDD/Snowfall Ratio: 8.30 Total liquid equivalent: 21.79” Frozen liquid equivalent: 10.86” % Frozen L.E.: 49.8% Total Snow/Total Liquid Ratio: 8.45 Total Water Content: 11.8% Total Snow/Frozen Liquid Ratio: 16.95 Frozen Water Content: 5.9%
-
2026-2027 Super El Nino
40/70 Benchmark replied to Stormchaserchuck1's topic in Weather Forecasting and Discussion
I think these changes are entirely immaterial with the degree of warmth throughout ENSO. -
 buy viagra here: MedMenNews - buy viagra here
 -
Today's Highs PHL: 89 New Brnswck: 89 BLM: 88 TEB: 88 EWR: 87 LGA: 86 TTN: 86 ACY: 85 NYC: 85 ISP: 83 JFK: 83
-
Hope you read this afternoon's AFD for your area, especially when they mention November and the earliest Twin Cities snowfall on record in there: .DISCUSSION... Issued at 303 PM CDT Fri Jul 31 2026 If I showed you the current water vapor satellite imagery and asked you what date you thought this was from, I would not blame you if you said November. There is a nice baroclinic leaf across the upper MS valley into the western Great Lakes and a dry slot moving across northeast KS into southeast MN. Although today has been a washout and a rather crummy weather day, we haven`t heard too many complaints coming out of a 2 week stretch where most places saw less than a quarter of an inch of rain with highs frequently topping out in the 90s. We`ve seen some impressive rainfall totals today and have seen the gauges to backup the MRMS rainfall estimate bullseye of 6-8" of rain down around St. Peter and Le Sueur. Despite some rather larger rainfall numbers, this rain has come over a period of of 12 hours, not in just 3 or 4 hours, which means impacts from this rainfall (in terms of flooding) have been fairly minimal. Even though this heavy rainfall fell almost entirely within the MN River Basin, rises along the river are expected to remain within the stream banks. No matter how you slice it, this was an incredibly beneficial rain that has come with very few negative impacts. For the weekend, we will not accept any complaints about the weather! We`ll have rising heights and subsidence, which means mostly sunny skies with temepratures near normal and dewpoints retreating into the 50s and 60s. There has been some concern about smoky skies returning, but visible satellite imagery this afternoon looks pretty clean from the Dakotas back across Wyoming and Montana, so even chances for elevated smoke look pretty limited this weekend as well. Get out there and enjoy the outdoors this weekend, we`re only 54 days away from the earliest snowfall on record here in the Twin Cities! (September 24, 1985) We`ll start next week with a cold front dropping across the area Monday night through Tuesday morning. Right now, we look to miss- time this front. We`ll be getting the leftovers of whatever happens in the Dakotas and northwest MN Monday afternoon late Monday night in central/western MN, while the front should be far enough along Tuesday afternoon to where we`ll be too far west to see any storms that form with daytime heating on Tuesday. Behind this front, we`ll get another hit of pleasant Canadian air for the middle of next week. They seem to be passing what will evolve into the cutoff low as a fall-like storm. A bit early for this kind of stuff.
-

2026-2027 Super El Nino
mitchnick replied to Stormchaserchuck1's topic in Weather Forecasting and Discussion
It's bad enough current SSTA vary from different products/sources, now we have models prog depictions following along. No wonder there's rarely agreement on forecasts...or on this Board! Lol -
1.53” of rain. Slow deep soak.
-
 Last week we had storms go north and south. This week it was west and east. 4.65 for the month. This week was 2 inches.
 -
 Only the office dwellers with lawn services wish for it.
 -

2026-2027 Super El Nino
GaWx replied to Stormchaserchuck1's topic in Weather Forecasting and Discussion
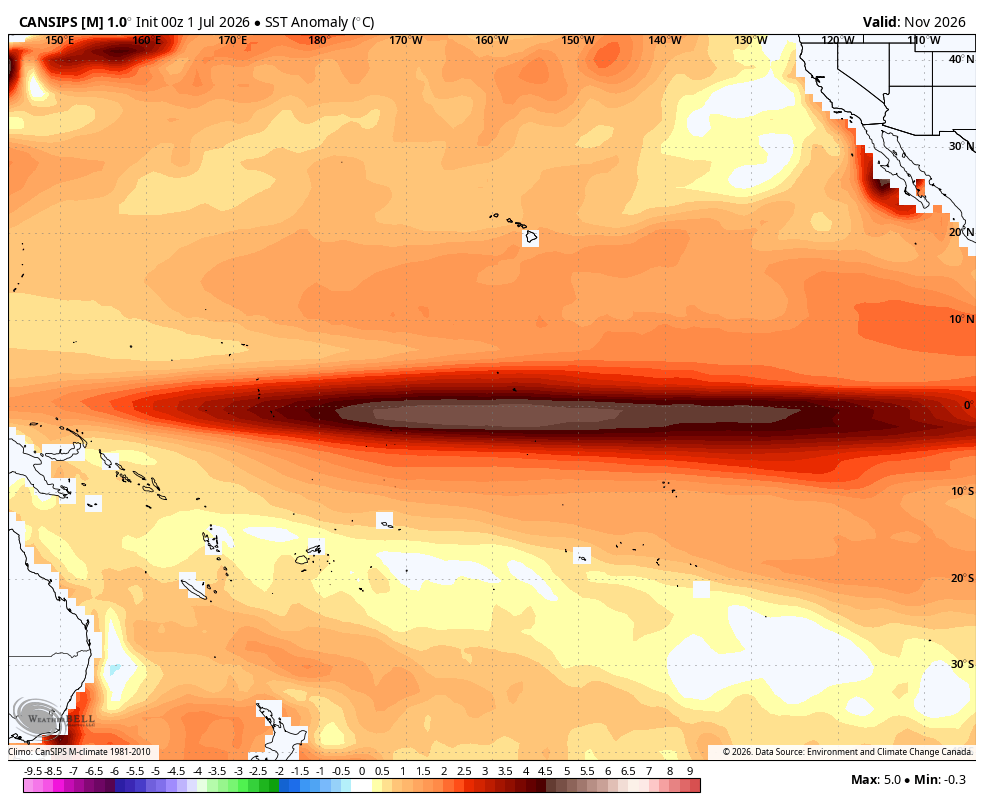
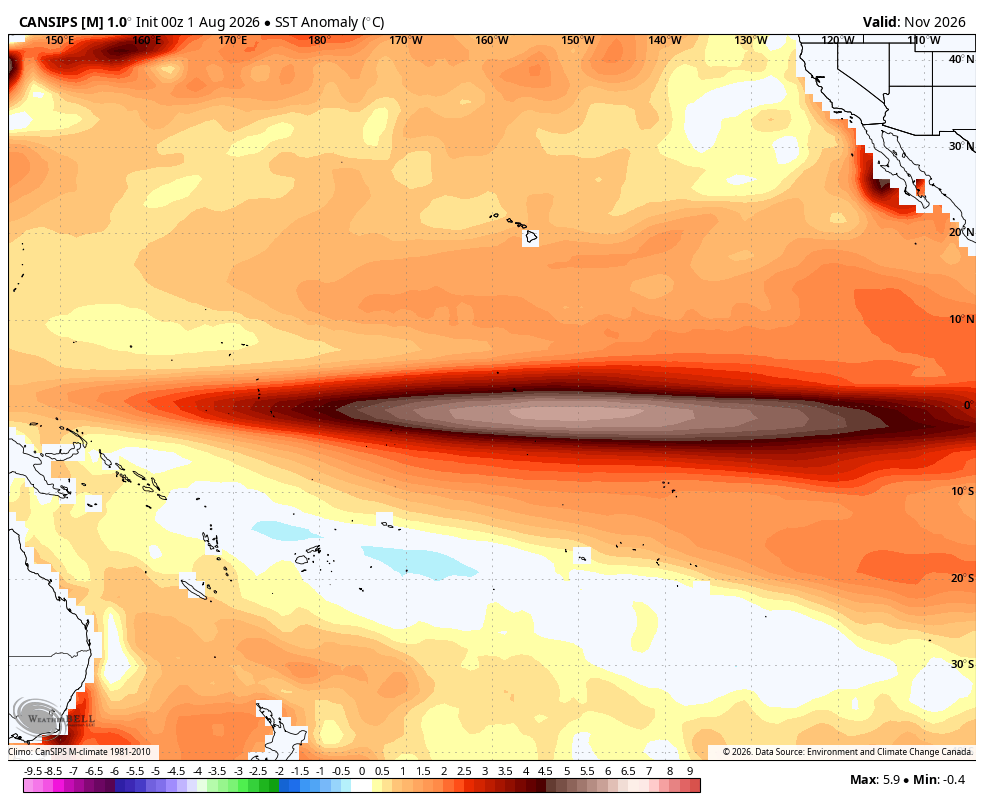
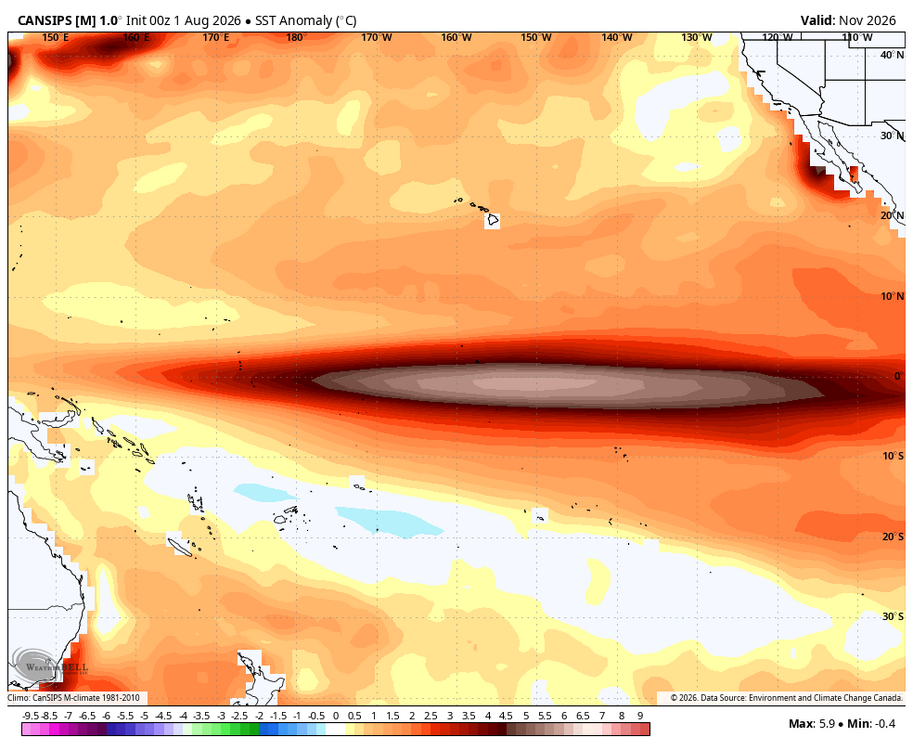
The maps I was basing my post on were from weathermodels.com and were using 1991-2020 for base climo. But since I posted that, the WxBell Aug 1st version came out. It uses 1981-2010 for climo. WB had the warmest anomalies centered in Nov near 180 for the April-June 1st runs and significantly further E (near 160W) for the July 1st run. WB (using 1981-2010 base) has its Aug 1st Nov warmest centered near 150W, which is C based/basinwide and not E based like weathermodels.com’s (1991-2020 base) 130W. So, the WB 1981-2010 base version also moved E, but not nearly as far as the weathermodels 1991-2020 base version, which has it all the way E to 130W (pretty E based): WB 7/1/26 SSTa run for Nov (1981-2010 base) centered ~160W WB 8/1/26 SSTa run for Nov (1981-2010 base) centered ~150W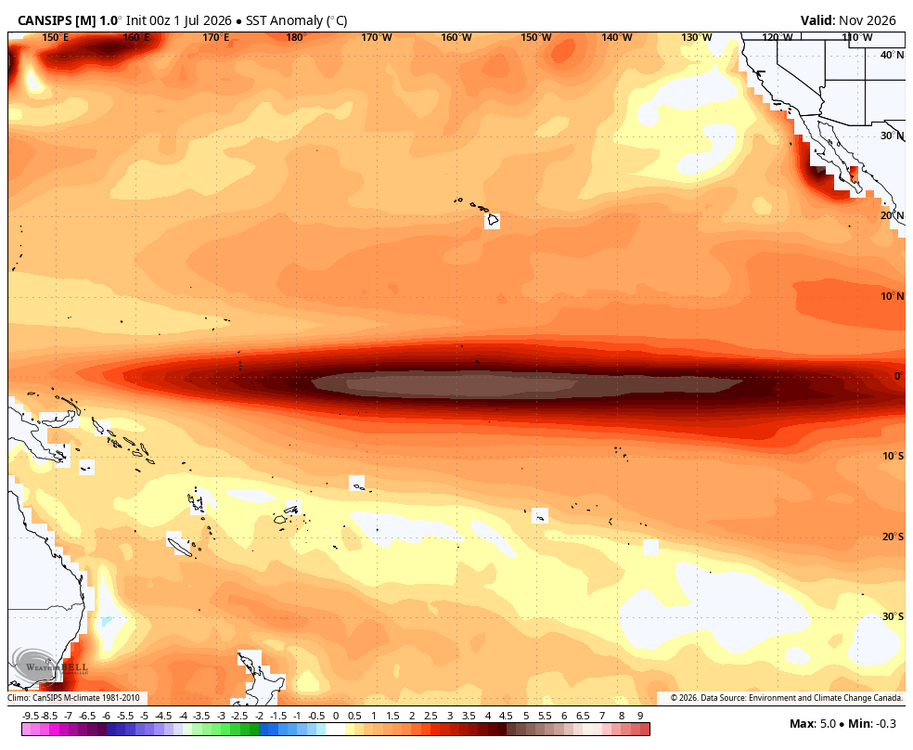
-
 I hope my gif helped to break your bad luck
 -
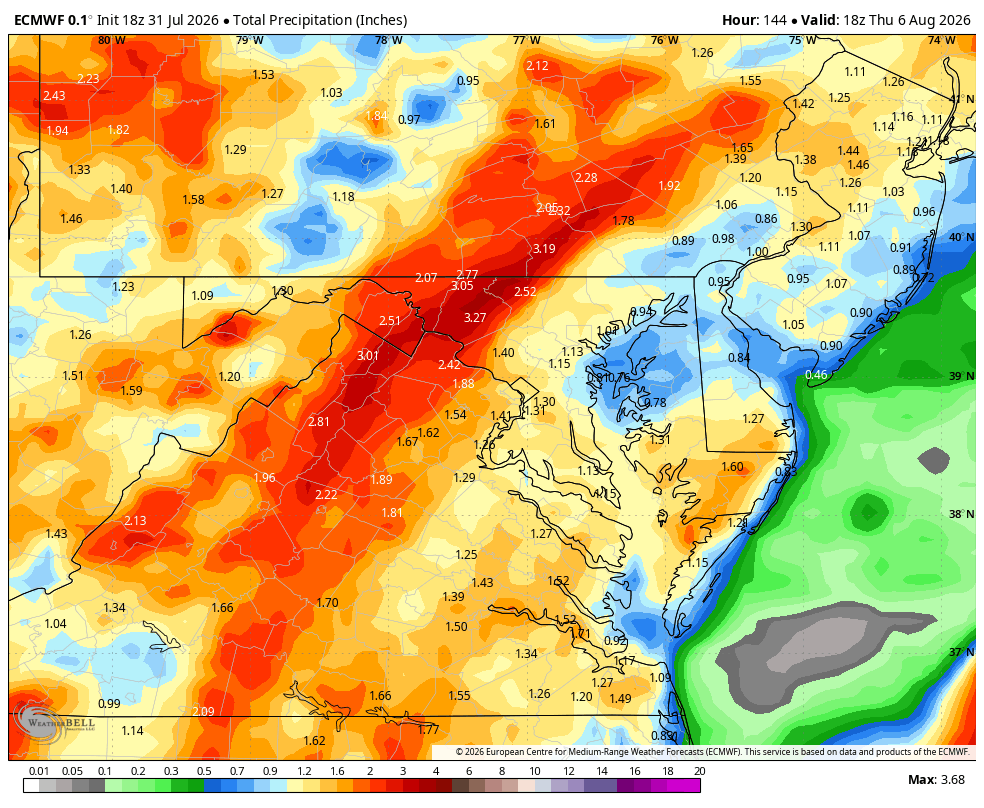
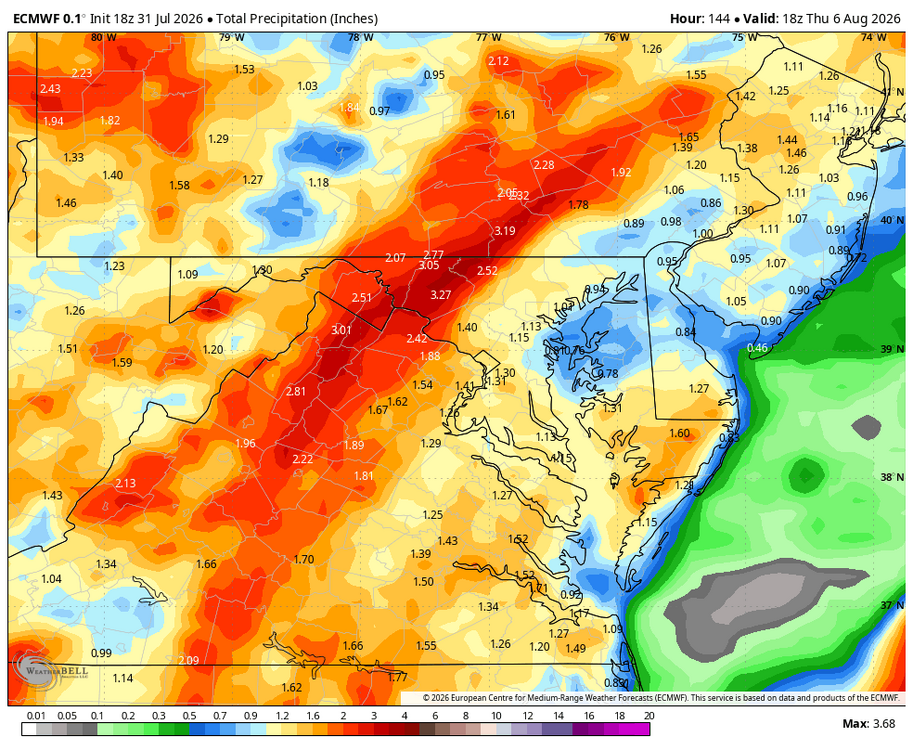
WB 18Z EURO is wet....and a lot of this falls through Day 3: not fantasy range.
-
 humidity is great when you want to mow your lawn, get drenched in sweat, and then covered in grass clippings ejected from the mower
 - Yesterday
-
Red maps in summer, Blue maps in winter = we’re all going to die! Yup, you guessed it….
-
buy Viagra online [url=https://medmennews.com/#]Med Men News[/url] Buy generic 100mg Viagra online
-
2026-2027 Super El Nino
40/70 Benchmark replied to Stormchaserchuck1's topic in Weather Forecasting and Discussion
No one thought it was right with a straight Modoki in the seasonal mean. -
2026-2027 Super El Nino
EasternLI replied to Stormchaserchuck1's topic in Weather Forecasting and Discussion
Let's do a comparison as things stand currently wrt SST's. Here's this year followed by the other strong/super el nino's going back to 82-83. Below is this year currently, followed by the others in reverse chronological order. Obviously, the globe is getting warmer over time. Naturally, sst's would follow suit. Is anyone disputing that fact anymore? I don't really see anyone doing that but not the point of this post. One can clearly see things warming over time. I've been floating around on these boards for a very long time now. There used to be discussions from very wise mets in the enso threads of yore on how actual sst's should be viewed and pondered. Not only the anomalies. So I'm posting the actual sst's as comparison. Looking at it this way, 97-98 and 87-88 stick out to me a little more so than the others. Again, not because of the actual readings compared to each other. Rather, the positioning of the warm pool biased east. -
You can easily tell who gets their news from truth social. Sad! Hottest, dewiest, life threatening weather ever! Yet, it’s actually called Summer.
-
over the counter sildenafil: MedMenNews - Cheapest Sildenafil online
-
Buy Viagra online cheap and viagra without prescription buy Viagra over the counter https://clients1.google.co.vi/url?q=http://medmennews.xyz Cheap Viagra 100mg or https://cannapedia.site/profile/rhwsnkltsf/ sildenafil 50 mg price [url=http://www.1491.com.tw/phpinfo.php?a[]=]cheap viagra[/url] Cheap Viagra 100mg or [url=http://www.sportchap.ru/user/cdcftvihfk/]viagra without prescription[/url] Buy generic 100mg Viagra online
-

Occasional Thoughts on Climate Change
donsutherland1 replied to donsutherland1's topic in Climate Change
The extreme heat was more the focus of climate change in my post, which merely noted that France was "wildfire-swept." At least for now, my understanding is that the connection between climate change and extreme heatwaves is stronger than the more complex linkage between climate change and wildfires. Nevertheless, there is a fairly prominent link. Since my initial post, World Weather Attribution (WWA) has published a rapid attribution report. Consistent with the expectations from a growing body of scientific literature, including one Nature piece talking about the future that I posted, climate change contributed. Excerpts: In Spain, January 2026 was the wettest January of the last quarter of a century (AEMET, 2026). In particular, in the area affected by the Ávila–Madrid–Toledo fire, rainfall was 175% higher than usual, which allowed a great accumulation of plant biomass. The summer of 2026 began with record-breaking temperatures and a severe drought, both conditions exacerbated by human-caused climate change (WWA, 2026a; WWA, 2026b). This sequence resulted in high fuel loads that then dried to become highly flammable, increasing the intensity of the fires... In 2025, WWA conducted two rapid attribution studies on fires in Spain and Portugal (WWA, 2025a) and Turkiye, Cyprus and Greece (WWA, 2025b), alongside a retrospective analysis of the entire wildfire season in several European regions (Keeping et al., 2026b). Across all three studies, we found that human-caused climate change was a key driver of the fire weather conditions, primarily through its influence on exceptionally high temperatures, but also by exacerbating drought conditions... The weeks leading up to the fires were characterised by a succession of extreme heatwaves and low rainfall across much of Western Europe, despite it still being comparably early in the season. Recent studies have shown human-caused climate change increased the likelihood of these hot and dry antecedent conditions, which were essential for the development of the extreme fire weather that enabled the fires... In both study regions observations show strong trends of increasing likelihood and severity with global warming. DSR7x values as extreme as those observed in central Spain in July 2026 are now at least 20 times more likely than in a pre-industrial climate. In the French regions the statistical model fits the data less closely and may underestimate the return period of the event, thus the result of an increase in likelihood by at least a factor two in southwest France is a conservative estimate... A recent attribution study has shown that climate change is increasing the likelihood of severe soil moisture drought through higher atmospheric evaporative demand, while the same sequence of above-average winter rainfall followed by exceptional spring drying was identified as a key driver of the 2025 Iberian wildfires. Finally, the WWA rapid attribution report cites and links to a fairly large number of papers on fire weather in Europe, many of which have relevance to the impact of climate change. -
July 2026 at DCA tied for the 16th warmest July in DC history with an average temperature of 81.7 degrees -- 0.7 above the 1991-2020 normal. January-July 2026 averaged 58.7, the 19th warmest first seven months in DC history. July 2026 precipitation at DCA totaled 3.58 inches, 0.74 below the 1991-2020 July normal of 4.32. For the first seven months of 2026, DCA precipitation totaled 17.29 inches, 7.37 below the 1991-2020 normal of 24.66 and the 13th dryest in DC history.
-
Watches and warnings of many types are issued far more often than 50+ years ago. Everyone in my family has turned off weather alerts on their phones due to the excessive number issued. Sadly, the alerts have become more noise than signal due to their quantity.
-
https://medmennews.com/# Viagra without a doctor prescription Canada buy Viagra online
-
I have been incrementally replacing bad deck boards for the last few years. I finally got tired of it(with all the other shit I have to do lol) and contracted a local 'handyman' 2 man company to finish replacing the boards. I should have thought of you! Anyway after the boards age a bit(pressure treated pine) I would like to put a transparent tinted stain on. What do you recommend? I will gladly save that job for you if you want to do it. The 'older' boards have grayed a bit and will need a wash. I won't be home on Sunday btw.