All Activity
- Past hour
-
Dews that low though? I thought when it’s near 100F we are just roasting with dew points in the upper 60s instead of the dreadful mid 70s lol
-
Our highest temps typically have lower dewpoints. Lots of humidity in the air make it harder to get very hot temps.
-
Assuming it’s wrong , but on Tuesday the EURO shows temps in the mid to upper 90s but with dewpoints barely in the 50s. Don’t see that around here much..
-
Finally hauled out the sprinklers rather than just hand watering the gardens to try to battle this severe drought. Hoping to soften up the concrete hard ground a little so I can do some weeding Overcast and 71. We'd be dying in winter seeing all the precip to the south with a high to our north blocking it!
-
 That would be nice lol
 -
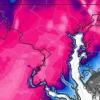
Interesting temperature pattern yesterday in the northeast. Map below shows yesterday's high temperature percentile. Much of the interior decidedly above the median high temperature - generally 70 to 85 percentile. Buffalo was only a few degrees shy of a record, topping out at 89F as an odd easterly flow brought some downsloping sending the warmest temperatures to the lakeshore (typically cooler locations). The coastal Plain was pretty close to the median - generally from about the 33rd to 67th percentile, except for Boston, which didn't make it out of the low 70s. The ASOS at Logan is very close to the water. Big divergence from BOS to Blue Hill Observatory (Milton, Mass.) just to the south. Cooler high temperatures in West Virginia from clouds and showers.
-
maybe some smoke relief from the east later
-
it was a smoke front
-
Been in the 80s inland though. Not really that cool over interior. Bootleg erly flow.
-
Happy day of birth @canderson
-
different brand
-
I will be in Florida from August 17th to the 24th!
-
I believe there have been a few days where the smoke has kept high temps down by a degree or two. Looking at the longer range the Boreal forrests of Canda will experience some rainfall, the first in a very long time. You can see it here from the WPC, of note is the reversal of the wetness here after months and months of rainfall.
.gif.733056730339a36bcb2989118dc569de.gif)
-
 Rain offshore, and mainly into MD/DE - may get some showers or drizzle and light rain in scattered locations otherwise a dry front for us.
 -
This week was BN on all EPS ensemble next week is a torch.
- Today
-
We noticed it last night when eating out on the deck. Was wondering where it was coming from.
-
Records: Highs: EWR: 97 (2001) NYC: 97 (1955) LGA: 95 (2018) JFK: 91 (2010) Lows: EWR: 57 (1934) NYC: 56 (1869) LGA: 57 (1994) JFK: 57 (1994) Historical: 1881: Smoke from Michigan forest fires created a yellow pall over the Northeast. Candles were necessary for light at noontime. (Ref. AccWeather Weather History) 1890 - Thunderstorms left four inches of hail covering the ground in Adair County and Union County in Iowa. The hail drifted into six foot mounds, and in some places remained on the ground for twenty- six days. (The Weather Channel) 1905: Princeton, IN received 10.50 inches of rain, which established a 24-hour maximum precipitation record for the Hoosier State. (Ref. Wilson Wx. History) 1918 - Unusually hot weather began to overspread the Atlantic Coast States, from the Carolinas to southern New England. The temp- erature soared to an all-time record high of 106 degrees at Washington D.C., and Cumberland and Keedysville hit 109 degrees to establish a state record for Maryland. Temperatures were above normal east of the Rockies that month, with readings much above normal in the Lower Missouri Valley. Omaha NE reached 110 degrees. (David Ludlum) On this date the highest ever maximum temperature of 107 °F was recorded in Richmond, VA. (Ref. Richmond Weather Records) 1947: The city, Sault Ste. Marie, MI hit 98°, equaling their all-time highest temperature. (Ref. AccWeather Weather History) 1959 - A bucket survey showed that thunderstorms dropped 16.70 inches of rain on parts of Decatur County IA. The total was accepted as Iowa's 24 hour rainfall record. (The Weather Channel) 1959: Hurricane Dot crossed Kauai in the Hawaiian Islands producing sustained winds of 105 mph with gusts to 125 mph. Over 6 inches of rain fell with over 9 inches on the big island of Hawaii. The sugar cane crop on Kauai sustained $2.7 million in damages. 1961: A severe thunderstorm brought 70 to 100 mph winds to Lake Texoma, OK. The winds caused extensive damage to piers and either damaged or sank more than 100 boats. One person drowned when their boat capsized during the storm. (Ref. Wilson Wx. History) 1977: Severe thunderstorms produced nearly 20 tornadoes in Sangamon and Christian Counties in central Illinois. Many of these only affected open fields. However, one tornado did cause extensive damage near and east of Chatham. One tornado just south of Lake Springfield was unusual in that it had a clockwise rotation, in contrast to the usual counter-clockwise rotation found in tornadoes. The thunderstorms that produced these tornadoes caused a large swath of destruction from strong winds extending from southwestern Morgan County east to far southwestern Macon County. (Ref. Wilson Wx. History) 1979: 100° at Salt Lake City, UT tied the record for the date. It was the 5th day of temperatures 100° or hotter. (Ref. AccWeather Weather History) 1986 - Evening thunderstorms produced wind gusts to 100 mph at Winner SD damaging two hundred homes. (The National Weather Summary) (Storm Data) 1987 - Afternoon thunderstorms deluged Milwaukee, WI, with 6.84 inches of rain, including more than five inches in two hours, breaking all previous rainfall records for the city. Floodwaters were four feet deep at the Milwaukee County Stadium, and floodwaters filled the basement of the main terminal at the airport. Flooding caused 5.9 million dollars damage, and claimed the life of one person. Death Valley, CA, reported a morning low of 97 degrees. A midday thunderstorm deluged Birmingham AL with nearly six inches of rain in one hour. (The National Weather Summary) (Storm Data) 1988 - Severe thunderstorms produced large hail and damaging winds in Pennsylvania and New York State. A cold front crossing the northwestern U.S. produced wind gusts to 66 mph at Livingston MT. (The National Weather Summary) (Storm Data) 1989 - Thunderstorms developing ahead of a cold front produced severe weather from northwestern Texas to the Southern Appalachians, and in the northeastern U.S. There were 136 reports of large hail or damaging winds during the day and evening. Thunderstorms in the Southern Plains Region produced tennis ball size hail northwest of Buffalo OK, and wind gusts to 100 mph at Pampa TX. (Storm Data) (The National Weather Summary) 1992: A firefighter was knocked unconscious in Sarasota County, Florida struck by lightning while fighting a fire that was caused by a lightning strike. (Ref. AccWeather Weather History) 1993: Virginia experienced its worst tornado outbreak ever as 18 tornadoes ripped through the state in 5 hours. The most devastating tornado caused severe damage in the historic part of Petersburg. The storm then moved on to Pocahontas Island and into Colonial Heights. There, the storm ripped apart a WalMart store, killing three people and injuring nearly 200. The F4 twister was the first known violent tornado in Virginia history. It killed a total of 4 people and injured 246 along its 12-mile path. Total damages were near $50 million. 2001: Tropical Storm Barry moved inland on the Gulf Coast near Fort Walton Beach, FL around midnight with top winds of 60 mph. The storm caused $30 million in damage. Heavy rains spread northwestward across Alabama with up to three inches reported in the Birmingham area. No precipitation fell at Billings, MT on this date, the first of an August record 22 consecutive days without even a trace of rain. Only 0.01 inches fell during the month, their record driest August. (Ref. Wilson Wx. History) 2003: Dallas-Fort Worth, Texas: Temperatures soar to 109°F at Dallas-Fort Worth International Airport, surpassing the old record set in 1952. (Ref. WxDoctor) 2005: A camper was slightly injured when a lightning struck a nearby tree at a campground at Lake Robertson, near Collierstown in Rockbridge County, VA. (Ref. Lightning - Virginia Weather History)
-
Dexter has about another day or so as a tropical system. It is currently experiencing strong vertical wind shear, which is only expected to increase during the next 24 to 48 h. However, models continue to predict that the interaction with the trough to north in the next day or so should strengthen Dexter while it undergoes extratropical transition. It should be noted that during the extratropical phase of the forecast, there is quite a bit of spread in the intensity guidance. Several models during the 36 to 60 h time frame show the cyclone reaching hurricane-force. The NHC intensity forecast has been raised to a peak of 60 kt at 48 h, very near the corrected consensus aid, HCCA. **There remains the possibility that upward adjustments in the intensity forecast could be need in future advisories.** FORECAST POSITIONS AND MAX WINDS INIT 06/0900Z 39.4N 59.9W 40 KT 45 MPH 12H 06/1800Z 39.8N 57.7W 45 KT 50 MPH 24H 07/0600Z 40.6N 54.1W 50 KT 60 MPH 36H 07/1800Z 41.9N 50.1W 55 KT 65 MPH...POST-TROP/EXTRATROP 48H 08/0600Z 43.2N 46.3W 60 KT 70 MPH...POST-TROP/EXTRATROP 60H 08/1800Z 44.5N 42.3W 50 KT 60 MPH...POST-TROP/EXTRATROP 72H 09/0600Z 45.2N 38.0W 45 KT 50 MPH...POST-TROP/EXTRATROP 96H 10/0600Z 46.0N 30.1W 35 KT 40 MPH...POST-TROP/EXTRATROP 120H 11/0600Z...DISSIPATED $$ Forecaster Bucci
-
74 /68 mostly cloudy wtih some hazy smoke mixed in. Clouds and mainly - mostly dry outside a stray shower or drizzle/light rain the next 24 hours. Clearing tomorrow and setting the stage for a wonderful 3 day period (too bad it wasnt a 3 days holiday weekend) as it looks gorgeous for any beach , outdoor, bbq, pool etc. Sunny, warm - 80s Fri - Sun/ upper 80s by Sunday. Flow comes around and expanding heat by Monday which should get the areas back into a widespread 90s for and through Thu or Friday, perhaps some strong heat Tue/Wed (95+). Beyond there outside a day or two near / slightly below normal its an overall warm- hot / humid and turning wetter. With tropics systems activity looking to stay persistent. 8/6 - 8/7: Clouds - smoky front 8/8 - 8/10 : Great stretch - near normal - sunny - dry - Amazing summer time weather 8/11 - Beyond : Warm - Hot / Humid turning wetter overall - Heat 8/11 - 8/14 (strong heat possible 95+ Tue 8/12 /Wed 8/13)
-
you get the feeling that idiosyncrasies are teaming up to dim summer though. Smoke this, correcting toward over top highs that ( which import too much E wind ). This week was not going to be BN in the guidance and only turned out that way because of mitigating factors very poorly or not represented a week ago. Meanwhile, lower Asia over to Japan is apparently breaking all kinds of staggering high heat records... We are exiting the solar max in under a week. The first couple of weeks of the solar transition season that begins then will still feature hot enough sun - so it's not an all or nothing environmental aspect, it's a 'turning down the dimmer switch' thing. But, smoke days, and/or poorly models purely chaotically emerged confluence causing over-the-top heavy with +PP, we can't really do that while losing solar potency and expect things to toast up. So, I wouldn't call it "breaking summer's back" ...but it's not a hot implication. It's not helping ( me personally ) that both the spatial layout and telecon, both, are pretty nominal for heat at the moment. The operational runs also deflated some of the geopotential medium along 40 N E of Chicago, so ... they may still be showing some heat in their 2-m temperature distributions and so forth, but -deltas in the overarching metric, while these reasons to not get warm keep happening ... that's not really sending much confidence in heat, either. Stop with the idiosyncratic mitigators would help... That all said, I don't see a significant cold front, nor any compelling reason when studying the recency of the mass fields and the numerics therefrom, that argue for that, either. Mostly, it all looks rather torpid and frankly kind of a boring mid month. Things can change. Again, I wouldn't 86 the outlook for remainder of summer, either. I'm not buying any of the TCs up the EC by the GFS, which does this every year as seemingly perfunctory seasonal error by that model. There's are certain and significant correlated climatologically based structures all but required in the larger flow scheme, that do not include what the GFS is attempting to do.
-
 Can we get just ONE non dud winter? Like a february 2021 repeat?
 -
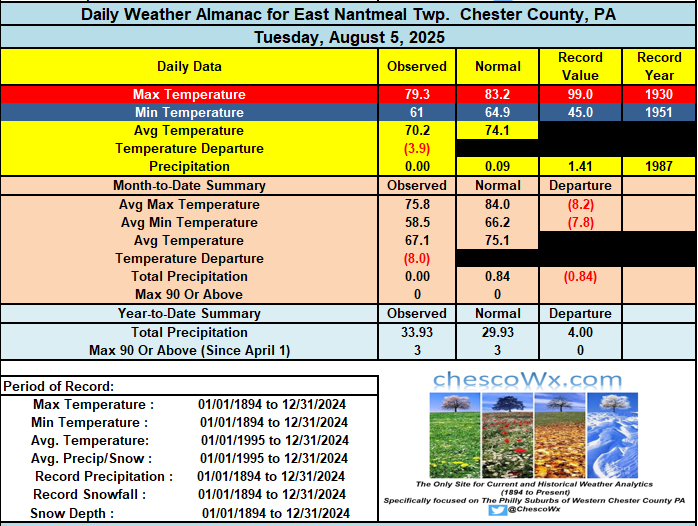
We have had 5 straight well below normal days in fact this is the 2nd chilliest start to August in my 22 years of records here in East Nantmeal behind only the start of August 2021. We should be closer to normal temperatures today before we fall back a few degrees below normal for Thursday through Saturday before we should start a nice warmup into the middle of next week. Cloudy with maybe some sprinkles today - otherwise sunny and dry for most of the next week.
-

E PA/NJ/DE Summer 2025 Obs/Discussion
ChescoWx replied to Hurricane Agnes's topic in Philadelphia Region
We have had 5 straight well below normal days in fact this is the 2nd chilliest start to August in my 22 years of records here in East Nantmeal behind only the start of August 2021. We should be closer to normal temperatures today before we fall back a few degrees below normal for Thursday through Saturday before we should start a nice warmup into the middle of next week. Cloudy with maybe some sprinkles today - otherwise sunny and dry for most of the next week.
-
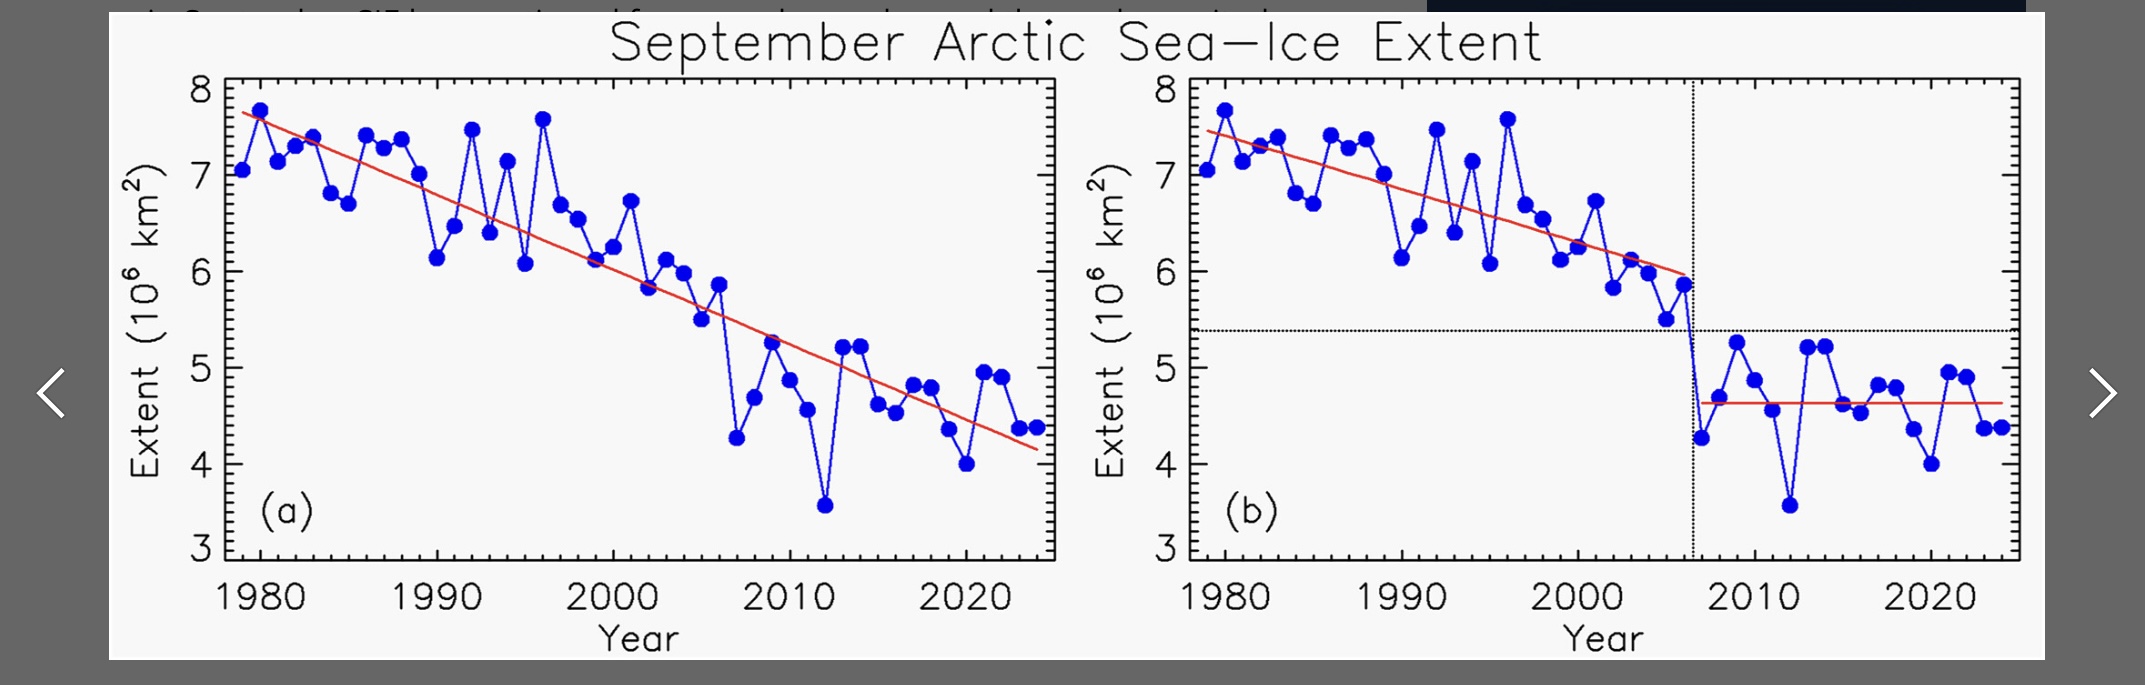
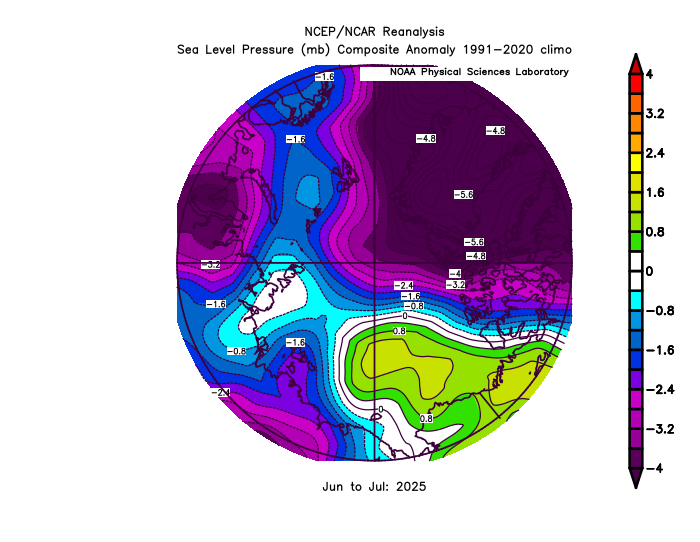
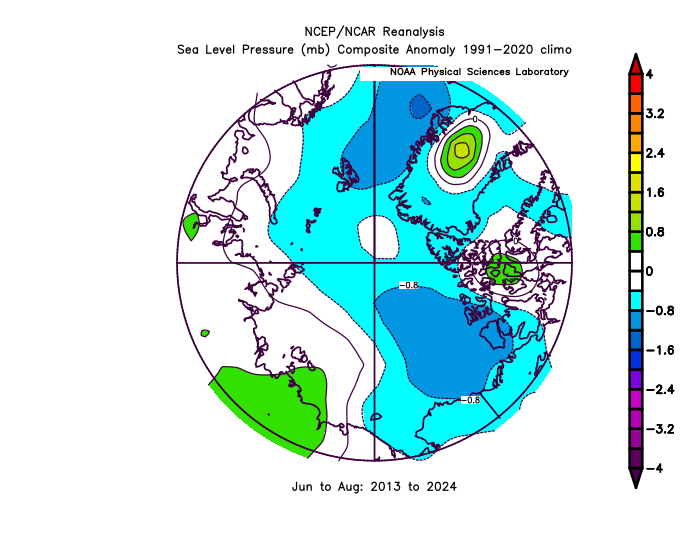
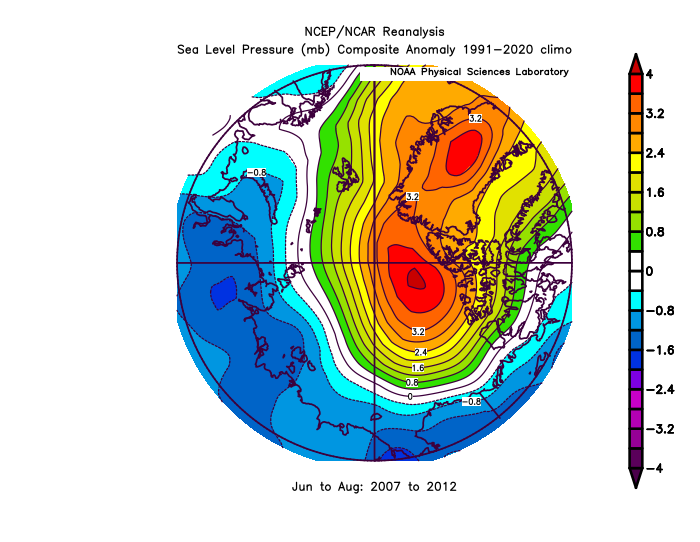
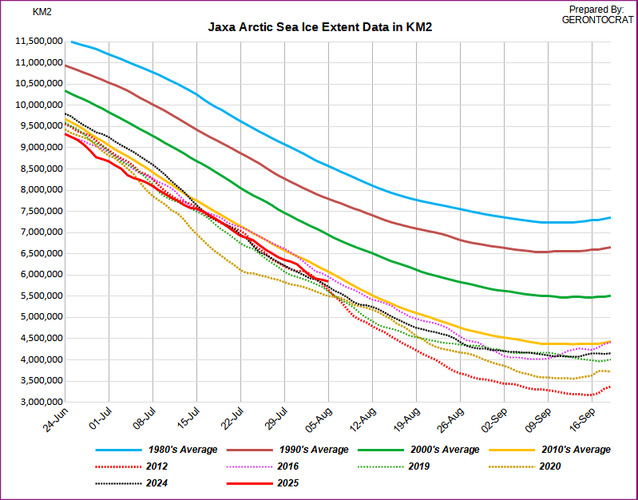
Right on cue the pace of Arctic sea ice loss has slowed behind the 2012 record drop experienced in early August 2012. That was at the end of an historic Arctic Dipole pattern from 2007-2012 leading to all the records over that 6 year period. This season so far has continued the much weaker Arctic Dipole pattern since 2013. So this changed summer Arctic circulation pattern since then has resulted in no sea ice trend since those steep declines. But the Arctic has seen increasing warmth over this period. So even with these more favorable conditions for Arctic sea ice retention, the sea ice thickness and extent has not returned to the pre 2007 state. Most Septembers finish between 4-5 million sq km over this period well below the major Arctic shift in 2007. I mentioned the melt pond data from early in the season which is one of the early indicators to look at. But this was the first year it hasn’t been published online. It probably would have shown something near the middle of the pack based on the lack of strong warmth this May. This was the opposite of the strong preconditioning in 2012 and 2020. 2012 was a perfect storm of a strong Arctic Dipole pattern following significant May preconditioning and the record Arctic cyclone in early August. These three features have not occurred in tandem since then. Special thanks to Gerontocrat from preparing the current extent which is in 6th place behind 2012. https://agupubs.onlinelibrary.wiley.com/doi/full/10.1029/2024GL114546

-
Summer 2025 The cloudy summer.