All Activity
- Past hour
-
E PA/NJ/DE Spring 2025 Obs/Discussion
Albedoman replied to PhiEaglesfan712's topic in Philadelphia Region
absolutely agree. Forecast models have continually failed with wind speed and direction since last year. The LR and even the SR computer models need to be calibrated to not just look at temps and precip atmospheric profiles and soundings but should consider the most critical feature- the role of surface topography and overall natural physical geography of our area. For example when a SE to S direction fetch of wind is prevalent for hours or days, the models should compare the geography of the area and bias should be added for chances of higher precip values(especially in training t-storms or froneneis for snowfall predictions ) in certain regions of the entire forecast area for MT Holly. The same goes with a direct east wind in which literally prevents t storms from from the west to cross over the Blue Mts. Physical Geography features plays a vital part in local forecasting for our area and atmospheric modeling needs to be vastly improved to include and or be more accurately biased when using pin point forecasting, especially with wind direction speed for upsloping and downsloping of the mountain ranges and deeper valleys. Simplistic terms- need a better algorithm for physical geography features rather than just using transportation networks to identify different forecasts for different aras. Thats why Macungie to Huffs Church area are constantly having inaccurate forecasting for either high or low temps and or precip values and types because the pin-point forecast do not include the topography for S Mtn range as a dividing line for precip or for different forecasts. Everything is now based on I-78, I-80 and PA turnpike transportation areas when formulating and discussing the local forecasts. IMHO, MT Holly /NOAA needs to reconsider relying more on physical geography/topography when discussing LV forecasts and not just referring to major transportation networks. FWIW, transportation networks literally bore through local mountain ranges by tunnels or by steep climbing lanes and built to go in different directions. I -78 is a perfect example of how dividing forecast areas is incorrect as it goes from SW to NE and then goes directly E to West. It literally bisects the S Mt Range in the heart of the LV. The NE turnpike is a N to S directional road which is usually only brought into the picture on types of winter precip or from storms along the coast--- yet both of these highways go through the heart of the LV.. Hopefully you see the problem of using transportation networks as delimiting line for producing local forecasts in the LV. Best examples of my reasoning- how many times have you personally gone through the Lehigh Tunnel and on one side it is snowing and the other side it is clear? How many times have you gone on RT 29/Rt 100 through Shimerville or Huffs Church and it has 2 in of snow on the ground but you get to the Macungie and Emmaus and or East Greenville and it is raining? Physical Geography plays a vital part in weather forecasting and personally believe not enough attention has been given to this fact based on our vast local regional forecasting area that MT Holly must cover. This is not the fault of the MT Holly staff at all but federal govt decisions made back in the early 90's to do away with the Allentown weather forecast office at LVIA. This was a huge mistake and I was against this change but it was a lost cause. The politicians simply did not care or understand the role of physical geography has on the the LV . That is why I am so outspoken at times about the LV. The "fall Line"" basically stops at S MT range and any thing north of that that is also in a valley which has very unique weather forecasting difficulties such as extreme diurnal and nocturnal temp ranges from the deeper valleys especially with upsloping and downsloping conditions in major storm events including wind storms, fog, freezing rain and even snow accumulations. LV is unique. -
Pretty interesting distribution. I know I’ve been sucker holed the entire event but I’m thinking I should get a stratus. I’m running lower than all surrounding stations. It is most pronounced during heavier events.
-
2025 Spring/Summer Mountain Thread
Met1985 replied to Maggie Valley Steve's topic in Southeastern States
Another cold morning of 39 degrees. -

2024-2025 La Nina
PhiEaglesfan712 replied to George001's topic in Weather Forecasting and Discussion
The one for PHL is much harder to break. If I remember correctly, the record HI was set three days after my 7th birthday, on 7/15/1995. The high that day was 103, and I believe the HI was 129 and the dewpoint was 82 (which was even higher than the low of 81 that day). That day was just the perfect storm of the heat and humidity coming together. I can't see it ever being broken. We'll either need a very humid 101/102 degree day or a day when the thermometer reaches 108, which is 2 higher than the all-time PHL record (like it did in Newark in 2011). -

Central PA Spring 2025
Itstrainingtime replied to canderson's topic in Upstate New York/Pennsylvania
Up and down - I have some good days and then some relapses. More testing on Thursday and then I'm seeing a heart specialist next week. My heart goes through spells where it is on overdrive...early this morning I was awakened out of a deep sleep with rapid heartbeat. It's better now. All of this is so frustrating. -

Mountain West Discussion
mayjawintastawm replied to mayjawintastawm's topic in Central/Western States
Here we go again. What can you do when all the models say you'll get 1"+, 12 hours before the event. Gonna be a long fire season. Forecast for Sunday: Rain late. Measured precip: zero. Forecast for Monday: Rain late. Measured precip: zero. Today the closest precip is about 70 miles south. -
Central PA Spring 2025
Itstrainingtime replied to canderson's topic in Upstate New York/Pennsylvania
No rain in Maytown in 49 hours - this map is overdone for my area but I guess gives a decent idea of what's happening: -
Incredible. I got .02” overnight.
-
Event is 1.66” Day currently at .34” Month is currently 2.84" Had to run my oldest to a film set this morning and there was some low lying fog/mist in the neighborhood.
-
1.3" since Saturday.
-
Downpour now. Won't last long but it's all adding up
-
Ya for you guys out East for sure.. Still a solid 2-5" in these parts since Midnight Monday..
-
Darn. I was hoping you had a model that didn’t show a coastal storm ruining Saturday.
-
Oh sorry haha. I meant last weekend.
-
Don’t really see big heat either. Bit with that cutoff to our south next week.
-
This coming weekend?!?
-
Radar kinda looks like another long slug is gonna move S to N through the city/western LI and up east of the River.
-
I’ll take the dry weather we had though. What a weekend starting Friday.
-
I meant post Sunday. Way too wet.
-
I let the pros grow veggies (read I buy them from organic grocery stores), but I do grow flowers and mine look like pancakes from this excessive rainfall. The first thing I would do with weather modification is put an end to cutoff lows. Showers and Tstorms that come at night after a sunny hot day are fine, not days and days of this Ireland weather crap. I'd like to know why cutoff lows are on the increase and especially in May, when they never used to happen this late in the season back in the 80s and 90s.
-
we're going to have so much mold and fungus from this
-
Another 0.56" of rain yesterday brings me up to 1.32" for the event and 1.33" for the month of May so far.
-
Lots of flooding potential into the South
-
Euro still not updating into EWALL but similar with cutoff underneath the ridging potential next week.
-
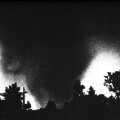
Records: Highs: EWR: 93 (1949) NYC: 92 (1986) LGA: 93 (1949) JFK: 88 (1986) Lows: EWR: 40 (1967) NYC: 32 (1891) LGA: 41 (1967) JFK: 37 (1992) Historical: 1876: A tornado, estimated at F3 intensity, tracked four miles across Chicago, Illinois. The damaged buildings included a candy factory, a hospital, a freight depot, and a church. The tornado moved out over Lake Michigan and was observed to have multiple vortices by a reporter. Further south in Illinois, a tornado blew a moving passenger train off the tracks near Neoga, injuring all 19 people aboard. 1911 : Record Minimum temperature for Washington, DC for the date is 37 °F. 1917: Amarillo, TX had its latest snowfall on record with 9.1 inches falling. 1933 - Charleston, SC, was deluged with 10.57 inches of rain, an all- time 24 hour record for that location. (The Weather Channel) 1937: The German passenger airship LZ 129 Hindenburg caught fire and was destroyed during its attempt to dock with its mooring mast at Naval Air Station Lakehurst in Manchester Township, New Jersey, United States. Of the 97 people on board (36 passengers and 61 crewmen), there were 35 fatalities (13 passengers and 22 crewmen). One worker on the ground was also killed, making a total of 36 deaths. The Hindenburg was delayed two hours from docking due to thunderstorms in the area. 1975 - A massive tornado hit Omaha, NE, killing three persons, injuring 133 others, and causing 150 million dollars damage. The tornado struck during the late afternoon moving northeastward through the industrial and residential areas of west central Omaha, and lifting over the northern section of the city. The twister, which cut a swath ten miles long and as much as a quarter of a mile wide, was the mostly costly in U.S. history up til that time. (David Ludlum) 1987 - Eighteen cities in California and Oregon reported record high temperatures for the date. Highs of 91 degrees at Portland OR, 101 degrees at Medford OR, and 104 degrees at Sacramento CA, were the warmest of record for so early in the season. (The National Weather Summary) 1988 - A major storm brought high winds to the western half of the country. A wind gust of 74 mph at Pueblo CO broke their May record established just four days earlier, and winds in the Arapahoe Ski Basin area of Colorado reached 85 mph. In North Dakota, the high winds reduced visibilities to near zero in blowing dust closing many roads. (The National Weather Summary) (Storm Data) 1989 - Sixteen cities in the north central U.S. reported record low temperatures for the date. Morning lows of 17 at Bismarck ND and 26 at Minneapolis MN were the coldest of record for so late in the season. A reading of 43 degrees at the start of the Kentucky Derby was the coldest in 115 years of records. Light snow was reported in the Upper Midwest, with an inch reported at Chicago IL. (The National Weather Summary) 1990 - Snow and high winds prevailed behind a Pacific cold front crossing the northwestern U.S. Wind gusts above 50 mph were reported in southeastern Idaho, and heavy snow blanketed the Cascade Mountains of Washington State, with twelve inches reported at Stampede Pass. (The National Weather Summary)