All Activity
- Past hour
-
JFK had two such days and LaGuardia had five. There have been 21 years where Central Park had none in August. The most recent such year was 2023.
-
 no script pharmacy or legal online pharmacies in the us reputable overseas online pharmacies https://cse.google.dm/url?sa=t&url=https://quickph.com online pharmacy no rxor https://mantiseye.com/community/szgahxzdxn pharmacy no prescription required [url=https://1d4.us/quickph.com]best online pharmacy[/url] no prescription needed pharmacyor [url=http://www.1gmoli.com/home.php?mod=space&uid=1032753]secure medical online pharmacy[/url] legal online pharmacies in the us
 -
Yeah, the increasing summer heatwaves across Europe and other parts of the Northern Hemisphere are being driven more by the CGT pattern. This pattern is operating independently of ENSO. So this is how we got such a contradictory pattern in Europe and other areas compared to past developing super El Niños. Building on this, we propose that the circumglobal wave (CGW) pattern, also known as the circumglobal teleconnection pattern (35, 36), drives the extended duration of NWP MHWs. This prominent summer circulation feature spans the Northern Hemisphere mid-latitude band (36). While prior studies have linked the CGW to terrestrial extreme weather—such as heatwaves in Europe, Asia, and North America (37–41)—its role in NWP MHW dynamics remains underexplored. Given that CGW activity peaks during boreal summer, aligning with the documented maximum in NWP MHW intensity and frequency (25, 42–46), it provides a compelling mechanism for initiating and sustaining these events beyond local forcing alone. https://www.science.org/doi/10.1126/sciadv.adz4647 Marine heatwaves in the Northwestern Pacific (NWP) have become increasingly frequent and persistent, yet the mechanisms enabling their multiseasonal duration remain poorly understood. Through observational analyses and climate model experiments, we demonstrate that NWP marine heatwaves are primarily driven by a quasistationary wavenumber 5 circumglobal wave (CGW) pattern that operates independently of El Niño–Southern Oscillation. The CGW modulates surface heat fluxes during summer, triggering a self-reinforcing feedback loop where NWP warming intensifies the CGW pattern, amplifying and prolonging heatwaves across extended warm seasons. Additionally, CGW-driven summer warming in the northern North Atlantic persists into winter through oceanic thermal inertia, exciting a great-circle wave pattern that propagates back to the NWP, sustaining heatwaves through cold seasons. This interplay between atmospheric waves and trans-basin interactions enables multiyear marine heatwave events. Analysis of observational data and climate model simulations reveals a strengthening CGW influence in recent decades, indicating more frequent and prolonged NWP marine heatwaves under ongoing global warming.
-
Happy Fall yall!
-

Central PA Summer 2026 Discussion/Obs Thread
mahantango#1 replied to Voyager's topic in Upstate New York/Pennsylvania
Hazardous Weather Outlook National Weather Service State College PA 500 AM EDT Tue Sep 1 2026 PAZ004>006-010>012-017>019-024>028-033>037-041-042-045-046-049>053- 056>059-063>066-020900- Warren-McKean-Potter-Elk-Cameron-Northern Clinton-Clearfield- Northern Centre-Southern Centre-Cambria-Blair-Huntingdon-Mifflin- Juniata-Somerset-Bedford-Fulton-Franklin-Tioga-Northern Lycoming- Sullivan-Southern Clinton-Southern Lycoming-Union-Snyder-Montour- Northumberland-Columbia-Perry-Dauphin-Schuylkill-Lebanon-Cumberland- Adams-York-Lancaster- 500 AM EDT Tue Sep 1 2026 This Hazardous Weather Outlook is for central Pennsylvania. .DAY ONE...Today and tonight. Scattered strong to severe thunderstorms with strong winds and heavy rainfall are possible late today into tonight. .DAYS TWO THROUGH SEVEN...Wednesday through Monday. Multiple rounds of strong to severe thunderstorms with strong winds and heavy rainfall are possible Wednesday and Thursday. .SPOTTER INFORMATION STATEMENT... Spotters are encouraged to report significant hazardous weather. -

Septorcher 2026 Discussion - Endless Summer
kdxken replied to Damage In Tolland's topic in New England
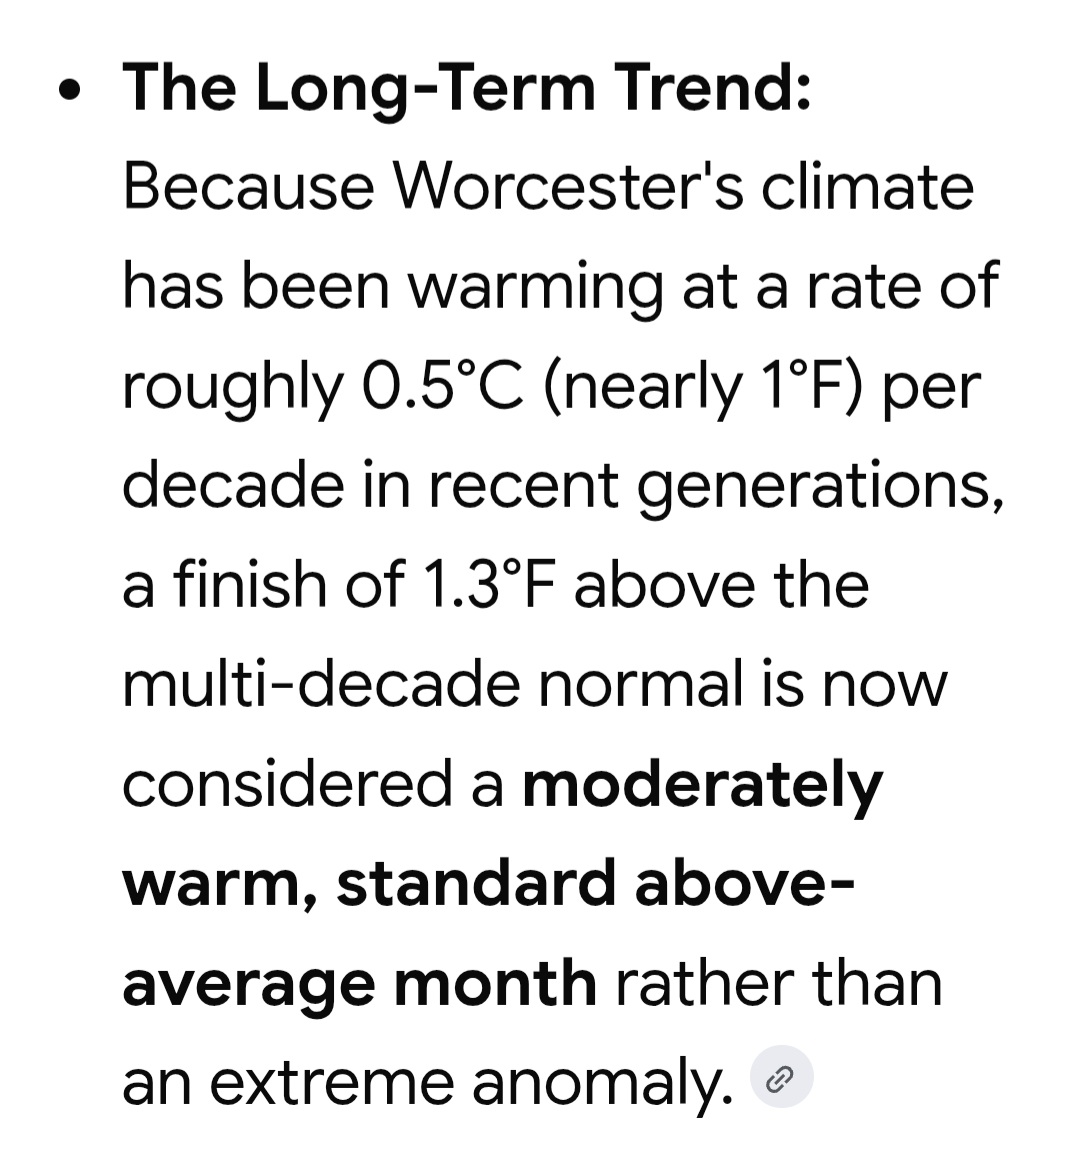
Nice write up. Worcester finished at 1.4 when all said and done. Big meh for the month.
-
About 0.9” this morning.
-
Septorcher 2026 Discussion - Endless Summer
Lava Rock replied to Damage In Tolland's topic in New England
Showers today/ tomorrow all but dried up. No surprise. Thurs probably amount to Sent from my SM-S921U using Tapatalk -
Septorcher 2026 Discussion - Endless Summer
Lava Rock replied to Damage In Tolland's topic in New England
36f at friend's camp in Eustis Sent from my SM-S921U using Tapatalk -
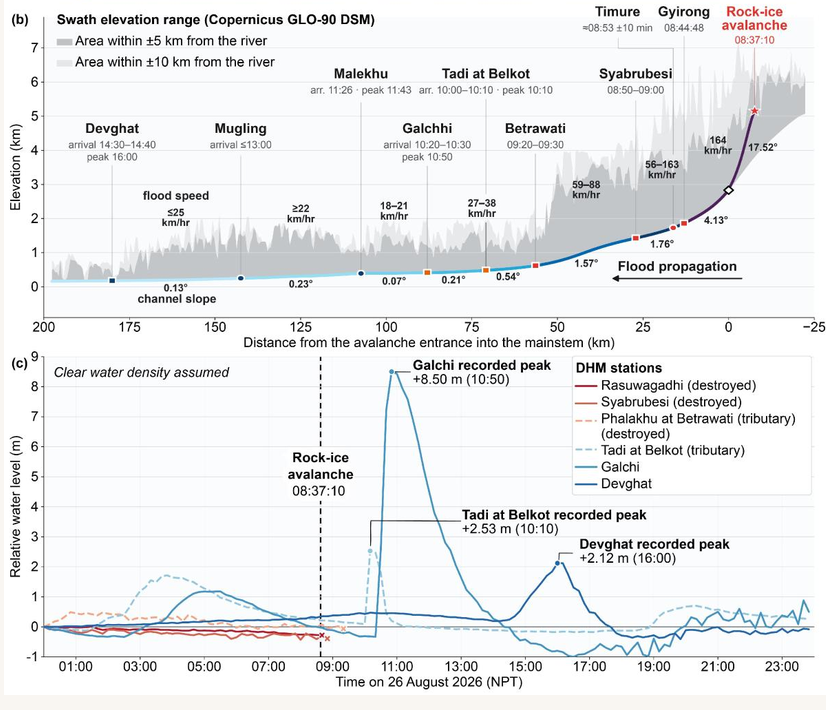
Storymap on the Nepal floods by the Center for Land for Land Surface Hazards with detailed information from flood gauges, seismic, paleo, etc. The story book is updated as new information becomes available. A couple of quotes from the storymap below. The first quote indicates the flood water came mainly from the slide materials i.e, this material was warm/partially melted. The second quote shows how unusual this event was in area impacted. "However, more recent seismic analysis of the event as well as detailed reconstruction of flood downstream arrival timing (see above) suggests that damming and release of lake water did not likely contribute significantly to this event because the timing of the initial failure (i.e. the ice-rock avalanche) from seismic records is only seven minutes before the arrival of the flood waters in the nearby community of Gyirong, which is not enough time to have constructed a significant lake in the highland region. Instead, melting of ice and frozen sediment/rock in the initial debris flow and avalanche runout has been attributed to the initiation of the flood." In a 2020 study , Huber and others determined boulder-emplacement timing and estimated paleo-flood magnitudes based on boulder size. They show that most boulders in the Trishuli and Sunkoshi were last mobilized and came to rest about 5000 years ago in flood events that far exceed typical monsoon discharges by one to two orders of magnitude. Images and videos from this Trishuli flood suggest this was a larger event, moving larger boulders than the flood event that impacted the valley ~5000 years ago https://storymaps.arcgis.com/stories/f2b2425eac544929a7d18f4c90b41d66
-
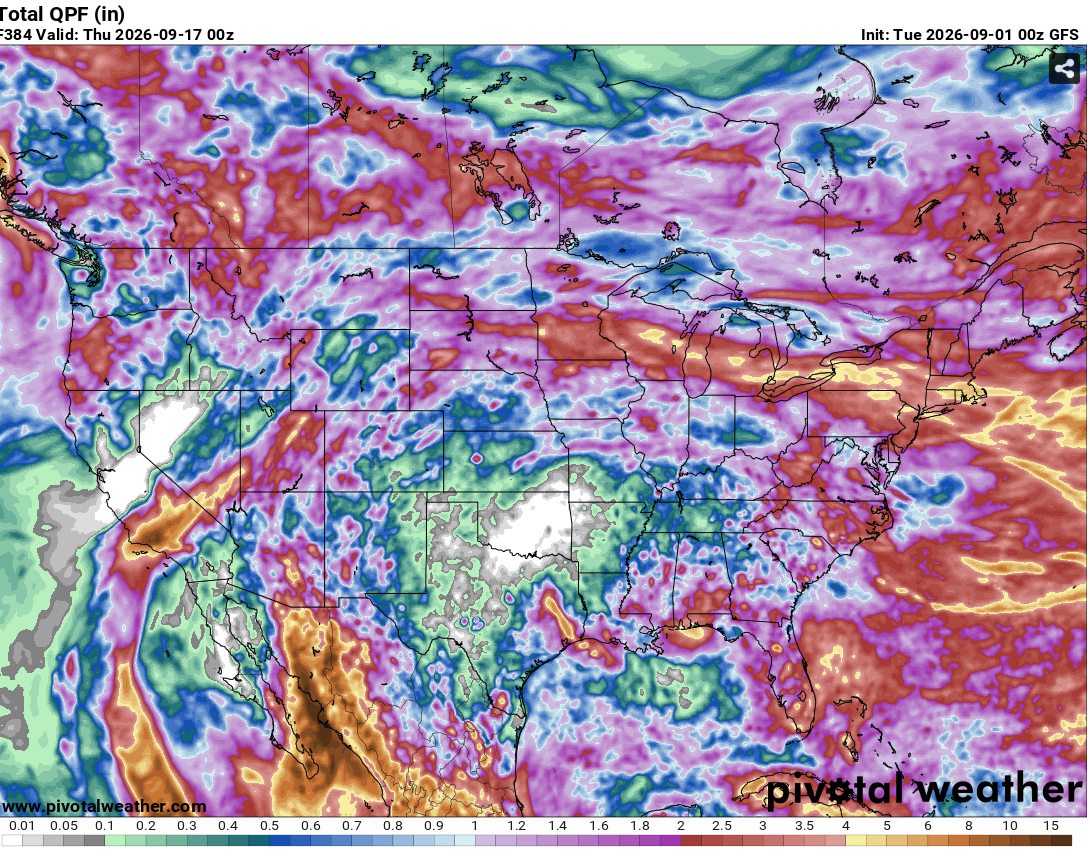
guidance hinting at a wet pattern returning to the northwoods
-
So much what was said in that post could have easily been condensed down to !~25% of its original and still said the same thing!
-
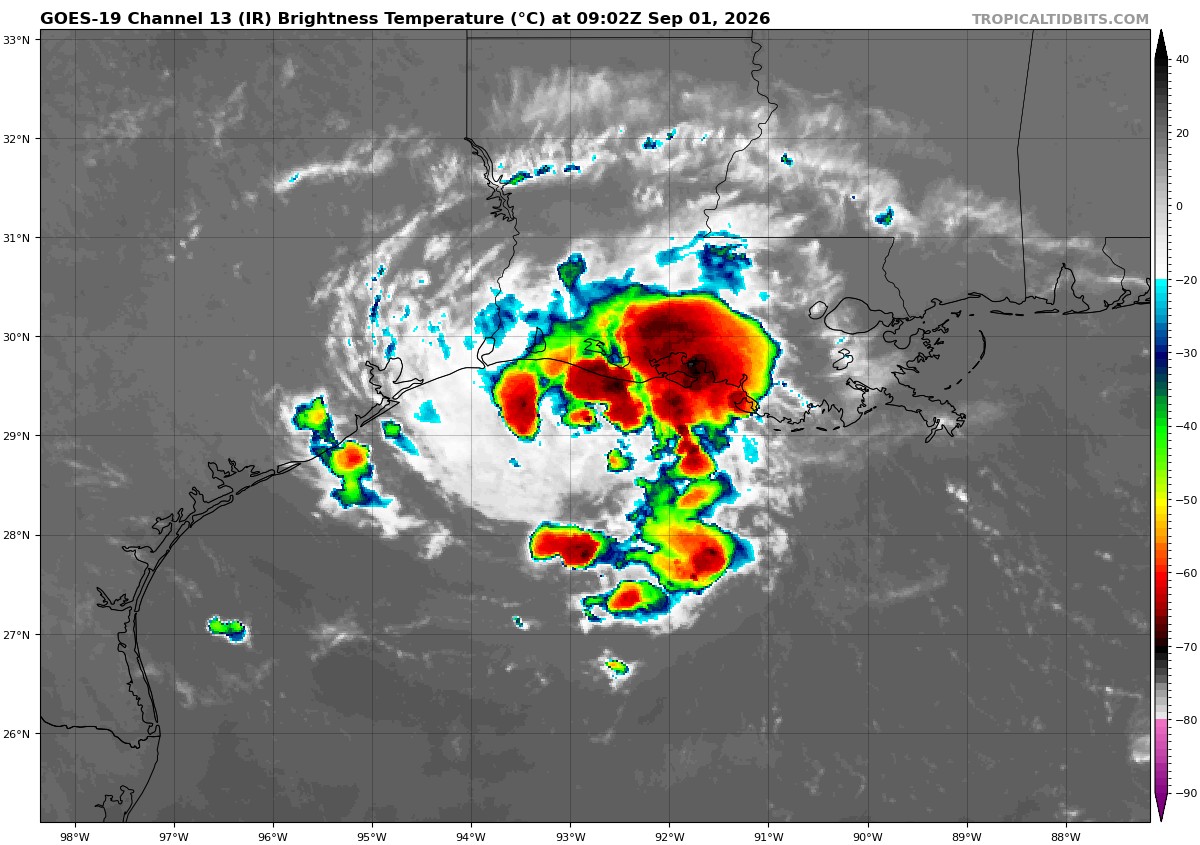
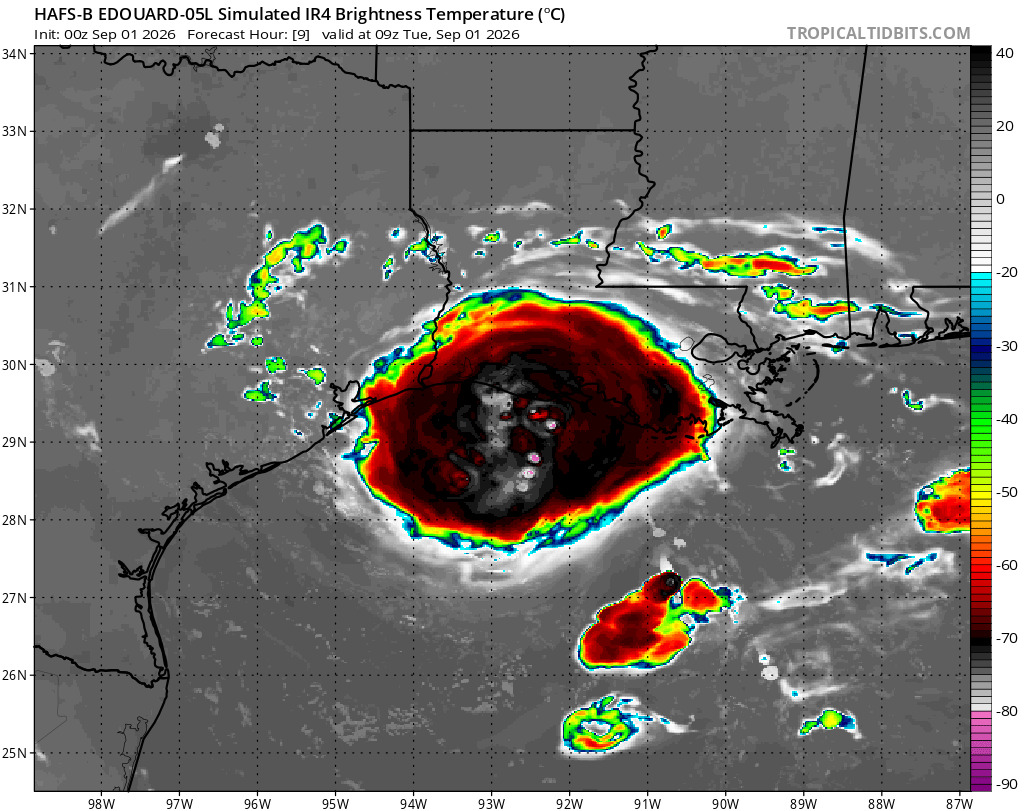
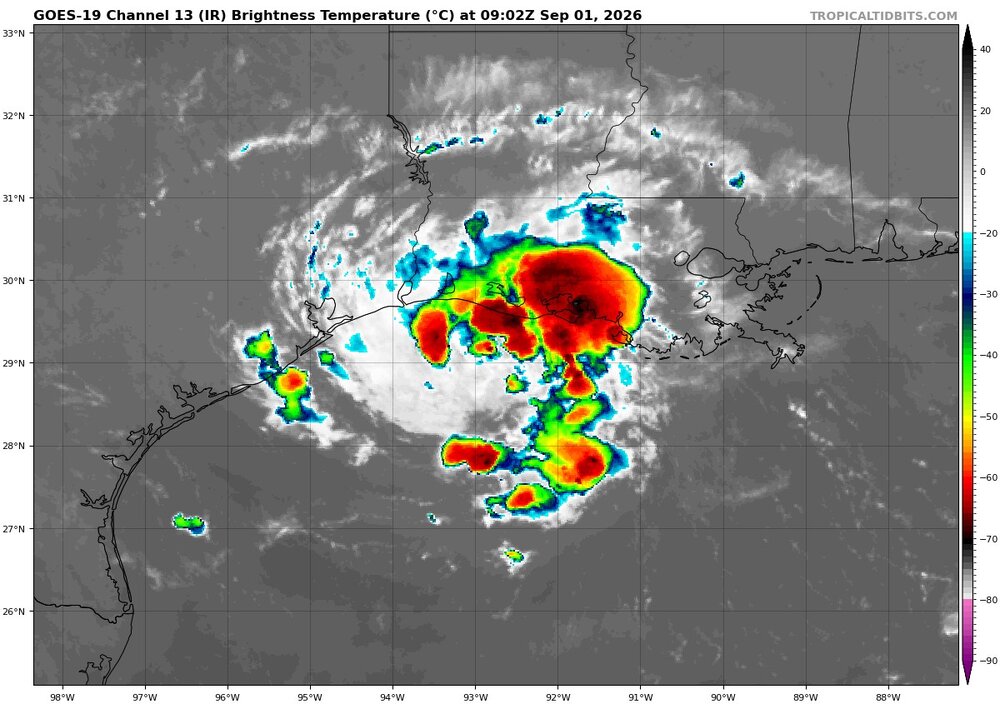
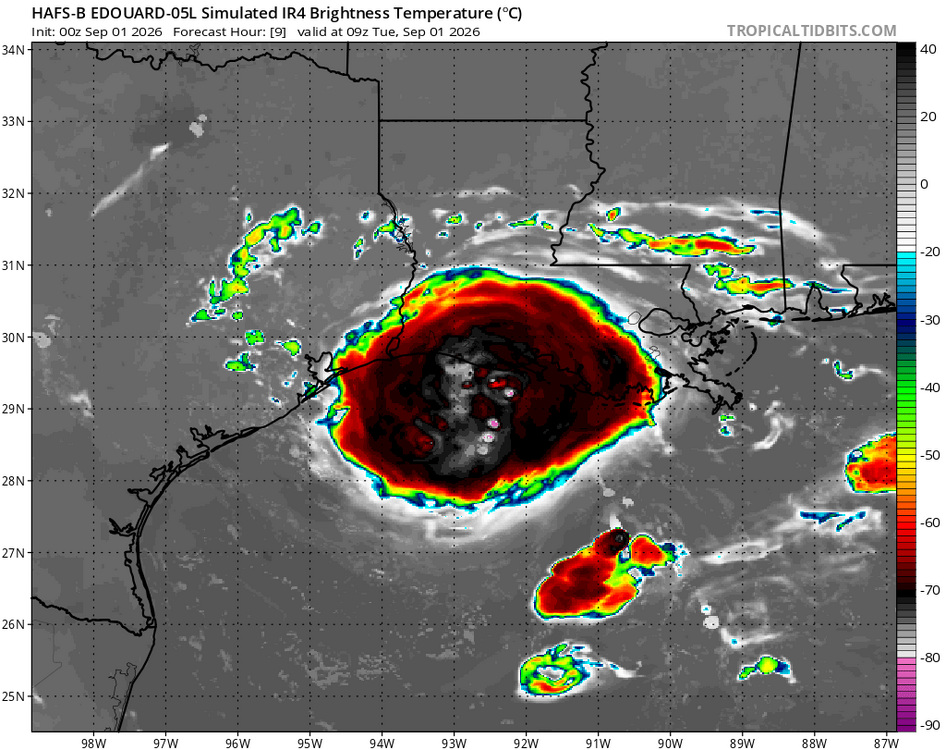
NHC follows the 00z HAFS-B, but here is the current 09z EIR, and the fcst EIR valid 09z from the HAFS-B. This I find a problem often the days, some stick to the model fcst and persist in not altering at all a fcst when the model is already wrong in its short-term verification. That's not good. Objectivity, the HAFS-B is quite wrong here for satellite presentation. Now I know that does not mean RI is off the table, but one just can't ignore the model shortcomings here and still stay the course on an earlier fcst. And NHC mentioned nothing about the ESE shear I pointed out earlier that was apparent on satellite, or the low environmental RH that persists, or how earlier more banded convection is now becoming more irregular (blobs). These are non-trivial observations as to what is going on real-time. Actual empirical observations override any model fcst every time.
-

2026-2027 Record-breaking El Nino
OSUmetstud replied to Stormchaserchuck1's topic in Weather Forecasting and Discussion
Because of this, the offical NOAA monthly data will likely be in the neighborhood of maybe like 2.2C for non-relative nino 3.4 and 1.8C for relative for August. BOM, UKMET, and ECMWF data may run warmer because of the difference in sst analysis and the integration of high resolution sst data that noaa is not doing. -
socal ready 2 mudslide?
- Today
-
https://x.com/MLB/status/2094650895120191545
-
2026-2027 Record-breaking El Nino
OSUmetstud replied to Stormchaserchuck1's topic in Weather Forecasting and Discussion
Ahh..okay. So the main disconnect im seeing with the cooler relative noaa data is the actually the difference in sst analysis. The non-relative oisstv2.1 is running considerably warmer than the non-relative ersstv6. This is because of the courser nature of ersstv6 and the lack of satellite data integration. The ersstv6 is best for historical comparisons but it will tend to not see the real warmest anomalies because of its nature. -

2026-2027 Record-breaking El Nino
mitchnick replied to Stormchaserchuck1's topic in Weather Forecasting and Discussion
How does using Jan-Mar look? My guess is that Nov & Dec have the greatest +anomalies, but I could be wrong of course. -
News flash: The vegetation around that site has been extensively cleared in order to remove a large tree next to the enclosure. This may reduce the apparent discrepancy in temperature trends relative to other NY area sites.
-
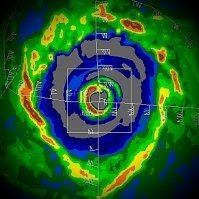
Deeper cells appear to be trying to build around the small central vortex. Also, it does appear that the southern side of the circulation is beginning to fill in with precipitation somewhat and perhaps is feeling the lower central pressure with increasing low-level westerly flow. Now, to see if ongoing deeper convection does take off before the window closes this morning.
-

E PA/NJ/DE Summer 2026 Obs/Discussion
Birds~69 replied to PhiEaglesfan712's topic in Philadelphia Region
70F/DP 69F at 5am Perhaps some more downpours today... -
^ I concur. There were some fallacies pertaining to the current particular situation with Edouard versus just some rather highly detailed overexplaining of the prototypical pre-intensification process we see in early onset TCs with respect to shallow convection. At any rate, I wouldn't go so far as to say it was AI regurgitation. But I did scratch my head as I don't see how some of that applies here. We may very well see deep convection take off due to internal dynamics nearto Eduardo's small vortex this morning (and there are hints that may be starting to occur on radar and satellite), but I digress.
-

Septorcher 2026 Discussion - Endless Summer
SnoSki14 replied to Damage In Tolland's topic in New England
Looks like heat dome stays SW of here hence the over the top storms expected. Thank God because upper 90s would've been brutal to start September -
2026-2027 Record-breaking El Nino
SnoSki14 replied to Stormchaserchuck1's topic in Weather Forecasting and Discussion
Lol yeah no. -
legitimate online pharmacy: QuickPh and medstore online pharmacy